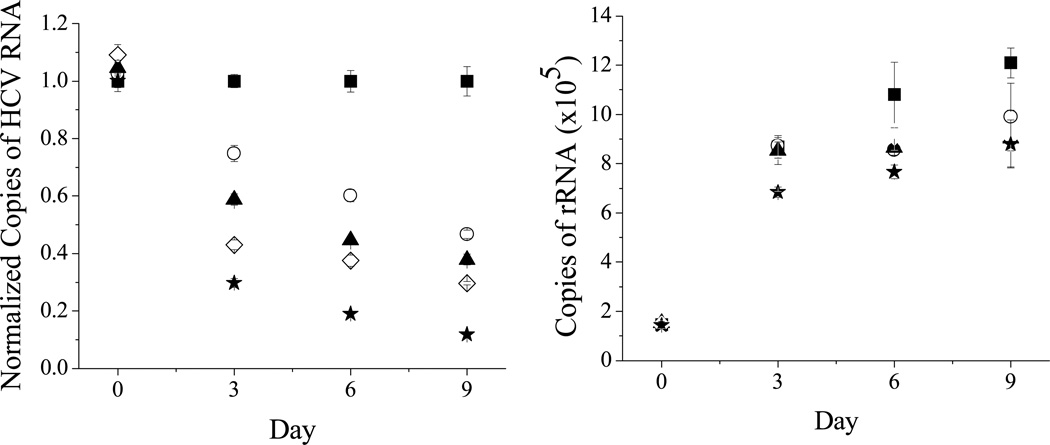
Figure 7.
RT-PCR results showing the preferential cleavage of HCV RNA (left) over ribosomal RNA (right) at increasing dosages of 1-Cu, where medium and complex are replenished at 3 day intervals. 0 µM (black square), 2.5 µM (white circle), 5 µM (black triangle), 10 µM (white diamond), 20 µM (black star). The graph on the left is normalized to the RNA levels in the absence of metallopeptide. A colored image is included in supplementary material (Figure SM10).

