

Abstract
Accurately estimating patient-specific rupture risk remains a primary challenge in timing interventions for abdominal aortic aneurysms (AAAs). By re-analyzing published biaxial mechanical testing data from surgically repaired human AAAs, material anisotropy emerged as a potentially important determinant of patient-specific lesion progression. That is, based on a new classification scheme, we discovered that anisotropic aneurysmal specimens correlated with increased patient age at surgery when compared with more isotropic specimens (79.7 vs. 70.9 years, p<0.002), despite no significant difference in maximum diameter. Furthermore, using an idealized axisymmetric, finite-element growth and remodeling model of AAA progression, we found that both the initial axial extent of elastin loss and ongoing damage to elastin in the shoulder region of the AAA directly affected the degree of anisotropy as the lesion evolved, with more extensive insults increasing the anisotropy. This effect appeared to be mediated by alterations in axial loading and subsequent differences in orientation of deposited collagen fibers. While the observed increased age before surgical intervention may suggest a potential benefit of anisotropic remodeling, future biaxial tests coupled with pre-surgical data on expansion rates and detailed theoretical analyses of the biostability of a lesion as a function of anisotropy will be required to verify its clinical relevance to patient-specific rupture risk.
Keywords: growth and remodeling, computational biomechanics, stiffness, rupture risk, axial stress, elastin damage
Introduction
Abdominal aortic aneurysms (AAAs) represent a significant cause of mortality in older populations (WISQARS, 1999–2007). While medical imaging allows prompt diagnosis of an AAA, either as an incidental finding or upon ultrasound screening, accurate prognosis has proven more challenging. This limitation is especially relevant to the surgeon who must weigh the risk of surgical repair against the risk of rupture for a given patient. Current clinical guidelines generally use maximum diameter or expansion rate to estimate rupture risk; yet, small lesions can rupture, and there is a pressing need to identify more robust, patient-specific risk assessments to improve clinical outcomes.
Following the seminal paper by Fillinger et al. (2003), which suggested that patient-specific estimates of wall stress may better indicate rupture risk than maximum diameter alone, increasingly sophisticated computational models have been pursued to assess AAA mechanics. Of these models, a unique class has arisen that aims to capture not only a static representation of the wall mechanics, but also the dynamic turnover of intramural constituents that govern the evolving geometry and properties, and hence rupture risk. Such “growth and remodeling” (G&R) models have investigated, amongst other aspects, roles of collagen recruitment (Watton et al., 2004), spatial losses of elastin (Zeinali-Davarani et al., 2011), effects of wall shear stress (Sheidaei et al., 2011), importance of initial aortic properties (Wilson et al., 2012), and collagen undulation (Martufi and Gasser, 2012). While these and other complexities, such as intraluminal thrombus, are being incorporated into G&R frameworks, we emphasize the importance of continuing to explore fundamental relationships amongst the myriad parameters that control the G&R process and how they may ultimately influence patient-specific outcomes.
Along these lines, we recently developed an idealized, axisymmetric, G&R membrane model to evaluate parametrically four key aspects of collagen remodeling in AAAs: production rates, half-life, deposition stretch, and stiffness (Wilson et al., 2013a). Here, we build on these results, and evaluate roles of anisotropy revealed by biaxially tested human AAA specimens (Vande Geest et al., 2006). In particular, we introduce a novel classification system and demonstrate potential patient-specific causes of this anisotropy by evaluating parametrically the effects of the axial extent of the initial elastolytic insult and ongoing elastic damage on the development of AAAs.
Methods
Using multiple tension-controlled protocols, Vande Geest et al. (2006) biaxially tested 26 non-ruptured human AAA samples excised near the maximum diameter of the lesion during surgical repair. Using equibiaxial data from those 25 samples for which patient age and maximum lesion diameter were reported, we classified anisotropy by comparing the “elbow stretch” (or, transition point) for each stress-stretch curve. Similar to Holzapfel (2006), this elbow was represented by the value of stretch associated with the maximum perpendicular line segment connecting this point to a secant defined by the first and last data points where the Cauchy stress was less than or equal to 80 kPa. This cutoff value of stress allowed a more equal comparison amongst patients given the large range of maximum stresses. For the few curves not reaching 80 kPa, the final data point was used for the secant. Statistical comparisons were performed using a t-test between two groups with assumed unequal variances. Significance was assumed for p<0.05.
For the parametric studies, we used a prior finite element membrane model of the growth and remodeling of axisymmetric aneurysms (Baek et al., 2006; Wilson et al., 2012, 2013a). Briefly, classical linear momentum balance is enforced quasi-statically in weak form using a virtual work approach while a rule-of-mixtures relation describes the overall stored energy of the wall as the sum of energy contributions from six families of load-bearing constituents: an isotropic elastin-dominated matrix, circumferentially oriented smooth muscle, and four collagen-dominated families of fibers oriented circumferentially, axially, and symmetric diagonally. The Cauchy membrane stress at any position (r,z) in the wall and each G&R time s is
| (1) |
where F2D(s) and C2D(s) are 2-D deformation gradient and right Cauchy-Green tensors describing the motion from a computationally convenient reference configuration to the in vivo configuration at time s, wR (s) is the sum of the energy stored in all load-bearing constituents, Tact (s) is the magnitude of the active component of tension, and eϑ represents the unit vector in the circumferential direction. Cauchy stress is calculated in post-processing by dividing the membrane stress by the current wall thickness h(s), where
| (2) |
MR (s) is the referential areal mass density for the wall, λ1(s) and λ2(s) are the circumferential and axial stretches from reference to current configurations, respectively, and ρ is the total mass density of the wall (assumed constant at 1050 kg/m3).
Of particular importance herein, the stored energy for elastin, defined per unit reference area at each position and time s, is
| (3) |
where is the referential areal mass density at time 0, Qe (s) ∈ [0,1] is the survival fraction for elastin from time 0 to s, is the stored energy for elastin per unit mass at s (neo-Hookean), and is the right Cauchy-Green tensor describing the deformation of elastin from its native (i.e., stress-free) configuration to its current configuration at time s. Qe(s) is a spatially non-uniform survival function that includes a prescribed initial elastolytic insult ( ) and further losses due to stretch-induced damage ( ), such that
| (4) |
where is the first invariant of . For illustrative purposes, we let (Wilson et al., 2012),
| (5) |
where k =1/40 d−1 is a rate parameter, and at each referential axial position Z,
| (6) |
Z0 is the fixed axial length from the end of the aorta to its midpoint, rh is the initial (homeostatic) radius, d is the maximum percent loss of elastin, and d1 and d2 control the initial spatial distribution of elastolysis. To explore various axial extents of initial elastolysis, we let d1 = [0.007, 0.7, 70, 700] while Z0 = 15 cm, rh = 1 cm, d = 0.99, and d2 = 6. Note that the larger the value of d1, the more focal the elastolytic insult. In addition, we compared equivalent amounts (as opposed to axial extents) of initial elastolysis by varying d and d1 in Equation 6 such that ∫f∞(Z)dZ was constant over the entire length. Specifically, we let d = [0.99, 0.75, 0.50] and d1 = [0.700, 0.132, 0.012].
For elastin damage (Wilson et al., 2012), we let for and
| (7) |
for , where is the first invariant calculated for an ultimate uniaxial stretch of (cf. Lillie and Gosline, 2007), such that
| (8) |
and is a generalized first invariant, which for our 2D model is
| (9) |
where and represent stretches from the natural configuration of elastin in circumferential and axial directions, respectively. is prescribed as a 99% survival at a uniaxial elastin stretch of ( ) from its natural configuration. For simulations parametrically exploring the ultimate stretch of elastin, we let while maintaining d1 =0.7.
Load-bearing elastin is thus lost, not produced, during the G&R process. In contrast, collagen and smooth muscle are produced and degraded according to local deviations from homeostatic stress, with deposition angles of newly deposited diagonal collagen fibers evolving to align with the current orientations of the symmetric diagonal families. Details can be found in Wilson et al. (2012, 2013a).
The reference configuration (s=0) was chosen as the in-vivo, loaded, “homeostatic” configuration; hence, ; that is, elastin is pre-stressed in the reference configuration. Key G&R parameters and properties of the non-aneurysmal vessel were first prescribed for a single, aged, subject-specific (66 year-old male) aorta studied by Vande Geest et al. (2004), as reported in Wilson et al. (2012). In this way, all initial parametric results related to the same baseline conditions. Indeed, note that these baseline values cannot be varied independently without causing an a priori deviation from homeostasis, which would complicate interpretation of the parametric study. To explore the effect of different baseline conditions (e.g., pre-stretch of elastin or stiffness of collagen), additional simulations were performed using parameters for four subject-specific aortas (ages 47–69) reported in Wilson et al. (2012) (Table 1).
Table 1.
“Best-fit” material parameters for the primary load-bearing constituents for four subject-specific non-aneurysmal abdominal aortas (66 year-old male, 47 year-old male, 50 year-old female, and 69 year-old male) reported in Wilson et al. (2012). Key G&R parameters for each simulation include production gain parameters for collagen ( ) and smooth muscle ( ), homeostatic half-life of collagen and smooth muscle fibers ( ), half-life of unloaded collagen fibers ( day), and maximum age of fibers (Amax =300 days). For a full listing of G&R equations, see Wilson et al. (2012, 2013a).
| CONSTITUENT | G&R PARAMETER | UNITS | SYMBOL | 66 / M | 47 / M | 50 / F | 69 / M |
|---|---|---|---|---|---|---|---|
| Collagen | initial mass fraction | -- | ϕc | 0.62 | 0.55 | 0.63 | 0.77 |
| deposition stretch | -- |
|
1.06 | 1.05 | 1.03 | 1.03 | |
| stiffness parameter 1 | J/kg |
|
1136 | 1747 | 2667 | 2610 | |
| stiffness parameter 2 | -- |
|
11.2 | 10.6 | 16.0 | 20.8 | |
|
| |||||||
| Smooth Muscle | initial mass fraction | -- | ϕm | 0.15 | 0.15 | 0.15 | 0.15 |
| deposition stretch | -- |
|
1.10 | 1.10 | 1.10 | 1.11 | |
| stiffness parameter 1 | J/kg |
|
15.2 | 24.2 | 30.9 | 40.4 | |
| stiffness parameter 2 | -- |
|
11.4 | 11.8 | 11.7 | 12.9 | |
|
| |||||||
| Elastin | initial mass fraction | -- | ϕe | 0.23 | 0.30 | 0.22 | 0.08 |
| deposition stretch (circ.) | -- |
|
1.34 | 1.29 | 1.18 | 1.19 | |
| deposition stretch (axial) | -- |
|
1.25 | 1.30 | 1.29 | 1.21 | |
| stiffness parameter | J/kg | ce | 72 | 74 | 87 | 101 | |
Results
The equibiaxial stress-stretch data for the 25 AAA samples tested by Vande Geest et al. (2006) reveal significant patient-to-patient variability (Figure 1a). Yet, the circumferential data appeared to separate into two groups (note the gap at λ=1.05). A histogram of “elbow stretches” for both the circumferential (black) and axial (gray) data (Figure 1b) further suggested a possible bimodal distribution, with a few outliers at stretches greater than 1.10. By defining three ranges of behavior based on extensibility (“stiff” for λ≤1.04, “moderate” for 1.04<λ≤1.10, “compliant” for λ>1.10), each AAA sample was assigned to one of four subgroups based on its paired circumferential-axial elbow stretches: stiff-stiff, stiff-mod, mod-mod, or mod-compliant (Figure 1c). Table 2 lists averages for each subgroup and shows statistical comparisons between AAAs with stiff (stiff-stiff and stiff-mod) or moderate (mod-mod and mod-compliant) circumferential behaviors as well as comparisons between nearly “isotropic” (stiff-stiff and mod-mod) and “anisotropic” (stiff-mod and mod-compliant) AAAs. Of note, the average age of the anisotropic group was statistically greater than that of the isotropic group (79.7 vs. 70.9 years, p<0.002) despite their average diameter being smaller, albeit not statistically so (6.2 vs. 6.7 cm, p<0.26). No statistical difference was observed in age or maximum diameters between the circumferentially stiff and moderate groups.
Figure 1.

(a) Equibiaxial stress-stretch data for 25 AAAs (Vande-Geest et al., 2006): circumferential (black), axial (gray). (b) Histogram of elbow stretches for all data. (c) Subgroups of paired circumferential-axial behaviors using the following cutoffs for elbow stretch: stiff (λ≤1.04), moderate (1.04<λ≤1.10), compliant (λ>1.10). The * denotes a potential outlier.
Table 2.
Number of samples, age, maximum aortic diameter, and circumferential ( ) and axial ( ) elbow stretches for each subgroup and comparison grouping expressed as mean ± standard deviation, along with relevant p-values. Stiff circumferentially (stiff-stiff, stiff-mod), moderate circumferentially (mod-mod, mod-compliant), isotropic (stiff-stiff, mod-mod), anisotropic (stiff-mod, mod-compliant).
| GROUP | SAMPLES | AGE | DIAMETER |
|
|
||
|---|---|---|---|---|---|---|---|
| (Circ.-Axial) | -- | (years) | (cm) | -- | -- | ||
| Stiff-Stiff | 7 | 69.4 ± 4.6 | 6.30 ± 1.48 | 1.019 ± 0.012 | 1.017 ± 0.015 | ||
| Stiff-Mod | 7 | 79.9 ± 6.4 | 6.24 ± 0.97 | 1.024 ± 0.006 | 1.065 ± 0.019 | ||
| Mod-Mod | 8 | 72.3 ± 7.2 | 7.13 ± 1.53 | 1.063 ± 0.013 | 1.068 ± 0.017 | ||
| Mod-Compliant | 3 | 79.3 ± 4.7 | 6.07 ± 0.86 | 1.073 ± 0.014 | 1.131 ± 0.012 | ||
|
| |||||||
| Stiff Circ. | 14 | 74.6 ± 7.6 | 6.27 ± 1.20 | 1.022 ± 0.009 | 1.041 ± 0.030 | ||
| Mod Circ. | 11 | 74.2 ± 7.2 | 6.84 ± 1.43 | 1.065 ± 0.014 | 1.085 ± 0.033 | ||
|
| |||||||
| Isotropic | 15 | 70.9 ± 6.1 | 6.74 ± 1.51 | 1.042 ± 0.026 | 1.044 ± 0.031 | ||
| Anisotropic | 10 | 79.7 ± 5.7 | 6.19 ± 0.90 | 1.039 ± 0.025 | 1.085 ± 0.036 | ||
| COMPARISON | AGE | DIAMETER |
|---|---|---|
| p-value | p-value | |
| Stiff Circ. vs. Mod Circ. | 0.88 | 0.30 |
| Isotropic vs. Anisotropic | 0.0015 | 0.26 |
Despite prescribing four different initial axial extents of elastolytic insult, the G&R model predicted a qualitatively similar evolution of the lesions (Figure 2a–d) as well as similar final geometries (Figure 2e) when each simulation was stopped at a maximum diameter of ~6.5 cm, consistent with the average diameter of the AAAs tested by Vande Geest et al. (2006). Nevertheless, the final apical wall thickness and axial stress varied by more than 50% amongst the four trials. Simulated equibiaxial tension tests at the apex of each lesion revealed that the final paired equibiaxial behavior became more isotropic the more focal the insult, that is, as d1 increased (Figure 3). This effect was verified for the other three subject-specific starting conditions (Figure 4). In addition, assessment of the evolving lesion at a fixed d1 =0.7 (Figure 5, showing results at 0, 100, 2000, and 4200 days) suggested that the significant stiffening that followed elastolytic insult and aneurysmal formation resulted in progressively increasing anisotropy due to diverging circumferential and axial behaviors. Parametric studies investigating effects of equal amounts of initial elastolysis and damage criteria for elastin (via ultimate stretch) similarly demonstrated that an increased loss of elastin in the neck and shoulder regions augmented anisotropic remodeling (Figure 6). Finally, Figure 7 shows the time course and final spatial distribution of the deposition angle of the first diagonal family of collagen fibers (with respect to the axial direction) and of the ratio of axial to circumferential Cauchy stresses, highlighting a likely cause of the observed evolving anisotropy via compensatory, stress-mediated deposition of collagen at evolving orientations.
Figure 2.

Evolution of (a) radius, (b) thickness, and (c–d) circumferential and axial Cauchy stresses at the apex of four simulated AAAs from the 66 year-old initial aorta using values of elastolytic parameter d1 of 0.007 (solid), 0.7 (dashed), 70 (dash-dotted), and 700 (dotted), where increasing d1 represents a more focal insult. (e) Final geometry of each simulated AAA when maximum diameter was approximately 6.5 cm. Horizontal gray line represents the homeostatic pre-aneurysmal value.
Figure 3.
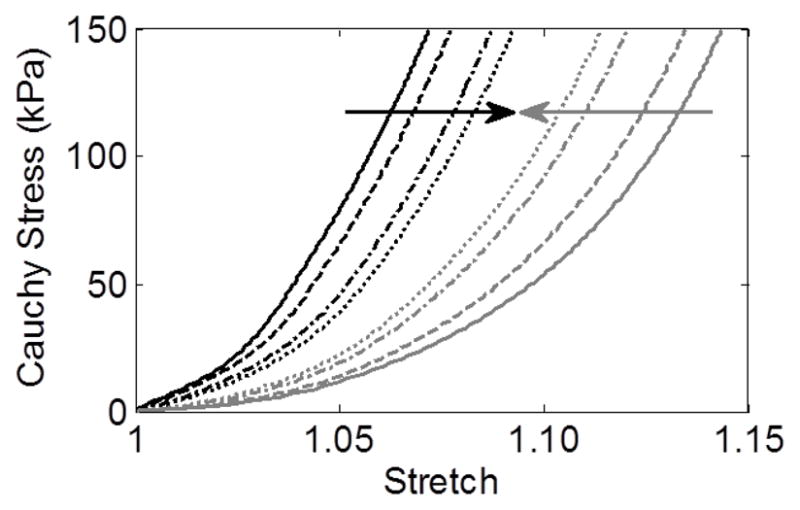
Final equibiaxial stress-stretch curves (circumferential – black, axial – gray) at the apex of each of four simulated AAAs from the 66 year-old initial aorta using values of elastolytic parameter d1 of 0.007 (solid), 0.7 (dashed), 70 (dash-dotted), and 700 (dotted). Arrows show a trend toward isotropy as d1 increases (i.e., the insult is more focal).
Figure 4.

Final equibiaxial stress-stretch curves (circumferential – black, axial – gray) at the apex of simulated AAAs from the (a) 47 year-old, (b) 50 year-old, and (c) 69 year-old initial aortas using values of elastolytic parameter d1 of 0.007 (solid) and 700 (dotted). Note the consistent trend toward isotropy as d1 increases (i.e., the insult is more focal).
Figure 5.
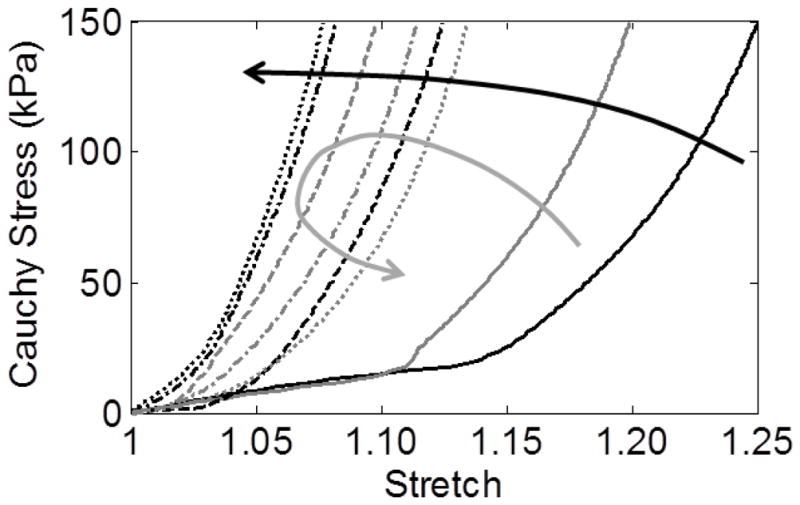
Evolution of stress-stretch behavior at the apex of a simulated AAA (66 year-old, d1=0.7) after 0 days (solid), 100 days (dashed), 2000 days (dash-dotted), and 4200 days (dotted). Note the progressive circumferential stiffening (black arrow) but initial stiffening followed by gradual softening axially (gray arrow), which tends to increase the anisotropy over time.
Figure 6.
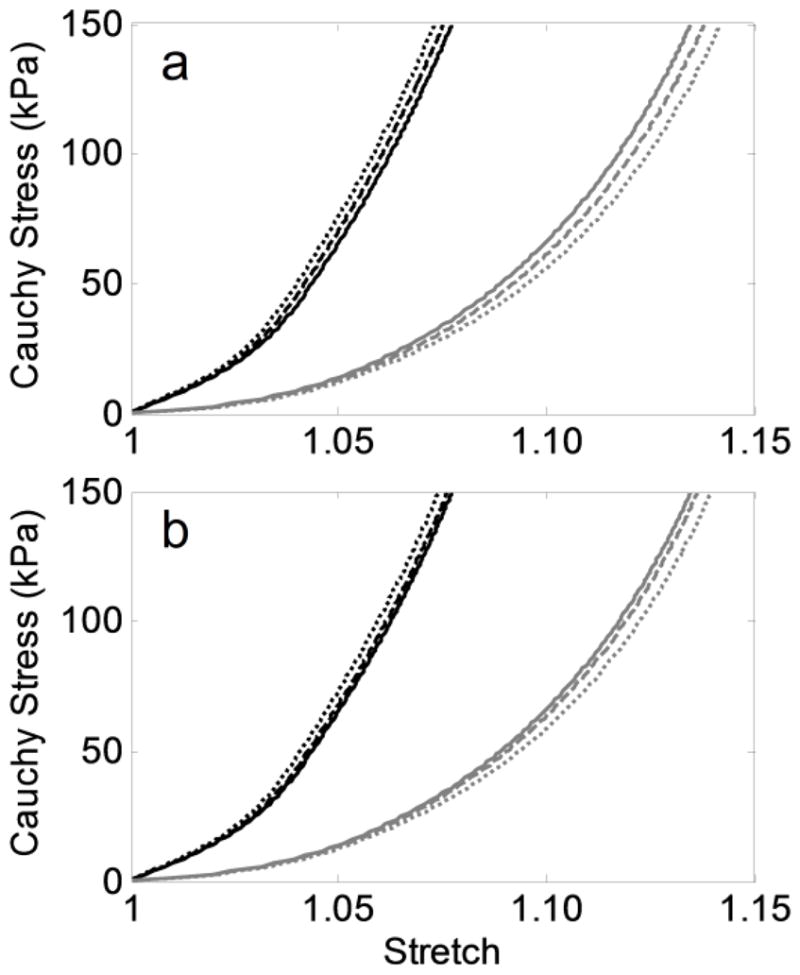
Final equibiaxial stress-stretch curves (circumferential – black, axial – gray) at the apex of simulated AAAs from the 66 year-old initial aorta by parametrically varying (a) the elastolytic parameters d and d1 (Equation 6) to allow equal amounts of initial elastolysis (where for [d,d1]: solid – [0.99,0.700], dashed – [0.75,0.132], dotted – [0.50,0.012]), and (b) the ultimate stretch of elastin (Equation 8) to alter the degree of elastin damage (where for : solid – 2.2, dashed – 2.0, dotted – 1.8).
Figure 7.
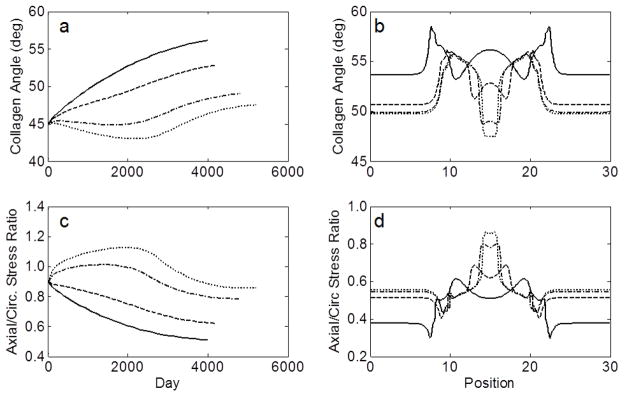
Evolution at the apex (a) and final spatial distribution (b) of the angle of the first diagonal collagen family and the axial/circumferential stress ratios (c–d) of four simulated AAAs from the 66 year-old initial aorta using values of elastolytic parameter d1 of 0.007 (solid), 0.7 (dashed), 70 (dash-dotted), and 700 (dotted).
Discussion
AAAs are characterized histologically by loss of functional elastin and smooth muscle and altered turnover of collagen (Eberlová et al., 2013; He and Roach, 1994). These changes not only lead to geometric dilatation, but also a “stiffening” of the aortic wall that can be appreciated as a leftward shift of a standard stress-stretch curve (i.e., a loss of extensibility). Classically, the stress-stretch behavior of an elastic artery, such as the aorta, is highly nonlinear and qualitatively represents two mechanical behaviors: an elastin-dominated portion characterized by high extensibility and a collagen-dominated portion characterized by increasing resistance to stretch as collagen fibers become engaged. The approximate transition between these two sections is often referred to as the “elbow” of the curve. When the elastic fibers and smooth muscle are severely compromised, such as in an AAA, the collagen may no longer be compressed when the artery is unloaded for mechanical testing (cf. Ferruzzi et al., 2011a). As a result, collagen engages at a lower stretch relative to the unloaded configuration, and the overall behavior of the wall appears stiffer. Whereas such stiffening results from the loss of elastic fibers and smooth muscle and their effects on the collagen, stiffening may also occur by altering the inherent stiffness of the collagen itself (e.g., through increased cross-linking), its orientation, or the pre-stretch of newly deposited fibers (cf. Wilson et al., 2013a).
Clinical experience and previous evaluations of aneurysmal and control aortic samples consistently suggest that AAAs are generally stiffer than non-dilated control aortas, even if aged (Ferruzzi et al., 2011b). The present results further suggest two potential subgroups of AAAs based on relative circumferential stiffness in available equibiaxial data (solid lines, Figure 1a). The underlying reason for this observation is unknown due to a lack of associated histological information. We hypothesize, however, that this grouping may reflect the final loss of functional elastin and smooth muscle in the stiffest group, leaving primarily collagen to determine the material behavior. While the moderate group is stiffer than non-dilated, age-matched aorta, remnant elastin and/or smooth muscle may still place collagen in compression upon unloading, thus extending the elbow stretch. Because the pre-stretch of smooth muscle (~1.10) is greater than that of collagen (~1.05), its partial presence may be the difference between the two groups, with the fragmentation/loss of elastin (pre-stretch ~1.2–1.3 depending on age, health, and risk factors) accounting for the dramatic stiffening from the healthy to aneurysmal state as seen in our simulations (Figure 5). Alternatively, competing hypotheses that may contribute to this grouping include the possibility of cross-linking increasing the stiffness of collagen in compression (effectively shifting the origin of the stress-stretch curve to the right), an increased dispersion of values of current stretch for individual collagen fibers (e.g., due to rapid expansion or preservation of older collagen fibers due to increased thickness or cross-linking), or weakening of previously deposited or new collagen fibers. Nevertheless, the discrete nature of these two groups (as opposed to a single continuous spectrum) suggests the potential of a discrete cause. Larger sample sizes and histology will be useful to confirm the nature of these groups.
Using the histogram of elbow stretches in Figure 1b to define cutoffs of 1.04 and 1.10, four novel subgroups of AAAs emerged. Visual inspection of Figure 1c suggests that this estimation of elbow stretch provided a reasonable separation of groups, with the possible exception of one patient in the mod-mod group (axial plot indicated by an asterisk). Although comparing samples with increased circumferential stiffness to those with moderate stiffness did not reveal significant differences in diameter or patient age (Table 2), comparing the more anisotropic with isotropic samples revealed a significantly higher age of the former (79.7 vs. 70.9 years, p<0.002); even a reassignment of the one patient in question to the mod-compliant group preserved this significant difference (78.1 vs. 71.6 years, p<0.03).
This difference in age may represent a potentially important clinical finding as the data are from tissue collected during open repair of non-ruptured AAAs. For example, if one assumed a similar average age of onset of all lesions and noted the lack of statistical difference in AAA diameter, the anisotropic group potentially experienced slower expansion (on average). The older age may suggest a further benefit, in that patients with less stable lesions would have ruptured or undergone repair at a younger age. Of note, the isotropic group also possessed the six largest AAAs (7.6–9.0 cm), though the difference in average diameter did not reach significance. Interestingly, Tong et al. (2011) reported that increased anisotropy of the aortic wall associates with increased histological age and anisotropy of the luminal layer of the intraluminal thrombus, which is present in most AAAs. For this layer of the thrombus to remain luminal, newly deposited fresh thrombus cannot bury it, such as might occur in expanding lesions with increasingly disturbed blood flow (Basciano et al., 2011; Wilson et al., 2013b). Thus, aged luminal thrombus may also reflect slower expansion. Should the degree of anisotropy prove to predict aneurysmal expansion or rupture risk, one would need to determine how to classify anisotropy non-invasively for clinical usefulness. We note, therefore, that 13/15 (87%) of the isotropic group and 10/10 (100%) of the anisotropic group can be correctly categorized for this small data set by assigning to the isotropic group any AAA patient of age less than 74 years or diameter greater than 7.5 cm.
On the other hand, caution is warranted since the time of onset of a given AAA is almost always unknown and neither expansion rates nor histology were reported with this data set. Additionally, the biostability of a given AAA’s classification is unclear. For example, Kurvers et al. (2004) report that many AAAs expand intermittently, not continuously. One might question, therefore, whether the anisotropy of these lesions would change if measured during a period of expansion versus arrest. The less stiff axial behavior of the anisotropic lesions could also associate with decreased strength, as suggested by Tong et al. (2011). While such remodeling could reflect decreased loading due to a shielding effect from a stiffer, mature luminal thrombus, a rupture through the luminal layer of thrombus (sometimes visualized as a crescent sign on CT scans – a negative prognostic indicator) could expose the remodeled wall to a rapid increase in load as well as renewed proteolytic activity from fresh blood and thrombus (cf. Wilson et al., 2013b), thus increasing rupture risk. Finally, this data set from repaired AAAs may be subject to selection bias as the decision to operate was based on the surgeon’s discretion. For example, an increased risk of surgery in the oldest patients may have influenced a decision to operate only on those lesions thought to be at highest risk. Clearly, further clinical and experimental investigation is required; nevertheless, the possibility of material anisotropy being related to expansion rate and/or rupture risk is intriguing.
Having identified anisotropy as a potentially important factor in aneurysmal progression, we turned to our computational model to explore potential causes of its development. The predicted time of progression of material anisotropy following initiation of an AAA (Figure 5) suggested an interesting divergence of the circumferential and axial mechanical behavior at the apex of the lesion over time. Circumferentially, the stiffness increased rapidly as elastin and smooth muscle were lost, even before significant dilatation; yet, there was little further stiffening of the remaining collagenous wall after 2000 days when no elastin or smooth muscle remained (due to elastin reaching its mechanical failure and the assumed loss of smooth muscle cells via anoikis). Axially, there was also a rapid initial stiffening, but this was followed by a gradual increase in compliance due, at least in part, to a reorientation of the deposition angle of newly deposited diagonal collagen fibers toward the circumferential direction in response to a decreasing axial:circumferential stress ratio (Figure 7), as well as a decreased axial versus circumferential stress-mediated deposition of collagen. As a result, anisotropy increased, at least at the apex in this example with a representative elastolytic insult for the given G&R parameters.
Comparing G&R outcomes for various axial extents of elastolytic insult (Figures 2–3), greater insults produced a more rapid dilatation and a greater degree of anisotropy. The greater rate of expansion is logical given the larger initial loss of elastin (i.e., a greater axial extent of the aorta was affected). This insult resulted in a greater initial increase in circumferential Cauchy stress, which induced a more robust stress-mediated G&R response. Interestingly, the greater axial extent of elastolysis also resulted in a smaller increase in axial stress at the apex and a greater decrease in axial stress over baseline near the fixed ends (not shown). As a result, the axial:circumferential stress ratio was lower, and the diagonal collagen fibers rotated circumferentially to a greater degree (Figure 7), which along with a decreased axial versus circumferential stress-mediated deposition of collagen, likely contributed to the increased anisotropy. The decreased axial load and increased stress-mediated deposition of collagen (due to the larger initial change in stress) also increased wall thickness (Figure 2b) via their effects on λ2(s) and MR(s), respectively, in Equation 2. Interestingly, additional G&R simulations (not shown) revealed that by increasing the robustness of the stress-mediated collagen deposition (that is, increasing from 0.05 to 0.075 – cf. Wilson et al., 2013a), the aneurysmal expansion arrested first in the case of greatest elastin loss (d1=0.007) with the most anisotropy. Thus, in AAAs experiencing intermittent expansion, periods of relatively rapid expansion followed by arrest could lead to slower average expansion rates than for lesions with steady but continuous expansion. Clearly, increased understanding of causes of this intermittent expansion and how to capture its effect in a G&R framework need to be explored.
Performing similar simulations using a range of subject-specific starting conditions (e.g., ages 45–69 with pre-stretches of elastin ranging from 1.18–1.34 – see Table 2) demonstrated a consistent anisotropic remodeling as a function of axial extent of elastin loss (Figure 4), though the time for the lesion to develop depended on the initial properties (cf. Wilson et al., 2012). Additionally, a comparison of equivalent amounts of initial elastolysis (i.e., varying d and d1 in Equation 6 while keeping ∫f∞(Z)dZ constant), also resulted in increased anisotropy with wider insults (Figure 6a). That is, for the values considered, decreasing the percent initial loss of elastin at a given location in exchange for a more widely distributed insult, resulted in increased anisotropy once the aneurysm fully formed. Finally, decreasing the ultimate stretch of elastin (see Equation 8) was also evaluated as a method of increasing the axial extent of elastin loss during AAA progression. Lower values led to more rapid damage of elastin in the shoulder region and mildly increased anisotropic remodeling (Figure 6b).
Together, these results suggest that an increased loss of load-bearing elastic fibers in the neck and shoulder regions of developing AAAs, whether by initial elastolysis or ongoing elastic damage, may reduce axial tension throughout the artery and increase the anisotropy via fiber reorientation and changes in collagen turnover (deposition versus degradation) secondary to a decreasing axial:circumferential stress ratio. For this set of simulations, anisotropic remodeling appeared to be most sensitive to changes in the axial extent of initial elastolysis. Clinically, a relative reduction of axial stress may lead not only to anisotropic remodeling but also an increased likelihood of tortuosity of the aorta, which may independently affect rupture risk (Fillinger et al., 2004; Pappu et al., 2008). Generalizing this observation, varying the extent of circumferential damage to elastin may also affect anisotropy; however, a non-axisymmetric implementation of the G&R model will be required to confirm this hypothesis.
Conclusions
Identifying and predicting underlying causes of aneurysmal expansion and rupture remain an active area of research clinically, experimentally, and computationally. Each approach promises to increase our understanding of this complex, evolving pathology. Herein, we highlighted two key findings. First, a re-analysis of biaxial data from mechanical tests on human AAAs suggested a novel and potentially useful means of classifying AAAs based on relative degrees of material stiffness and anisotropy. Interestingly, patients with increased anisotropy were significantly older despite no significant difference in aneurysmal diameter, though the isotropic group possessed the six largest AAAs. While increased age in the anisotropic group may suggest a potential clinical benefit, conclusive evidence requires further investigation. Specifically, future biaxial testing of AAAs should attempt to correlate anisotropy with measured expansion rates and regional heterogeneities in mechanical and histological properties. Second, through the use of an idealized G&R model of AAA progression, we found that anisotropy within an AAA may be influenced by the axial extent of the elastolytic insult that initiated the lesion, as well as ongoing elastic damage in the neck and shoulder region of the lesion, and that this effect was likely mediated by G&R responses to changes in relative axial loading. Future experiments in animal models may be useful to confirm this computational prediction.
Acknowledgments
This work was supported, in part, by AHA Predoctoral Fellowship Award 13PRE14130007, NIH grants R01 HL086418 and R21 HL107768, and by the staff and facilities of the Yale University Faculty of Arts and Sciences High Performance Computing Center.
Footnotes
Conflict of Interest Statement
The authors report no conflicts of interest in regard to this work. The funding sources had no influencing role in the design, implementation, or publication of this study.
Publisher's Disclaimer: This is a PDF file of an unedited manuscript that has been accepted for publication. As a service to our customers we are providing this early version of the manuscript. The manuscript will undergo copyediting, typesetting, and review of the resulting proof before it is published in its final citable form. Please note that during the production process errors may be discovered which could affect the content, and all legal disclaimers that apply to the journal pertain.
References
- Baek S, Rajagopal KR, Humphrey JD. A theoretical model of enlarging intracranial fusiform aneurysms. J Biomech Eng. 2006;128:142–149. doi: 10.1115/1.2132374. [DOI] [PubMed] [Google Scholar]
- Basciano C, Kleinstreuer C, Hyun S, Finol EA. A relation between near-wall particle-hemodynamics and onset of thrombus formation in abdominal aortic aneurysms. Ann Biomed Eng. 2011;39:2010–2026. doi: 10.1007/s10439-011-0285-6. [DOI] [PMC free article] [PubMed] [Google Scholar]
- Eberlová L, Tonar Z, Witter K, Křížková V, Nedorost L, Korabečná M, Tolinger P, Kočová J, Boudová L, Třeška V, Houdek K, Moláček J, Vrzalová J, Pešta M, Topolčan O, Valenta J. Asymptomatic abdominal aortic aneurysms show histological signs of progression: a quantitative histochemical analysis. Pathobiology. 2013;80:11–23. doi: 10.1159/000339304. [DOI] [PubMed] [Google Scholar]
- Ferruzzi J, Collins MJ, Yeh AT, Humphrey JD. Mechanical assessment of elastin integrity in fibrillin-1-deficient carotid arteries: implications for Marfan syndrome. Cardiovasc Res. 2011a;92:287–95. doi: 10.1093/cvr195. [DOI] [PMC free article] [PubMed] [Google Scholar]
- Ferruzzi J, Vorp DA, Humphrey JD. On constitutive descriptors of the biaxial mechanical behaviour of human abdominal aorta and aneurysms. J R Soc Interface. 2011b;8:435–450. doi: 10.1098/rsif.2010.0299. [DOI] [PMC free article] [PubMed] [Google Scholar]
- Fillinger MF, Marra SP, Raghavan ML, Kennedy FE. Prediction of rupture risk in abdominal aortic aneurysm during observation: wall stress versus diameter. J Vasc Surg. 2003;37:724–732. doi: 10.1067/mva.2003.213. [DOI] [PubMed] [Google Scholar]
- Fillinger MF, Racusin J, Baker RK, Cronenwett JL, Teutelink A, Schermerhorn ML, Zwolak RM, Powell RJ, Walsh DB, Rzucidlo EM. Anatomic characteristics of ruptured abdominal aortic aneurysm on conventional CT scans: implications for rupture risk. J Vasc Surg. 2004;39:1243–52. doi: 10.1016/j.jvs.2004.02.025. [DOI] [PubMed] [Google Scholar]
- He CM, Roach MR. The composition and mechanical properties of abdominal aortic aneurysms. J Vasc Surg. 1994;20:6–13. doi: 10.1016/0741-5214(94)90169-4. [DOI] [PubMed] [Google Scholar]
- Holzapfel GA. Determination of material models for arterial walls from uniaxial extension tests and histological structure. J Theor Biol. 2006;238:290–302. doi: 10.1016/j.jtbi.2005.05.006. [DOI] [PubMed] [Google Scholar]
- Kurvers H, Veith FJ, Lipsitz EC, Ohki T, Gargiulo NJ, Cayne NS, Suggs WD, Timaran CH, Kwon GY, Rhee SJ, Santiago C. Discontinuous, staccato growth of abdominal aortic aneurysms. J Am Coll Surg. 2004;199:709–715. doi: 10.1016/j.jamcollsurg.2004.07.031. [DOI] [PubMed] [Google Scholar]
- Lillie MA, Gosline JM. Mechanical properties of elastin along the thoracic aorta in the pig. J Biomech. 2007;40:2214–2221. doi: 10.1016/j.jbiomech.2006.10.025. [DOI] [PubMed] [Google Scholar]
- Martufi G, Gasser TC. Turnover of fibrillar collagen in soft biological tissue with application to the expansion of abdominal aortic aneurysms. J R Soc Interface. 2012;9:3366–77. doi: 10.1098/rsif.2012.0416. [DOI] [PMC free article] [PubMed] [Google Scholar]
- Pappu S, Dardik A, Tagare H, Gusberg RJ. Beyond fusiform and saccular: a novel quantitative tortuosity index may help classify aneurysm shape and predict aneurysm rupture potential. Ann Vasc Surg. 2008;22:88–97. doi: 10.1016/j.avsg.2007.09.004. [DOI] [PubMed] [Google Scholar]
- Sheidaei A, Hunley SC, Zeinali-Davarani S, Raguin LG, Baek S. Simulation of abdominal aortic aneurysm growth with updating hemodynamic loads using a realistic geometry. Med Eng Phys. 2011;33:80–88. doi: 10.1016/j.medengphy.2010.09.012. [DOI] [PubMed] [Google Scholar]
- Tong J, Cohnert T, Regitnig P, Holzapfel GA. Effects of age on the elastic properties of the intraluminal thrombus and the thrombus-covered wall in abdominal aortic aneurysms: biaxial extension behaviour and material modelling. Eur J Vasc Endovasc Surg. 2011;42:207–219. doi: 10.1016/j.ejvs.2011.02.017. [DOI] [PubMed] [Google Scholar]
- Vande Geest JP, Sacks MS, Vorp DA. Age dependency of the biaxial biomechanical behavior of human abdominal aorta. J Biomech Eng. 2004;126:815–822. doi: 10.1115/1.1824121. [DOI] [PubMed] [Google Scholar]
- Vande Geest JP, Sacks MS, Vorp DA. The effects of aneurysm on the biaxial mechanical behavior of human abdominal aorta. J Biomech. 2006;39:1324–1334. doi: 10.1016/j.jbiomech.2005.03.003. [DOI] [PubMed] [Google Scholar]
- Watton PN, Hill NA, Heil M. A mathematical model for the growth of the abdominal aortic aneurysm. Biomech Model Mechanobiol. 2004;3:98–113. doi: 10.1007/s10237-004-0052-9. [DOI] [PubMed] [Google Scholar]
- Wilson JS, Baek S, Humphrey JD. Importance of initial aortic properties on the evolving regional anisotropy, stiffness and wall thickness of human abdominal aortic aneurysms. J R Soc Interface. 2012;9:2047–2058. doi: 10.1098/rsif.2012.0097. [DOI] [PMC free article] [PubMed] [Google Scholar]
- Wilson JS, Baek S, Humphrey JD. Parametric study of effects of collagen turnover on the natural history of abdominal aortic aneurysms. Proceedings of the Royal Society A. 2013a;469:20120556. doi: 10.1098/rspa.2012.0556. [DOI] [PMC free article] [PubMed] [Google Scholar]
- Wilson JS, Virag L, Di Achille P, Karsaj I, Humphrey JD. Biochemomechanics of intraluminal thrombus in abdominal aortic aneurysms. J Biomech Eng. 2013b;135:021011. doi: 10.1115/1.4023437. [DOI] [PMC free article] [PubMed] [Google Scholar]
- Zeinali-Davarani S, Sheidaei A, Baek S. A finite element model of stress-mediated vascular adaptation: application to abdominal aortic aneurysms. Comput Methods Biomech Biomed Engin. 2011;14:803–817. doi: 10.1080/10255842.2010.495344. [DOI] [PubMed] [Google Scholar]
- WISQARS leading causes of death. United States: Office of Statistics and Programming, National Center for Injury Prevention and Control, Centers for Disease Control and Prevention; 1999–2007. [Google Scholar]