


Abstract
Rapacz familial hypercholesterolemic (RFH) swine is a well-established model of human FH, a highly prevalent hereditary disease associated with increased risk of coronary artery disease and calcific aortic valve disease (CAVD). However, while these animals have been used extensively for the study of atherosclerosis, the heart valves from RFH swine have not previously been examined. We report the analysis of valvular interstitial cell gene expression in adult (two year old) and juvenile (three months old) RFH and WT swine by microarray analysis via the Affymetrix Porcine Genome Array (GEO #: GSE53997). Principal component and hierarchical clustering analysis revealed grouping and almost no variability between the RFH juvenile and WT juvenile groups. Additionally, only 21 genes were found differentially expressed between these two experimental groups whereas over 900 genes were differentially expressed when comparing either RFH or WT juvenile swine to RFH adults.
Keywords: Valve disease, Swine, Familial hypercholesterolemia, Microarray
| Specifications | |
|---|---|
| Organism/cell line/tissue | Sus scrofa, heart valve, valvular interstitial cells |
| Sex | Female |
| Sequencer or array type | Affymetrix Porcine Genome Array |
| Data format | Raw data: CEL files |
| Experimental factors | Genotype — familial hypercholesterolemic (FH) mutant vs. wild type (FH −/−), Age — adult (2 years old) vs. juvenile (3 months old) |
| Experimental features | This study sought to identify differentially expressed genes between juvenile wild type and juvenile and adult Rapacz familial hypercholesterolemic swine to identify genes and biological pathways associated with the initiation of valve disease. |
| Consent | IACUC approval was obtained for animal care and procedures |
| Sample source location | Madison, WI, USA |
Direct link to deposited data
http://www.ncbi.nlm.nih.gov/geo/query/acc.cgi?acc=GSE53997.
Experimental design, materials and methods
Swine model and tissue procurement
Four adult (two years old) Rapacz Familial Hypercholesterolemic (RFH), three juvenile (three months old) RFH and three juvenile wild type RFH−/− (WT) swine participated in this study (Table 1). This work was performed under the guidelines of the UW–Madison Institutional Animal Care and Use Committee. Aortic valve leaflets were isolated within 1 h post-mortem and immediately placed in RNA later (Sigma, St. Louis, MO) at 4 °C for 24 h, followed by freezing and long-term storage at − 20 °C.
Table 1.
Summary of analyzed swine population.
| Variable | WT juvenile | RFH juvenile | RFH adult |
|---|---|---|---|
| Number of animals | 3 | 3 | 4 |
| Age (years) | 0.29 (0.02) | 0.23 (0.01) | 2.46 (0.05) |
| Weight (kg) | 9.4 (1.4) | 9.3 (1.3) | 150.6 (25.6) |
| Cholesterol (mg/dL) | 119.0 (12.36) | 340.7 (59.0) | 408.3 (20.6) |
RNA extraction and microarray hybridization
Prior to RNA extraction, aortic valve leaflets were denuded of valvular endothelial cells and homogenized using stainless steel beads in a TissueLyser (Qiagen, Valencia, CA). Total valvular interstitial cell (VIC) RNA was isolated following the RNeasy (Qiagen) fibrous tissue spin-column kit protocol. RNA quality and integrity were assessed with a Nanodrop (Thermo Fisher Scientific, Waltham, MA) and BioAnalyzer (Agilent, Santa Clara, CA). VIC RNA samples were analyzed with Affymetrix GeneChip Porcine Genome Arrays (Affymetrix, Santa Clara, CA), which contain 23,937 probesets that interrogate 23,256 transcripts representing 20,201 genes. The University of Wisconsin–Madison Gene Expression Center (Madison, WI) processed the arrays following the manufacturer's instructions. GeneChips were post-processed on an AFX Fluidics 450 Station and scanned on a GC3000 G7 scanner. Data were extracted and processed using the Affymetrix Command Console v3.1.1.1229.
Data processing and normalization
Microarray data were analyzed using the open source statistical language R v2.15.2 and the libraries in the Bioconductor Project [1]. The raw expression values from the *. CEL files were background-corrected and normalized using the Robust Multi-array Analysis method and filtered based on the standard deviation divided by the mean (CV) [2]. The probe sets on the porcine arrays are minimally annotated by Affymetrix; thus, annotations for the gene list were supplemented and prepared based on the chip annotations provided by Tsai et al. [3].
Results
Principal component and clustering analysis
Principal component analysis (PCA) was conducted using the prcomp function in R to evaluate the gene expression pattern of all experimental groups relative to each other (Fig. 1). The samples within both the RFH juvenile and WT juvenile groups clustered closely together across both the first and second PC. In contrast, there appeared to be higher variance along both components in the RFH adult samples. Additionally, inspection of the sample distribution along the first principal component revealed distinct grouping of the RFH juvenile and WT juvenile groups compared to RFH adult swine. Clustering analysis was performed to further explore the variability within the dataset through the genefilter package in BioConductor. Hierarchical clustering of all samples was implemented based on the top 30 genes with the highest standard deviation across chips (Fig. 2). As suspected based on our PCA analysis, the WT juvenile and RFH juvenile samples clustered together and exhibited gene expression patterns that were similar to each other but distinct from those observed in the RFH adult samples.
Fig. 1.
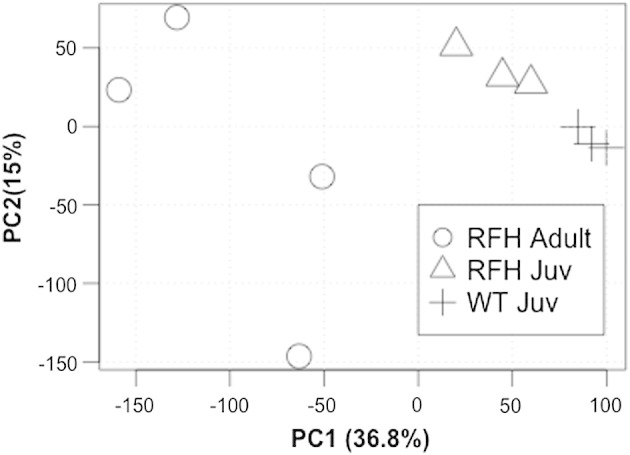
Principal component plot of normalized expression values. The numbers in parentheses indicate the percentage of the variation captured by each principal component.
Fig. 2.
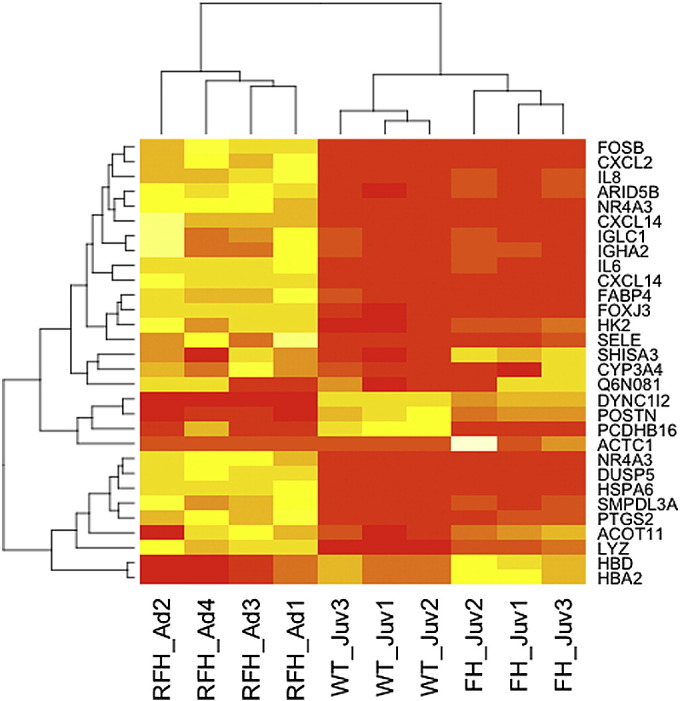
Hierarchical clustering of RFH and WT normalized microarray data based on the 30 genes with the highest variability across chips.
Variability analysis
PCA and clustering analysis revealed some variability between samples within the experimental groups, particularly within the RFH Adult group. To better evaluate the biases that might have been introduced into the analysis, an analysis of the coefficient of variability (CV, also known as relative coefficient) was conducted. For each probeset, the CV was calculated based on the standard deviation divided by the mean either within each experimental group or across all samples. A histogram was then generated to visualize the distribution of CV values for each of the three experimental groups (Fig. 3), where a lower CV indicates less variability. As is evident for all experimental groups, the CV values are below 0.1 for most probesets. As suspected based on the PCA results, the RFH Adult samples have a higher proportion of probesets with CV values higher than 0.1 (Fig. 3C) than the WT Juvenile (3A) or RFH Juvenile (3B) samples. However, the probesets with higher variability represent a small portion of the transcripts on the array, which led to the conclusion that high variability within the experimental group was not a major concern for this data set. Additionally, when analyzing the CV distribution across all arrays, it is clear that variability is low (< 0.1) for most probesets (Fig. 3D).
Fig. 3.

Histogram of the coefficients of variability for each probeset within (A) WT juvenile swine, (B) RFH juvenile swine, (C) RFH adult swine, and (D) all swine.
Differential gene expression
For each probeset, the mean expression in the RFH adult or RFH juvenile samples was compared to that of the WT juvenile samples. Likewise, the same comparison was executed between the RFH adult and juvenile datasets. The Empirical Bayes t-test statistic from the limma package within BioConductor was used to determine the differential gene expression between experimental groups and generate significant gene lists [4] (Table 2). The significance threshold was set to a false discovery rate of 0.05 and a minimum fold change of 2. This analysis led to the identification of 1459 differentially expressed transcripts for the RFH adult samples compared to WT juvenile swine and 916 transcripts in the RFH adult to RFH juvenile comparison. In contrast, only 21 transcripts were significantly differentially expressed in the comparison between RFH juvenile and WT juvenile animals (Table 3).
Table 2.
Summary of differential expression analysis. Cut off: 2-fold, p < 0.05.
| Comparison | Number of differentially expressed transcripts |
|---|---|
| RFH Juv vs. WT Juv | 21 |
| RFH Juv vs. RFH Adult | 916 |
| WT Juv vs. RFH Adult | 1459 |
Table 3.
Differentially expressed genes in RFH juvenile versus WT juvenile valvular interstitial cells.
| Gene symbol | Gene name | Fold change | P value |
|---|---|---|---|
| C8orf37 | 6.06 | 0.0082 | |
| CR2 | Complement receptor type 2 precursor | 5.66 | 0.049 |
| TXNL4B | Thioredoxin-like protein 4B (Dim1-like protein) | 4.29 | 0.022 |
| BTBD1 | BTB/POZ domain containing protein 1 | 3.25 | 0.011 |
| C7orf58 | 2.46 | 0.027 | |
| DDX19A | DDX19-like protein; RNA helicase | 2.30 | 0.0025 |
| AKAP11 | A-kinase anchor protein 11 | 2.30 | 0.022 |
| DIDO1 | Death associated transcription factor 1 | 2.14 | 0.014 |
| PTPRK | Receptor-type protein-tyrosine phosphatase kappa precursor | 0.47 | 0.0025 |
| PGA5 | Pepsin A precursor | 0.47 | 0.011 |
| SDK1 | Sidekick homolog 1 | 0.44 | 0.014 |
| C6orf98 | Nesprin 1 (nuclear envelope spectrin repeat protein 1) | 0.41 | 0.049 |
| PCDHB16 | Protocadherin beta 16 precursor | 0.38 | 0.037 |
| SELL | L-selectin precursor (lymph node homing receptor) | 0.33 | 0.017 |
| PEA15 | Astrocytic phosphoprotein PEA-15 | 0.29 | 0.028 |
| OAS1 | 2-5-Oligoadenylate synthetase 1 | 0.16 | 0.0082 |
| TIMD4 | T-cell immunoglobulin and mucin domain containing 4 | 0.25 | 0.049 |
| CLEC3B | Tetranectin precursor | 0.25 | 0.049 |
| PCNP | PEST-containing nuclear protein | 0.25 | 0.049 |
| LOX | Protein-lysine 6-oxidase precursor | 0.23 | 0.049 |
| PLAGL1 | Zinc finger protein PLAGL1 | 0.05 | 0.017 |
The list of differentially expressed transcripts between RFH adult and RFH juvenile swine was then submitted to Ingenuity® iReport™ (Ingenuity Systems, Redwood City, CA). Using the content in the Ingenuity Knowledge Base, iReport performed an annotation enrichment analysis to map groups of genes to specific diseases that were overrepresented in the differentially expressed genes. Of the 916 transcripts submitted to ingenuity, 106 mapped to vascular disease, 69 to atherosclerosis and/or arteriosclerosis, and 20 to ventricular hypertrophy, amongst other cardiovascular diseases. In contrast, examination of the list of 21 differentially expressed transcripts in the RFH juvenile vs. WT juvenile comparison revealed only two genes (SELL and LOX) associated with any type of vascular disease.
Discussion
This study analyzed the gene expression patterns in VICs isolated from RFH and WT swine aortic valves. Our analysis revealed few differences in gene expression between RFH juvenile and WT juvenile samples, which clustered together after both PC and hierarchical clustering analysis. In contrast, over 900 transcripts were found differentially expressed in either of these groups when compared to RFH adults. Thus, further analysis of the RFH swine model via microarray will concentrate on the RFH adult to RFH juvenile comparison to specifically focus on the progression of valve disease as the animals age.
Acknowledgments
This work was supported by the National Heart, Lung, and Blood Institute at the National Institutes of Health (R01 HL093281 to K.S.M.).
References
- 1.Gentleman R.C., Carey V.J., Bates D.M., Bolstad B., Dettling M., Dudoit S., Ellis B., Gautier L., Ge Y., Gentry J., Hornik K., Hothorn T., Huber W., Iacus S., Irizarry R., Leisch F., Li C., Maechler M., Rossini A.J., Sawitzki G., Smith C., Smyth G., Tierney L., Yang J.Y., Zhang J. Bioconductor: open software development for computational biology and bioinformatics. Genome Biol. 2004;5:R80. doi: 10.1186/gb-2004-5-10-r80. [DOI] [PMC free article] [PubMed] [Google Scholar]
- 2.Shakya K., Ruskin H.J., Kerr G., Crane M., Becker J. Comparison of microarray preprocessing methods. Adv. Exp. Med. Biol. 2010;680:139–147. doi: 10.1007/978-1-4419-5913-3_16. [DOI] [PubMed] [Google Scholar]
- 3.Tsai S., Cassady J.P., Freking B.A., Nonneman D.J., Rohrer G.A., Piedrahita J.A. Annotation of the affymetrix porcine genome microarray. Anim. Genet. 2006;37:423–424. doi: 10.1111/j.1365-2052.2006.01460.x. [DOI] [PubMed] [Google Scholar]
- 4.Smyth G.K. Linear models and empirical bayes methods for assessing differential expression in microarray experiments. Stat. Appl. Genet. Mol. Biol. 2004;3 doi: 10.2202/1544-6115.1027. (Article3Article3) [DOI] [PubMed] [Google Scholar]