

Abstract
Positron emission tomography (PET) measures of cancer metabolism and cellular proliferation are increasingly being studied as markers of cancer response to treatment, with the goal of using them as predictors of patient therapeutic outcomes – i.e., as surrogate outcome measures. The primary PET radiotracers thus far used for monitoring response of cancer to treatment are 18F-fluorodeoxyglucose (FDG) for studying abnormal energy metabolism and 18F-fluorothymidine (FLT) for examining cell proliferation. Both FDG and FLT PET quantitation of cancer response to treatment have been found to correlate with patient outcomes, mostly in single-center studies. The aim of this review is to summarize the impact of commonly selected PET quantitation methods on the ability of PET measures to quantitate cancer response to treatment. An understanding of the biochemistry and kinetics of FDG and FLT uptake and knowledge of the expected tracer uptake by cancerous processes relative to background uptake are required to select appropriate PET quantitation methods for trials testing for correlations between PET measures and patient outcome. PET measures may eventually serve as predictive biomarkers capable of guiding individualized treatment and improving patient outcomes and quality of life by early identification of ineffective therapies. PET can also potentially identify patients who would be good candidates for molecularly targeted drugs and monitor response to these personalized therapies.
Keywords: PET, response to therapy, quantitative imaging, monitoring treatment
Introduction
Positron emission tomography (PET) quantitation of cancer response to therapy is the focus of this review. Functional and molecular imaging modalities such as PET are increasingly being studied as biomarkers for cancer response to treatment with the goal of providing endpoints for clinical trials that quantitate response to treatment and, importantly, might allow early discontinuation of ineffective and expensive treatments with potentially harmful side effects. If selective PET radiotracers become accepted as biomarkers of patient outcome for clinical trials, then these same biomarkers could also prove useful for image-guided therapy, where early response assessment could be used to guide selection of the most effective therapy and, in the process, reduce harmful side effects and expense by halting cancer treatment that is unlikely to be efficacious. The concentrations of radioactive PET tracers are measured on either PET-only scanners or PET computed tomography (PET/CT) hybrid scanners or PET magnetic resonance (PET/MR) hybrid scanners. The aims of this review are to provide suggestions for selecting the method of measuring PET tracer uptake and to define the role of PET radiotracers such as 18F-fluorodeoxyglucose (FDG) and 18F-fluorothymidine (FLT) in monitoring cancer response to treatment.
Biochemistry and kinetics of uptake of the PET tracers FDG and FLT
An understanding of the biochemistry and kinetics of individual PET tracers is required in order to be able to select appropriate methods for quantitation of PET tracer uptake. PET imaging of the uptake of 18F-radiolabeled glucose, FDG, is an established method for cancer diagnosis, staging and monitoring of response to treatment. FDG is an effective metabolic radiotracer for targeting glycolysis because FDG is trapped inside cells after undergoing the same phosphorylation by the enzyme hexokinase that is the first, practically irreversible, step in glycolysis. Selective concentration of FDG often occurs in cancer cells due to the Warburg effect, a term used to refer to the observation that cancer cells often have an altered energy metabolism that favors less efficient anaerobic glycolysis over the more efficient aerobic respiration used by normal cells [1]. A second PET tracer increasingly being used in clinical trials is FLT, whose target is cellular proliferation, which is another key biological process that is often upregulated in cancer cells [2]. FLT is considered a measure of proliferation because FLT is trapped in cells after undergoing phosphorylation by the enzyme thymidine kinase-1 in the effectively first irreversible metabolic step in the salvage pathway for incorporating exogenous thymidine into DNA [3-5]. The interpretation of FLT uptake as a measure of cellular proliferation is made complex by its reliance on the thymidine salvage pathway (and not the competing de novo pathway of thymidine synthesis into DNA [2, 4]), as recently confirmed by animal studies [5]. Nevertheless, within a given patient and tumor any changes in FLT uptake appear to reflect changes in tumor proliferation [2, 6-9]. Both FDG and FLT have been used in new cancer drug pharmacokinetic and efficacy evaluation, with FDG used as a biomarker for altered energy metabolism and FLT as a biomarker for cellular proliferation.
Compartmental models describing the kinetics of uptake of FDG [10] and FLT [4] have been well described elsewhere. A generic two-compartment model with a driving blood input function is shown in Figure 1. In the two-compartment FDG model, the first compartment represents the changing concentration of FDG without a phosphate group within a cell and the second compartment is defined as the dynamic concentration of FDG with an attached phosphate group that prevents FDG from leaving the cell. Parameters that can be estimated from this two-compartment model include the rate of transport of PET tracer from blood into a cell, K1, and the rate of the reversible return of FDG without a phosphate group from the cell to the blood, k2, and the rate of phosphorylation of FDG that leaves FDG trapped within the cell, k3, and the limited dephosphorylation rate of phosphorylated FDG within a cell, k4, and, finally, the blood volume fraction that helps to quantitate the contribution of activity from FDG within capillaries to tissue time-activity curves. The K1 rate of transport of PET tracer into a cell is capitalized while the other internal compartmental rates (k2, k3, and k4) are indicated in lower case to highlight that K1 transport is considered a macroparameter that can often be estimated independently of the other internal compartmental rates. The FLT compartmental model is similar to the FDG model with an important difference, namely presence of an additional compartment within blood that represents the changing concentration of the FLT metabolite, FLT-glucuronide, which is the only labeled FLT metabolite observed in human plasma [4]. FLT is glucoronidated primarily in the liver and its metabolite remains in the blood until clearance through the kidneys [4]. In practice, kinetic analysis of FLT uptake can account for the additional blood compartment by measuring the increasing concentration of FLT metabolites in the blood by chromatographic analysis and using this information to correct the blood time-activity curve to only include the activity concentration of the parent FLT [4]. Kinetic analyses of the compartmental models of FDG and FLT cellular uptake provide an opportunity to quantitate FDG and FLT uptake using a method that is relatively insensitive to the variable background activity present during the study [11], which can confound static measures of PET tracer uptake as discussed in more detail in the following section.
Fig. 1.
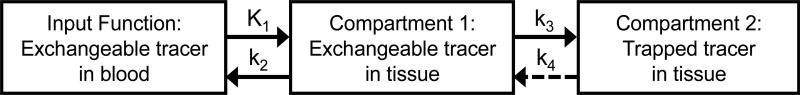
Two-compartment model with a driving blood input function with rates of transport of tracer into the cells (K1) and out of the cells (k2) and with rates of tracer conversion into a form that is unable to leave cells (k3), and conversion from the trapped form back into an exchangeable variant of the tracer (k4).
Qualitative PET assessment of cancer response to treatment
Lymphoma is an example of a cancer whose response to treatment is typically qualitatively assessed using PET images of FDG uptake as shown in Figure 2. In the setting of a highly responsive tumor such as lymphoma, post-therapy qualitative assessment of tracer uptake provides a highly predictive method of assessing response that may be adequate for both clinical trials and clinical practice [12]. Quantitative PET assessment can be more important for less responsive cancers where classifying partial metabolic response (versus stable disease or progression) is informative, or where a continuous measure of response provides more power to predict downstream outcomes such as survival.
Fig. 2.

Baseline FDG PET scans of two non-Hodgkin lymphoma patients (on the left) and subsequent post-treatment FDG scans (on the right) with tumor locations indicated by arrows, showing a complete metabolic response in the top patient and a partial metabolic response in the bottom patient.
Methods for quantitating uptake of PET tracer
In clinical practice, FDG PET scans are normally interpreted visually, with quantitative maximum standard uptake values (SUV) [13, 14] used after detection, as needed, for lesion characterization [15]. This approach is illustrated in Figure 3 in which before- and after-treatment images demonstrate response to therapy with moderate reduction in both the extent and FDG avidity of osseous breast cancer metastases. Near confluent involvement of the right ilium (thick horizontal arrows) before treatment, with a max SUV of 14 g/mL, improved to heterogeneous involvement after therapy, i.e. to a max SUV of 7 g/mL, while focal increased FDG avidity in the left proximal humerus (thin vertical arrows), with a max SUV of 15 g/mL, decreased to a max SUV of 4 g/mL after therapy. A moderate decrease in FDG avidity in visualized spine and ribs can also be noted. Decreases of the two highest max SUVs following therapy facilitate characterization of metastases as responding to therapy. Intuitively, quantitative evaluation might seem superior to visual assessment in the categorization of neoadjuvant therapy response. Unfortunately, almost no studies have compared the accuracy of visual assessment and semi-quantitative methods for response prediction. One such study in patients with lymphoma found that SUV measurements only mildly improved the predictive accuracy of PET over visual assessment, from 65% to 76% [16]. The European Organization for Research and Treatment of Cancer (EORTC) PET study was the first to classify specific quantitative changes in FDG uptake into four response categories (progressive or stable metabolic disease or partial or complete metabolic response) that could be compared to traditional clinical trial end points such as overall survival. The PET response criteria in solid tumors (PERCIST) subsequently provided more comprehensive guidelines for using changes in quantitation of FDG uptake to categorize solid tumor response to treatment [17] and are currently the most widely accepted PET guidelines for quantitating response.
Fig. 3.

Coronal plane FDG PET and fusion PET/CT images in a patient at baseline (a) and after 12 weeks of fulvestrant therapy (b) showed max SUVs decreasing from 14 to 7 g/mL in the right ilium (thick horizontal arrows) and from 15 to 4 g/mL in the left proximal humerus (thin vertical arrows).
Static quantitative techniques
Static quantitative measures of response, such as SUV, are important for consistency in multicenter trials evaluating FDG and new radiotracers, especially since the serial images are often sent to a single processing center for additional analysis. Quantitative measures of static PET uptake are often reported as a target-to-background ratio of the activity in the region of interest to background activity in corresponding normal tissue, in order to provide a background-normalized quantity that facilitates comparisons with similar measurements made in different patients or on different days in the same patient. In cancer patients, however, it is not always possible to identify background regions in which PET tracer uptake is known to be normal and unchanged between serial scans of the same patient. The solution to this potential difficulty in identifying an appropriate background region is the SUV, where the activity concentration in the cancer is normalized by the amount of tracer injected in the patient and some measure of the patient's body habitus. SUVs are calculated by the dividing the PET activity concentration expressed in units of activity per unit volume by the ratio of the activity of injected PET tracer to some measure of body habitus, such as weight, lean body mass [18], or body surface area [19]. For example if you measure the weight-based SUV inside a region that uptakes five times more PET tracer than the rest of the available 70-liter volume for PET tracer, the weight-based SUV will be 5 g/mL and independent of the amount of injected tracer while a simple activity concentration measure of the same region will be either 13.2 kBq/mL or 26.5 kBq/mL, depending on whether the activity of the injected PET tracer is 185 or 370 MBq. The resulting SUVs are expressed in units of g/mL when using patient weight or lean body mass or in units of cm2/mL when using body surface area to describe the patient's body habitus. If SUV measures appear to be an order of magnitude too high or low when viewing patient images on an unfamiliar image workstation, it can be helpful to check the SUV units to ensure that the workstation is displaying SUV using the desired measure of body habitus. Radiologists often prefer SUVs to simple activity concentrations since SUVs quantitate differences in relative target-to-background uptake of PET tracer between patients while minimizing the quantitative impacts of differences in patient size and amount of injected tracer, which may be helpful in identifying disease.
Dynamic quantitative techniques
Quantitation of radiotracer uptake from kinetic analysis of dynamic PET images takes advantage of additional information provided by changing PET radiotracer concentrations in both the tissue and the blood supply of radiotracer [20]. Dynamic PET imaging can provide more sensitive measurement of FDG tracer uptake because quantitation from kinetic analyses of FDG images is insensitive to variable background of FDG uptake in surrounding normal tissue and blood supply [11, 21, 22]. PET data can be categorized most accurately with kinetic analysis of dynamic PET images [11], and this should be performed first for new radiotracers [10, 23]. Dynamic PET data can be analyzed graphically [24] or using nonlinear techniques such as compartmental analysis or spectral methods [20] to estimate the net uptake of PET tracer, called flux or Ki. There are many comparisons of the results of quantitation from static images versus dynamic PET images available in the literature [11, 25-27]. The disadvantages of the graphical (Patlak) method [24] are its assumption that no bound radiotracer is released during the imaging session and its inability to estimate the reversible transport of radiotracer into the cell. The advantage of the graphical method is that calculation involves application of a simple linear fit that requires no special software, unlike full kinetic analyses that use non-linear optimization methods, which require more sophisticated software and more highly trained operators. As well as providing uptake measures that are independent of background signal, nonlinear kinetic analyses have the additional benefit of providing estimates of the rate of radiotracer delivery (K1), which were found to be the only independent predictor of disease-free survival and overall survival in multivariate models of response of locally advanced breast cancer to chemotherapy in 75 patients [22]. Table 1 provides a comparison of methods for quantitating cancer uptake of PET tracers like FDG and FLT.
Table 1.
Comparison of methods for quantitating PET tracer uptake
| Method | Required input | Measures (units) | Advantages | Disadvantages |
|---|---|---|---|---|
| Nonlinear regression (compartmental analysis) | Blood clearance curve & tissue uptake curve (injection to ~60 min) | Tracer flux, Ki, (mL/min/cm3) Transport, K1, (mL/min/cm3) |
Uptake independent of background; Estimates tracer delivery to lesion |
Dynamic 60 min PET scan; Sophisticated analysis software |
| Linear regression (graphical analysis) | Blood clearance curve (injection to ~60 min) & tissue uptake curve (~20 to 60 min) | Tracer flux, Ki, (mL/min/cm3) | Uptake independent of background; Graphical approach calculates uptake |
Dynamic 60 min PET scan; Assumes tracer binds irreversibly |
| Target-to-background | Target & background max or mean activity (5–10 min period) | Target-to-background ratio (unitless) | Less background dependent; Algebraic estimate |
Can be difficult to identify normal background area |
| Standard uptake value | Max or mean activity concentration (5–10 min period), injected dose activity, body habitus measure | SUV with weight, lean body mass, or body surface area (g/mL or cm2/mL) | Algebraic estimate | More background dependent (issue when uptake is low relative to background) |
| Activity concentration | Max or mean activity concentration (5–10 min period) | Activity concentration (kBq/mL) | One measure | Most background dependent & hard to compare values |
Attenuation correction of PET images is critical for quantitative PET measurement with this correction usually having the largest impact on quantitative values. The PET scanner radiation source for attenuation correction can impact on PET quantitation. PET-only scanners using PET sources for attenuation correction are the gold standard since a PET attenuation source radiation has the same attenuation properties as the PET tracer radiation. PET/CT scanners use X-ray sources for attenuation correction and X-rays are the next most widely accepted source for attenuation correction. Quantitative measures from PET images using magnetic resonance imaging (MRI) for attenuation correction are not yet widely accepted although ongoing research is seeking both to improve the accuracy of activity concentration measurements from PET/MR scanners and to evaluate any measurement biases between PET/CT and PET/MR scanners.
PET tracer test-retest reproducibility
Image quantitation is prone to test-retest variability. Quantitative PET measurements are affected by attenuation, scattered and random coincidences, and dead-time correction algorithms and user-defined factors, including image acquisition settings such as duration of PET acquisition, thickness of PET slice, acquisition mode (3-dimensional versus 2-dimensional with use of lead septa between PET detectors), reconstruction algorithm, and other PET instrumentation considerations [28]. Other factors that can impact on PET quantitation include the algorithm used to define the tumor boundaries [29], the time interval between injection and scanning [30], as well as metabolism and plasma clearance of the radiotracer [23]. Bone marrow uptake due to stimulating drugs can also lower SUVs [31], although in some cases the additional uptake of FDG by bone marrow between serial FDG SUV measurements does not impact on the ability of SUV changes to predict response of breast cancer to chemotherapy [21].
To quantitate instrumental uncertainty, multicenter test-retest studies using nine-month, half-life 68Ge-germanium epoxy phantoms have found that the variability of single PET measures can range from an ideal variability of 4% [32] to a variability of 8-23% with central analysis of multicenter results, or as great as 43% without central analysis of local multicenter results [33]. There is understandably more error in test-retest of quantitation of FDG uptake in humans due to sources of variability related to biological factors and variance in patient preparation and imaging protocol components [15]. Reported variability of FDG SUVs in patient test-retest studies ranged from the ideal of 10% [25, 29, 34-36] to 46% [37]. The largest SUV repeatability study of 62 patients with gastrointestinal malignancies observed an intrasubject coefficient of variation decrease from 16% from local site reported SUVs to 11% after applying centralized quality assurance and analysis [38]. A recent meta-analysis looking at test-retest reproducibility of SUVmax and SUVmean found that SUVmean had mildly better repeatability than SUVmax with better reproducibility in larger lesions [39]. However a recent study comparing SUVmax versus SUVmean, SUVpeak (SUVmean from a volume of 1 cm3 in a tumor's region of highest average radiotracer concentration), and SUVtotal (sum of all SUV values from every pixel in a tumor segmented by an experienced nuclear medicine radiologist) found that different SUV definitions yielded 20% variation of values for individual tumor response and variation of up to 90% for a single SUV measure [40]. Therefore, appropriate selection of the method used to quantitate radiotracer uptake for the SUV calculation is very important.
FDG and FLT measures correlate with cancer patient outcomes
Quantitation of FDG and FLT uptake to measure cancer response to therapy is an active area of research and the last several years have seen the publication of results from numerous single-center prospective trials. In 2010, the Canadian Agency for Drugs and Technologies in Health (CADTH) did a systematic review of clinical effectiveness and found support for using FDG PET to monitor response to treatment in metastatic breast cancer and lymphoma [41]. Results from studies performed in a variety of malignancies including breast [22, 42], head and neck [6, 7, 43], pancreatic [44], lung [8, 45, 46], metastatic colorectal [9], and rectal cancer [47-50] demonstrate that quantitative PET is a powerful tool for predicting progression and/or overall survival. Standardization of the timing of PET scans and of quantitation methods [15, 17, 51, 52] for different cancer subtypes and treatments would facilitate multicenter trials to determine the sensitivity and specificity of FDG and FLT PET measures to detect and monitor treatment response in different cancers. Multicenter prospective randomized trials are needed to provide high-quality evidence for or against use of PET in both the diagnostic work-up and the monitoring of response to treatment.
Limitations in PET quantitation
Differential PET measurement error and bias for patient studies at local sites participating in multicenter trials is difficult to measure or predict due to potential longitudinal changes in measurement bias due to PET scanner instrumentation [32, 53] and longitudinal biological changes within patients that are not related to the cancer or the treatment. Preliminary guidelines for designing multicenter clinical trials that use PET measures as end points have been published to enable trial design to account for differences in PET quantitation methods and measurement error at different centers [11, 54].
The partial volume effect refers both to image blurring due to scanner spatial resolution limitations (detector design and reconstruction algorithm) and to inadequate expression of tumor heterogeneity due to multiple signal intensities averaged over the examined volume [23, 55]. Correction for partial volume effect and normalization by blood glucose yielded the highest diagnostic accuracy in differentiating between benign and malignant tissue in small lung nodules [56] and breast lesions [57]. Additionally, partial volume correction (PVC) can increase the correlation between the Ki-67 score, a marker of proliferation, and FDG uptake [58]. In some cases, the difference after using PVC has been shown to be sufficient to change the EORTC classification of metabolic response [59]. Research supporting the use of PVC has led to the development of sophisticated algorithms, some tailored for oncologic applications [60].
There is some evidence that PVC does not lead to more accurate prediction of tumor response. A recent study examining baseline SUV in patients with esophageal cancer found that PVC did not improve the prediction of therapy response or the prognostic value of PET [61], although it should be noted that the tumors included in this study were larger (40 ± 30 cm3), and partial volume effects due to spatial resolution limitations would have a lower impact on PET measurement error in tumors of this size. SUV normalization and PVC did not influence the predictive value of PET imaging in an additional large study of esophageal cancer patients [62]. One recent study compared the performance of eight metabolic indices for the early assessment of tumor response in patients with metastatic colorectal cancer treated with chemotherapy. The metabolic indices included four SUVs without PVC, two SUVs with PVC, metabolic volume and total lesion glycolysis measurements. The SUVs without PVC accurately predicted the tumor response. Neither the use of SUVs with PVC nor measuring total lesion glycolysis improved the assessment of tumor response compared to SUVs without PVC [63]. One reason why PVC may not always be helpful is that SUV without PVC correlates with both metabolic activity and metabolically active tumor volume. Instead, SUV with PVC correlates only with metabolic activity without benefiting from the potentially informative effects of tumor volume change in response to treatment. As a result, some investigators have suggested that it would be opportune to consider both SUV with PVC and metabolic volume in lesion assessment, either separately or in combination (e.g. SUV with PVC × volume = PVC total lesion glycolysis) [59].
Tumor heterogeneity refers to molecular characteristics, such as variation in receptor expression and proliferation rate, as well as macroscopic characteristics such as central necrosis and perfusion. The partial volume effect may be worsened by tumor heterogeneity, which can also impact on compartmental models. Models that assume a homogeneous tumor region of interest may not be ideal for some tumor types.
Movement is another confounding factor that can interfere with PET/CT co-registration and quantitation [64,65] and needs to be addressed with a data analysis technique such as one that includes information from respiratory gating. This is an active area of PET instrumentation research that is beyond the scope of this review.
Future directions in quantitative PET imaging may include textural features such as SUV combined with multiple parameters such as fractal dimension and tumor volume, as well as multiscale computational modeling at the sub-cellular and cellular level [23].
Summary
More studies showing that PET measures of cancer response to treatment correlate significantly with patient outcomes are required to convince oncologists and insurers to accept PET measures of response as biomarkers that can serve as clinical trial end points and direct the treatment of individual patients. In order to ensure maximum power to measure significant changes in cancer response to treatment, we encourage the use of more sensitive methods of quantitating PET tracer uptake, such as kinetic analyses of dynamic PET images, when first using a novel PET tracer or when studying a new disease or patient cohort with existing tracers such as FDG or FLT. We support the subsequent use of simplified quantitation methods such as SUVs in later phase studies testing correlations between PET measures of cancer response and patient outcome, as long as the ratio between tracer uptake by the studied cancerous process and background uptake is high and there is only low production of PET-labeled metabolites. If the PET tracer is expected to have a moderate target-to-background ratio or substantial amounts of PET-labeled metabolites, then one should consider quantitating PET tracer uptake using kinetic analysis of dynamic PET images, or at least ensure that any clinical trial design compensates for the lower sensitivity of using a static PET measure such as SUV. If PET measures become accepted as prognostic biomarkers, then clinical trials and image-guided therapy for individuals can use PET measures to potentially improve patient survival and quality of life by ending ineffective therapy early in the course of treatment.
Acknowledgments
We thank Amy Clark and Camilla Lynch at the University of Pennsylvania for their help with Figure 3. This work was supported by grants P01CA016520 and R01CA124573 from the National Institutes of Health and by grant SAC140060 from the Susan B Komen Foundation.
Footnotes
Conflict of interest
Robert Doot, Elizabeth McDonald, and David Mankoff have no conflicts of interest.
Animal and human studies
All procedures followed were in accordance with the ethical standards of the responsible committee on human experimentation (institutional and national) and with the Helsinki Declaration of 1975, as revised in 2008. Informed consent was obtained from all patients for being included in the study.
References
- 1.Warburg O. The metabolism of tumors. Constable Press; London: 1930. [Google Scholar]
- 2.Mankoff DA, Shields AF, Krohn KA. PET imaging of cellular proliferation. Radiol Clin North Am. 2005;43(1):153–167. doi: 10.1016/j.rcl.2004.09.005. [DOI] [PubMed] [Google Scholar]
- 3.Vesselle H, Grierson J, Muzi M, Pugsley JM, Schmidt RA, Rabinowitz P, Peterson LM, Vallieres E, Wood DE. In vivo validation of 3′deoxy-3′-[(18)F]fluorothymidine ([(18)F]FLT) as a proliferation imaging tracer in humans: correlation of [(18)F]FLT uptake by positron emission tomography with Ki-67 immunohistochemistry and flow cytometry in human lung tumors. Clin Cancer Res. 2002;8(11):3315–3323. [PubMed] [Google Scholar]
- 4.Muzi M, Mankoff DA, Grierson JR, Wells JM, Vesselle H, Krohn KA. Kinetic modeling of 3′-deoxy-3′-fluorothymidine in somatic tumors: mathematical studies. J Nucl Med. 2005;46(2):371–380. [PubMed] [Google Scholar]
- 5.McKinley ET, Ayers GD, Smith RA, Saleh SA, Zhao P, Washington MK, Coffey RJ, Manning HC. Limits of [18F]-FLT PET as a biomarker of proliferation in oncology. PloS One. 2013;8(3):e58938. doi: 10.1371/journal.pone.0058938. [DOI] [PMC free article] [PubMed] [Google Scholar]
- 6.Hoeben BA, Troost EG, Span PN, van Herpen CM, Bussink J, Oyen WJ, Kaanders JH. 18F-FLT PET during radiotherapy or chemoradiotherapy in head and neck squamous cell carcinoma is an early predictor of outcome. J Nucl Med. 2013;54(4):532–540. doi: 10.2967/jnumed.112.105999. [DOI] [PubMed] [Google Scholar]
- 7.Hoshikawa H, Mori T, Kishino T, Yamamoto Y, Inamoto R, Akiyama K, Mori N, Nishiyama Y. Changes in (18)F-fluorothymidine and (18)F-fluorodeoxyglucose positron emission tomography imaging in patients with head and neck cancer treated with chemoradiotherapy. Ann Nucl Med. 2013;27(4):363–370. doi: 10.1007/s12149-013-0694-8. [DOI] [PubMed] [Google Scholar]
- 8.Kahraman D, Holstein A, Scheffler M, Zander T, Nogova L, Lammertsma AA, Boellaard R, Neumaier B, Dietlein M, Wolf J, Kobe C. Tumor lesion glycolysis and tumor lesion proliferation for response prediction and prognostic differentiation in patients with advanced non-small cell lung cancer treated with erlotinib. Clin Nucl Med. 2012;37(11):1058–1064. doi: 10.1097/RLU.0b013e3182639747. [DOI] [PubMed] [Google Scholar]
- 9.Hong YS, Kim HO, Kim KP, Lee JL, Kim HJ, Lee SJ, Lee SJ, Oh SJ, Kim JS, Ryu JS, Moon DH, Kim TW. 3′-Deoxy-3′-18F-fluorothymidine PET for the early prediction of response to leucovorin, 5-fluorouracil, and oxaliplatin therapy in patients with metastatic colorectal cancer. J Nucl Med. 2013;54(8):1209–1216. doi: 10.2967/jnumed.112.117010. [DOI] [PubMed] [Google Scholar]
- 10.Mankoff DA, Muzi M, Krohn KA. Quantitative positron emission tomography imaging to measure tumor response to therapy: what is the best method? Mol Imaging Biol. 2003;5(5):281–285. doi: 10.1016/j.mibio.2003.09.002. [DOI] [PubMed] [Google Scholar]
- 11.Doot RK, Kurland BF, Kinahan PE, Mankoff DA. Design considerations for using PET as a response measure in single site and multicenter clinical trials. Acad Radiol. 2012;19(2):184–190. doi: 10.1016/j.acra.2011.10.008. [DOI] [PMC free article] [PubMed] [Google Scholar]
- 12.Kostakoglu L, Cheson BD. State-of-the-Art Research on “Lymphomas: Role of Molecular Imaging for Staging, Prognostic Evaluation, and Treatment Response”. Front Oncol. 2013;3:212. doi: 10.3389/fonc.2013.00212. [DOI] [PMC free article] [PubMed] [Google Scholar]
- 13.Keyes JWJ. SUV: standard uptake or silly useless value? J Nucl Med. 1995;36:1836–1839. [PubMed] [Google Scholar]
- 14.Huang SC. Anatomy of SUV. Standardized uptake value. Nucl Med Biol. 2000;27(7):643–646. doi: 10.1016/s0969-8051(00)00155-4. [DOI] [PubMed] [Google Scholar]
- 15.Shankar LK, Hoffman JM, Bacharach S, Graham MM, Karp J, Lammertsma AA, Larson S, Mankoff DA, Siegel BA, Van den Abbeele A, Yap J, Sullivan D. Consensus recommendations for the use of 18F-FDG PET as an indicator of therapeutic response in patients in National Cancer Institute Trials. J Nucl Med. 2006;47(6):1059–1066. [PubMed] [Google Scholar]
- 16.Lin C, Itti E, Haioun C, Petegnief Y, Luciani A, Dupuis J, Paone G, Talbot JN, Rahmouni A, Meignan M. Early 18F-FDG PET for prediction of prognosis in patients with diffuse large B-cell lymphoma: SUV-based assessment versus visual analysis. J Nucl Med. 2007;48(10):1626–1632. doi: 10.2967/jnumed.107.042093. [DOI] [PubMed] [Google Scholar]
- 17.Wahl RL, Jacene H, Kasamon Y, Lodge MA. From RECIST to PERCIST: evolving considerations for PET response criteria in solid tumors. J Nucl Med 50 Suppl. 2009;1:122S–150S. doi: 10.2967/jnumed.108.057307. [DOI] [PMC free article] [PubMed] [Google Scholar]
- 18.Zasadny KR, Wahl RL. Standardized uptake values of normal tissues at PET with 2-[fluorine-18]-fluoro-2-deoxy-D-glucose: variations with body weight and a method for correction. Radiology. 1993;189:847–850. doi: 10.1148/radiology.189.3.8234714. [DOI] [PubMed] [Google Scholar]
- 19.Kim CK, Gupta N, Chandramouli B, Alavi A. Standardized uptake values of FDG: body surface area correction is preferable to body weight correction. J Nucl Med. 1994;35:164–167. [PubMed] [Google Scholar]
- 20.Muzi M, O'Sullivan F, Mankoff DA, Doot RK, Pierce LA, Kurland BF, Linden HM, Kinahan PE. Quantitative assessment of dynamic PET imaging data in cancer imaging. Magn Reson Imaging. 2012;30(9):1203–1215. doi: 10.1016/j.mri.2012.05.008. [DOI] [PMC free article] [PubMed] [Google Scholar]
- 21.Doot RK, Dunnwald LK, Schubert EK, Muzi M, Peterson LM, Kinahan PE, Kurland BF, Mankoff DA. Dynamic and static approaches to quantifying 18F-FDG uptake for measuring cancer response to therapy, including the effect of granulocyte CSF. J Nucl Med. 2007;48(6):920–925. doi: 10.2967/jnumed.106.037382. [DOI] [PMC free article] [PubMed] [Google Scholar]
- 22.Dunnwald LK, Doot RK, Specht JM, Gralow JR, Ellis GK, Livingston RB, Linden HM, Gadi VK, Kurland BF, Schubert EK, Muzi M, Mankoff DA. PET tumor metabolism in locally advanced breast cancer patients undergoing neoadjuvant chemotherapy: value of static versus kinetic measures of fluorodeoxyglucose uptake. Clin Cancer Res. 2011;17(8):2400–2409. doi: 10.1158/1078-0432.CCR-10-2649. [DOI] [PMC free article] [PubMed] [Google Scholar]
- 23.Tomasi G, Turkheimer F, Aboagye E. Importance of quantification for the analysis of PET data in oncology: review of current methods and trends for the future. Mol Imaging Biol. 2012;14(2):131–146. doi: 10.1007/s11307-011-0514-2. [DOI] [PubMed] [Google Scholar]
- 24.Patlak CS, Blasberg RG, Fenstermacher JD. Graphical evaluation of blood-to-brain transfer constants from multiple-time uptake data. J Cereb Blood Flow Metab. 1983;3(1):1–7. doi: 10.1038/jcbfm.1983.1. [DOI] [PubMed] [Google Scholar]
- 25.Weber WA, Ziegler SI, Thodtmann R, Hanauske AR, Schwaiger M. Reproducibility of metabolic measurements in malignant tumors using FDG PET. J Nucl Med. 1999;40(11):1771–1777. [PubMed] [Google Scholar]
- 26.Freedman NM, Sundaram SK, Kurdziel K, Carrasquillo JA, Whatley M, Carson JM, Sellers D, Libutti SK, Yang JC, Bacharach SL. Comparison of SUV and Patlak slope for monitoring of cancer therapy using serial PET scans. Eur J Nucl Med Mol Imaging. 2003;30(1):46–53. doi: 10.1007/s00259-002-0981-4. [DOI] [PubMed] [Google Scholar]
- 27.Lammertsma AA, Hoekstra CJ, Giaccone G, Hoekstra OS. How should we analyse FDG PET studies for monitoring tumour response? Eur J Nucl Med Mol Imaging 33 Suppl. 2006;1:16–21. doi: 10.1007/s00259-006-0131-5. [DOI] [PubMed] [Google Scholar]
- 28.Doot RK, Scheuermann JS, Christian PE, Karp JS, Kinahan PE. Instrumentation factors affecting variance and bias of quantifying tracer uptake with PET/CT. Med Phys. 2010;37(11):6035–6046. doi: 10.1118/1.3499298. [DOI] [PMC free article] [PubMed] [Google Scholar]
- 29.Krak NC, Boellaard R, Hoekstra OS, Twisk JW, Hoekstra CJ, Lammertsma AA. Effects of ROI definition and reconstruction method on quantitative outcome and applicability in a response monitoring trial. Eur J Nucl Med Mol Imaging. 2005;32(3):294–301. doi: 10.1007/s00259-004-1566-1. [DOI] [PubMed] [Google Scholar]
- 30.Beaulieu S, Kinahan P, Tseng J, Dunnwald LK, Schubert EK, Pham P, Lewellen B, Mankoff DA. SUV varies with time after injection in (18)F-FDG PET of breast cancer: characterization and method to adjust for time differences. J Nucl Med. 2003;44(7):1044–1050. [PubMed] [Google Scholar]
- 31.Teo BK, Badiee S, Hadi M, Lam T, Johnson L, Seo Y, Bacharach SL, Hasegawa BH, Franc BL. Correcting tumour SUV for enhanced bone marrow uptake: retrospective 18F-FDG PET/CT studies. Nucl Med Commun. 2008;29(4):359–366. doi: 10.1097/MNM.0b013e3282f44f99. [DOI] [PubMed] [Google Scholar]
- 32.Lockhart CM, MacDonald LR, Alessio AM, McDougald WA, Doot RK, Kinahan PE. Quantifying and reducing the effect of calibration error on variability of PET/CT standardized uptake value measurements. J Nucl Med. 2011;52(2):218–224. doi: 10.2967/jnumed.110.083865. [DOI] [PMC free article] [PubMed] [Google Scholar]
- 33.Fahey FH, Kinahan PE, Doot RK, Kocak M, Thurston H, Poussaint TY. Variability in PET quantitation within a multicenter consortium. Med Phys. 2010;37(7):3660–3666. doi: 10.1118/1.3455705. [DOI] [PMC free article] [PubMed] [Google Scholar]
- 34.Minn H, Zasadny K, Quint L, Wahl R. Lung cancer: reproducibility of quantitative measurements for evaluating 2-[F-18]-fluoro-2-deoxy-D-glucose uptake at PET. Radiology. 1995;196(1):167–173. doi: 10.1148/radiology.196.1.7784562. [DOI] [PubMed] [Google Scholar]
- 35.Nakamoto Y, Zasadny KR, Minn H, Wahl RL. Reproducibility of common semi-quantitative parameters for evaluating lung cancer glucose metabolism with positron emission tomography using 2-deoxy-2-[18F]fluoro-D-glucose. Mol Imaging Biol. 2002;4(2):171–178. doi: 10.1016/s1536-1632(01)00004-x. [DOI] [PubMed] [Google Scholar]
- 36.Nahmias C, Wahl LM. Reproducibility of standardized uptake value measurements determined by 18F-FDG PET in malignant tumors. J Nucl Med. 2008;49(11):1804–1808. doi: 10.2967/jnumed.108.054239. [DOI] [PubMed] [Google Scholar]
- 37.Takahashi Y, Oriuchi N, Otake H, Endo K, Murase K. Variability of lesion detectability and standardized uptake value according to the acquisition procedure and reconstruction among five PET scanners. Ann Nucl Med. 2008;22(6):543–548. doi: 10.1007/s12149-008-0152-1. [DOI] [PubMed] [Google Scholar]
- 38.Velasquez LM, Boellaard R, Kollia G, Hayes W, Hoekstra OS, Lammertsma AA, Galbraith SM. Repeatability of 18F-FDG PET in a multicenter phase I study of patients with advanced gastrointestinal malignancies. J Nucl Med. 2009;50(10):1646–1654. doi: 10.2967/jnumed.109.063347. [DOI] [PubMed] [Google Scholar]
- 39.de Langen AJ, Vincent A, Velasquez LM, van Tinteren H, Boellaard R, Shankar LK, Boers M, Smit EF, Stroobants S, Weber WA, Hoekstra OS. Repeatability of 18F-FDG uptake measurements in tumors: a metaanalysis. J Nucl Med. 2012;53(5):701–708. doi: 10.2967/jnumed.111.095299. [DOI] [PubMed] [Google Scholar]
- 40.Vanderhoek M, Perlman SB, Jeraj R. Impact of different standardized uptake value measures on PET-based quantification of treatment response. J Nucl Med. 2013;54(8):1188–1194. doi: 10.2967/jnumed.112.113332. [DOI] [PMC free article] [PubMed] [Google Scholar]
- 41.Canadian Agency for Drugs and Technologies in Health Positron emission tomography (PET) in oncology: a systematic review of clinical effectiveness and indications for use. CADTH Technol Overv. 2010;1(4):e0128. [PMC free article] [PubMed] [Google Scholar]
- 42.Gebhart G, Gamez C, Holmes E, Robles J, Garcia C, Cortes M, de Azambuja E, Fauria K, Van Dooren V, Aktan G, Coccia-Portugal MA, Kim SB, Vuylsteke P, Cure H, Eidtmann H, Baselga J, Piccart M, Flamen P, Di Cosimo S. 18F-FDG PET/CT for early prediction of response to neoadjuvant lapatinib, trastuzumab, and their combination in HER2-positive breast cancer: results from Neo-ALTTO. J Nucl Med. 2013;54(11):1862–1868. doi: 10.2967/jnumed.112.119271. [DOI] [PubMed] [Google Scholar]
- 43.Abgral R, Le Roux PY, Keromnes N, Rousset J, Valette G, Gouders D, Leleu C, Mollon D, Nowak E, Querellou S, Salaun PY. Early prediction of survival following induction chemotherapy with DCF (docetaxel, cisplatin, 5-fluorouracil) using FDG PET/CT imaging in patients with locally advanced head and neck squamous cell carcinoma. Eur J Nucl Med Mol Imaging. 2012;39(12):1839–1847. doi: 10.1007/s00259-012-2213-x. [DOI] [PubMed] [Google Scholar]
- 44.Choi M, Heilbrun LK, Venkatramanamoorthy R, Lawhorn-Crews JM, Zalupski MM, Shields AF. Using 18F-fluorodeoxyglucose positron emission tomography to monitor clinical outcomes in patients treated with neoadjuvant chemo-radiotherapy for locally advanced pancreatic cancer. Am J Clin Oncol. 2010;33(3):257–261. doi: 10.1097/COC.0b013e3181a76a0b. [DOI] [PMC free article] [PubMed] [Google Scholar]
- 45.Tsuchida T, Morikawa M, Demura Y, Umeda Y, Okazawa H, Kimura H. Imaging the early response to chemotherapy in advanced lung cancer with diffusion-weighted magnetic resonance imaging compared to fluorine-18 fluorodeoxyglucose positron emission tomography and computed tomography. J Magn Reson Imaging. 2013;38(1):80–88. doi: 10.1002/jmri.23959. [DOI] [PubMed] [Google Scholar]
- 46.Usmanij EA, de Geus-Oei LF, Troost EG, Peters-Bax L, van der Heijden EH, Kaanders JH, Oyen WJ, Schuurbiers OC, Bussink J. 18F-FDG PET early response evaluation of locally advanced non-small cell lung cancer treated with concomitant chemoradiotherapy. J Nucl Med. 2013;54(9):1528–1534. doi: 10.2967/jnumed.112.116921. [DOI] [PubMed] [Google Scholar]
- 47.Avallone A, Aloj L, Caraco C, Delrio P, Pecori B, Tatangelo F, Scott N, Casaretti R, Di Gennaro F, Montano M, Silvestro L, Budillon A, Lastoria S. Early FDG PET response assessment of preoperative radiochemotherapy in locally advanced rectal cancer: correlation with long-term outcome. Eur J Nucl Med Mol Imaging. 2012;39(12):1848–1857. doi: 10.1007/s00259-012-2229-2. [DOI] [PubMed] [Google Scholar]
- 48.Bampo C, Alessi A, Fantini S, Bertarelli G, de Braud F, Bombardieri E, Valvo F, Crippa F, Di Bartolomeo M, Mariani L, Milione M, Biondani P, Avuzzi B, Chiruzzi C, Pietrantonio F. Is the standardized uptake value of FDG-PET/CT predictive of pathological complete response in locally advanced rectal cancer treated with capecitabine-based neoadjuvant chemoradiation? Oncology. 2013;84(4):191–199. doi: 10.1159/000345601. [DOI] [PubMed] [Google Scholar]
- 49.Calvo FA, Sole CV, de la Mata D, Cabezon L, Gomez-Espi M, Alvarez E, Madariaga P, Carreras JL. 18F-FDG PET/CT-based treatment response evaluation in locally advanced rectal cancer: a prospective validation of long-term outcomes. Eur J Nucl Med Mol Imaging. 2013;40(5):657–667. doi: 10.1007/s00259-013-2341-y. [DOI] [PubMed] [Google Scholar]
- 50.Lee JH. Radionuclide methods for breast cancer staging. Semin Nucl Med. 2013;43(4):294–298. doi: 10.1053/j.semnuclmed.2013.04.001. [DOI] [PubMed] [Google Scholar]
- 51.Boellaard R. Standards for PET image acquisition and quantitative data analysis. J Nucl Med. 2009;50(Suppl_1):11S–20. doi: 10.2967/jnumed.108.057182. [DOI] [PubMed] [Google Scholar]
- 52.Boellaard R, O'Doherty MJ, Weber WA, Mottaghy FM, Lonsdale MN, Stroobants SG, Oyen WJ, Kotzerke J, Hoekstra OS, Pruim J, Marsden PK, Tatsch K, Hoekstra CJ, Visser EP, Arends B, Verzijlbergen FJ, Zijlstra JM, Comans EF, Lammertsma AA, Paans AM, Willemsen AT, Beyer T, Bockisch A, Schaefer-Prokop C, Delbeke D, Baum RP, Chiti A, Krause BJ. FDG PET and PET/CT: EANM procedure guidelines for tumour PET imaging: version 1.0. Eur J Nucl Med Mol Imaging. 2010;37(1):181–200. doi: 10.1007/s00259-009-1297-4. [DOI] [PMC free article] [PubMed] [Google Scholar]
- 53.Doot RK, Thompson T, Greer BE, Allberg KC, Linden HM, Mankoff DA, Kinahan PE. Early experiences in establishing a regional quantitative imaging network for PET/CT clinical trials. Magn Reson Imaging. 2012;30(9):1291–1300. doi: 10.1016/j.mri.2012.06.002. [DOI] [PMC free article] [PubMed] [Google Scholar]
- 54.Kurland BF, Doot RK, Linden HM, Mankoff DA, Kinahan PE. Multicenter trials using 18F-fluorodeoxyglucose (FDG) PET to predict chemotherapy response: effects of differential measurement error and bias on power calculations for unselected and enrichment designs. Clin Trials. 2013;10(6):886–895. doi: 10.1177/1740774513506618. [DOI] [PMC free article] [PubMed] [Google Scholar]
- 55.Hoetjes NJ, van Velden FH, Hoekstra OS, Hoekstra CJ, Krak NC, Lammertsma AA, Boellaard R. Partial volume correction strategies for quantitative FDG PET in oncology. Eur J Nucl Med Mol Imaging. 2010;37(9):1679–1687. doi: 10.1007/s00259-010-1472-7. [DOI] [PMC free article] [PubMed] [Google Scholar]
- 56.Hickeson M, Yun M, Matthies A, Zhuang H, Adam LE, Lacorte L, Alavi A. Use of a corrected standardized uptake value based on the lesion size on CT permits accurate characterization of lung nodules on FDG-PET. Eur J Nucl Med Mol Imaging. 2002;29(12):1639–1647. doi: 10.1007/s00259-002-0924-0. [DOI] [PubMed] [Google Scholar]
- 57.Avril N, Bense S, Ziegler SI, Dose J, Weber W, Laubenbacher C, Romer W, Janicke F, Schwaiger M. Breast imaging with fluorine-18-FDG PET: quantitative image analysis. J Nucl Med. 1997;38(8):1186–1191. [PubMed] [Google Scholar]
- 58.Vesselle H, Salskov A, Turcotte E, Wiens L, Schmidt R, Jordan CD, Vallieres E, Wood DE. Relationship between non-small cell lung cancer FDG uptake at PET, tumor histology, and Ki-67 proliferation index. J Thorac Oncol. 2008;3(9):971–978. doi: 10.1097/JTO.0b013e31818307a7. [DOI] [PubMed] [Google Scholar]
- 59.Erlandsson K, Buvat I, Pretorius PH, Thomas BA, Hutton BF. A review of partial volume correction techniques for emission tomography and their applications in neurology, cardiology and oncology. Phys Med Biol. 2012;57(21):R119–159. doi: 10.1088/0031-9155/57/21/R119. [DOI] [PubMed] [Google Scholar]
- 60.Gallivanone F, Canevari C, Gianolli L, Salvatore C, Della Rosa PA, Gilardi MC, Castiglioni I. A partial volume effect correction tailored for 18F-FDG-PET oncological studies. Biomed Res Int. 2013;2013:780458. doi: 10.1155/2013/780458. [DOI] [PMC free article] [PubMed] [Google Scholar]
- 61.Hatt M, Le Pogam A, Visvikis D, Pradier O, Cheze Le Rest C. Impact of partial-volume effect correction on the predictive and prognostic value of baseline 18F-FDG PET images in esophageal cancer. J Nucl Med. 2012;53(1):12–20. doi: 10.2967/jnumed.111.092775. [DOI] [PMC free article] [PubMed] [Google Scholar]
- 62.van Heijl M, Phoa SS, van Berge Henegouwen MI, Omloo JM, Mearadji BM, Sloof GW, Bossuyt PM, Hulshof MC, Richel DJ, Bergman JJ, Ten Kate FJ, Stoker J, van Lanschot JJ. Accuracy and reproducibility of 3D-CT measurements for early response assessment of chemoradiotherapy in patients with oesophageal cancer. Eur J Surg Oncol. 2011;37(12):1064–1071. doi: 10.1016/j.ejso.2011.09.004. [DOI] [PubMed] [Google Scholar]
- 63.Maisonobe JA, Garcia CA, Necib H, Vanderlinden B, Hendlisz A, Flamen P, Buvat I. Comparison of PET metabolic indices for the early assessment of tumour response in metastatic colorectal cancer patients treated by polychemotherapy. Eur J Nucl Med Mol Imaging. 2013;40(2):166–174. doi: 10.1007/s00259-012-2274-x. [DOI] [PMC free article] [PubMed] [Google Scholar]
- 64.Nehmeh SA, Erdi YE. Respiratory motion in positron emission tomography/computed tomography: a review. Semin Nucl Med. 2008;38(3):167–176. doi: 10.1053/j.semnuclmed.2008.01.002. [DOI] [PubMed] [Google Scholar]
- 65.Liu C, Pierce LA, 2nd, Alessio AM, Kinahan PE. The impact of respiratory motion on tumor quantification and delineation in static PET/CT imaging. Phys Med Biol. 2009;54(24):7345–7362. doi: 10.1088/0031-9155/54/24/007. [DOI] [PMC free article] [PubMed] [Google Scholar]