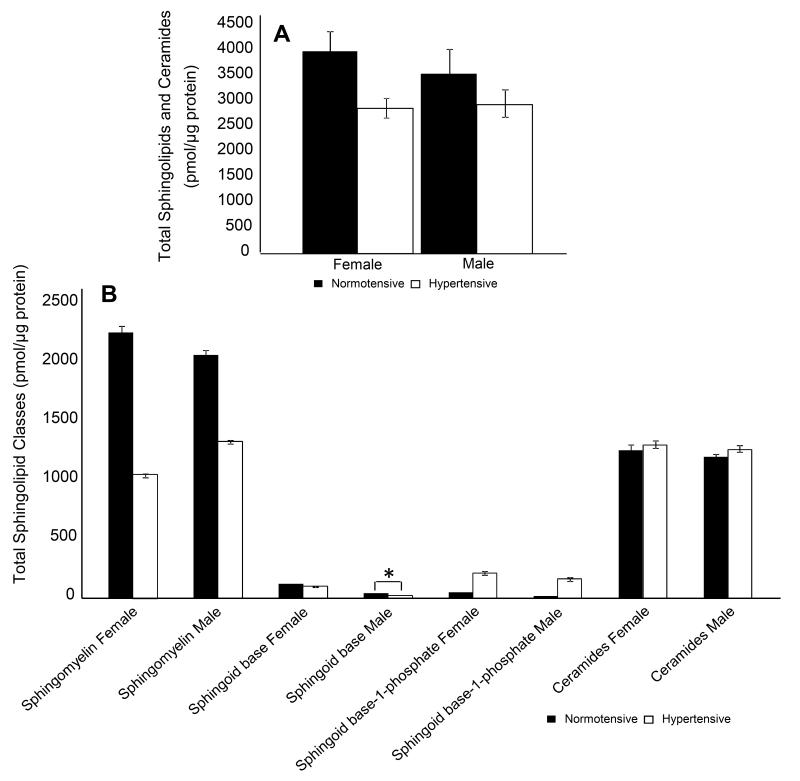
Fig. 4.
(A) Estimated average total amounts of sphingolipids and ceramides for normotensive and hypertensive states between both genders. Comparison of average total amounts of (B) sphingolipid classes between normotensive and hypertensive states are represented as filled and hollow bar graphs[(*p<0.05), differences are relative to the normotensive state].

