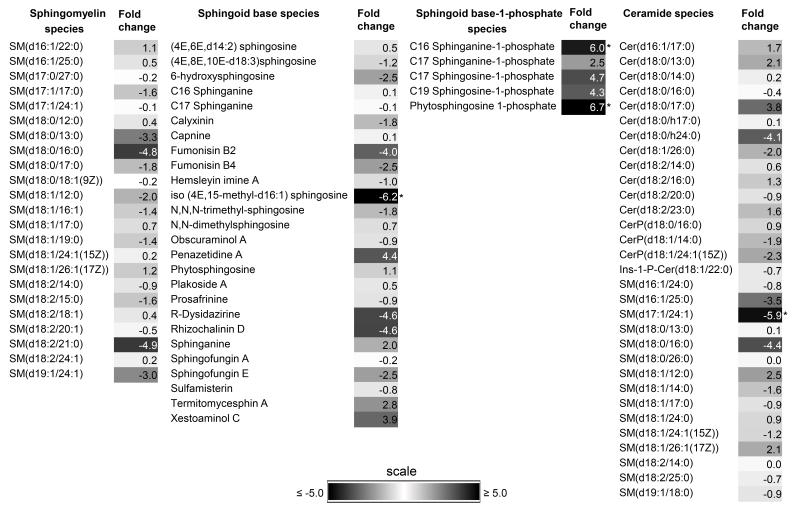
Fig. 5.
Heat map of fold change (fc) in common lipid species between normotensive and hypertensive states of both genders combined. The fold change is the ratio relative to normotensive state based on a log2 scale. A negative sign precedes before modulus where the denominator is higher indicating higher amounts are present in normotensive than hypertensive state. Scale bar of fc used for given lipid species are as indicated[*|fc|≥ 5.0].

