

Abstract
Proinflammatory responses by Toll‐like receptors (TLRs) to malaria infection are considered to be a significant factor in suppressing pathogen growth and in disease control. The key protozoan parasite Plasmodium falciparum causes malaria through glycosylphosphatidylinositols (GPIs), which induce the host immune response mainly via TLR2 signalling. Experimental studies have suggested that malarial GPIs from P. falciparum are recognized by the TLR2 subfamily. However, the interaction site and their involvement in the activation mechanism are still unknown. A better understanding of the detailed structure of the TLR–GPI interaction is important for the design of more effective anti‐malarial therapeutics. We used a molecular docking method to predict the binding regions of malarial GPIs with the TLR2 subfamily members. We also employed molecular dynamics simulations and principal component analysis to understand ligand‐induced conformational changes of the TLR2 subfamily. We observed the expected structural changes upon ligand binding, and significant movements were found in loop regions located in the ligand‐binding site of the TLR2 subfamily. We further propose that the binding modes of malarial GPIs are similar to lipopeptides, and that the lipid portions of the ligands could play an essential role in selective dimerization of the TLR2 subfamily.
Keywords: glycosylphosphatidylinositol, molecular docking, molecular dynamics simulation, principal component analysis, Toll‐like receptor
Abbreviations
- ECD
extracellular domain
- GPI
glycosylphosphatidylinositol
- IL
interleukin
- Ino
inositol
- LRR
leucine rich repeat
- Man
mannose
- MD
molecular dynamics
- PCA
principal component analysis
- TIR
Toll/IL‐1R homology
- TLR
Toll‐like receptor
Introduction
Malaria is a predominant disease and is one of the most deadly infectious diseases 1. In 2010, an estimated 3.3 billion people were in danger of contracting malaria and 655 000 deaths as a result of malaria were reported in 106 malaria‐endemic countries 2. The main cause of severe malaria include renal failure, pulmonary dysfunction, shock, disseminated intravascular coagulation, hypoglycaemia, metabolic acidosis and liver dysfunction 3. In humans, malaria is caused mainly by five protozoan parasite species of the genus Plasmodium: Plasmodium falciparum, Plasmodium vivax, Plasmodium malariae, Plasmodium ovale and Plasmodium knowlesi 4. Plasmodium falciparum is the most deadly among these five species and contributes to 80–90% of the total malarial mortality rate worldwide 6.
Innate immune mechanisms play a significant role in preventing diseases, including malaria, and also initiate long‐lasting acquired immunity to eliminate pathogens and generate immunological memory in the late phase of infection 5. Glycosylphosphatidylinositols (GPIs) of P. falciparum are a crucial component among malarial toxins, and they induce the production of proinflammatory cytokines, including tumour‐necrosis factor‐α, interleukin (IL)‐1, IL‐12 and nitric oxide, which are implicated in malaria pathogenesis 7. Toll‐like receptors (TLRs) are the most studied among the innate immune receptors, and it has been reported that TLRs, most notably TLR2, are involved in counteracting P. falciparum by recognition of GPIs, the anchoring protein of the parasite 8.
GPIs are glycolipids that are pervasive in eukaryotes such as protozoa, fungi, yeast, plants, mollusks, insects and vertebrates 10. The structure and function of GPIs vary from species to species, although the main function of GPIs in parasites is to anchor proteins to the cell membrane 6. For P. falciparum, intact GPI or Man4‐GPI, have four mannose (Man) groups, one glucosamine and one inositol (Ino); the tetramannosylglucosaminyl pentasaccharide is linked to phosphatidylinositol (Fig. S1) 6. The Ino residue is acylated at the c‐2 position. There are three fatty acid substituents in the Ino residue; each of the sn‐1 and c‐2 positions have a saturated fatty‐acyl substituent and the sn‐2 position has an unsaturated fatty‐acyl moiety 6.
TLRs are type 1 transmembrane proteins with an extracellular domain (ECD) for ligand recognition at the N‐terminus and a transmembrane helix domain, which connects the cytoplasmic Toll/IL‐1R homology (TIR) domain that initiates signalling cascades 13. A molecular evolution study clustered vertebrate TLRs into six subfamilies: TLR1/2/6/10, TLR3, TLR4, TLR5, TLR7/8/9 and TLR11/12/13/21/22/23 14. The ECDs of these six subfamilies of TLRs each bind to specific pathogen‐associated molecular patterns. There are also possibilities of recognition of ligands by TLRs specific to species 15. Each ECD comprises 18–25 copies of leucine rich repeats (LRRs) that form a horseshoe‐like structure and are involved in various physiological functions, including immune responses and signal transduction 16. To date, the ECD dimeric structures of TLRs 1, 2 and 4 (human), TLRs 2, 3 and 6 (mouse), and TLR5 (zebrafish) with their ligands have been reported 17. These published TLR–ligand structures clearly exhibit the mechanism by which pathogen‐associated molecular patterns are recognized by their receptors 22. In addition, these reported structures indicate that TLRs 1, 2, 4 and 6 are members of the ‘atypical’ subfamily of the LRR superfamily, whereas TLR3 and 5 are ‘typical’ subfamily members of the LRR superfamily 16. Structural differences between these two subfamilies in their LRR domains arise from the irregular arrangements of β‐sheets; the ‘atypical’ LRR subfamily can be divided into N‐terminal, central and C‐terminal subdomains 16. The central domain is predicted to play a key role in ligand recognition 16.
The ECD of TLR2 can sense ligands from various pathogens, including parasites such as bacteria, fungus and viruses, and ligands such as triacylated peptides, lipoteichoic acid, diacylated lipoproteins, GPIs, phospholipomannan and glycoprotein B 23. Homology models of TLR10 complexes were built and refined through molecular dynamics (MD) simulations to predict the protein–ligand complexes hTLR2‐hTLR10‐Pam3CSK4, hTLR1‐hTLR10‐PamCysPamSK4 and hTLR10‐hTLR10‐PamCysPamSK4 28. X‐ray crystallography studies of dimeric complexes of TLR2 in combination with TLR1, which recognizes Pam3CSK4, and another combination of TLR2 with TLR6, which recognizes Pam2CSK4, have dissected ECDs of the TLR2 subfamily 17. Both of these dimeric crystallography studies revealed the structural basis for ligand‐induced receptor dimerization and explained the requirement for TLR2‐TLR1 and TLR2‐TLR6 heterodimerization in response to triacylated and diacylated lipopeptides, respectively, to initiate TLR signalling.
Previous biochemical studies are available for GPIs recognition by TLR2 that leads to the activation of downstream signalling. The recognition of GPIs of the protozoans P. falciparum or Toxoplasma gondii appears to be via TLR2 and TLR4 29. In an experimental study by Krishnegowda et al. 30, using mouse macrophages and human monocytes, P. falciparum malarial GPIs consisting of three fatty acid chains were favourably recognized by human and mouse TLR2‐TLR1 30. Moreover, one of the derivatives of GPIs called sn‐2‐lyso GPI was the ligand for the hTLR2‐hTLR6 complex. The above result was confirmed in another recent experimental study using macrophages from gene knockout mice, in addition to human monocytes and anti‐human TLR1 and TLR6 sera 31. The ECD of TLR2 has the potential to recognize GPIs in the same binding sites of lipopeptides because the structural patterns of GPIs and lipoproteins are similar, although they are different classes of compounds 30. There is sufficient evidence for TLR2 recognition of GPIs; however, the binding site of GPIs and the interacting residues in the protein that would be useful for developing anti‐malarial drugs or vaccines are still unknown.
In the present study, we used some of the methods discussed below to determine the details of the interaction of the TLR2 subfamily with P. falciparum Man4‐GPI and the sn‐2 lyso GPI derivative. Molecular docking is a widely used modelling tool for predicting the exact positioning of a ligand in the active site of a protein 32. Hence, in the present study, we employed molecular docking to investigate the interactions between P. falciparum Man4‐GPI and hTLR2‐hTLR1 and between sn‐2 lyso GPI and mTLR2‐mTLR6. In addition, MD simulations that can report at the atomic level are appropriate for highlighting the dynamics of a given structure to validate the experimental studies on the ligand‐induced dimerization analysis of TLRs 33. It is well known that ligands induce dimerization of the TLR2 subfamily 17; therefore, by utilizing MD techniques, we simulated the subfamily of TLR2 for 15 ns as a monomer and dimer in the absence and presence of the GPI to better understand the ligand‐induced dimerization and activation mechanism at the atomic level.
Finally, we were interested in determining the most dominant or functionally important movements of the proteins when the dimers were bound and unbound to the ligands. Principal component analysis (PCA) was used to identify geometrical differences and global motions of the TLR2 subfamily when bound and unbound to GPIs. We observed that the Man4‐GPI with three fatty acid moieties was recognized by hTLR2‐hTLR1, and sn‐2 lyso GPI with two fatty acid moieties was recognized by mTLR2‐mTLR6. Hence, our observations are consistent with the hypothesis that the lipid moiety of the ligand plays a crucial role in TLR2 subfamily specificity of ligand recognition 31. To our knowledge, no prior crystallography studies or molecular modelling studies have reported the interaction of GPIs with TLRs. The present study is the first to present the structural interactions of the GPIs with TLR2 subfamily members; these data could be used to facilitate the development of anti‐malarial agents that specifically target TLR2 signalling.
Results and Discussion
Interaction between GPIs and TLR2 heterodimeric complexes
Although every TLR–ligand interaction is different, they all produce an ‘m’‐shaped dimeric complex with the C‐terminus in the centre and the N‐terminus on the outside 34. Among the TLRs, TLR2 has a unique characteristic in that it can form heterodimers with TLR1 or TLR6 to recognize ligands 8. Many experimental studies have suggested that Man4‐GPI and sn‐2 lyso GPI are recognized by TLR2‐TLR1 and TLR2‐TLR6, respectively, and their interactions could be analogous to the recognition of lipopeptides 30. From previous experimental studies 30, it is well known that GPIs bind TLR2 heterodimers; therefore, we predicted the binding sites of Man4‐GPI and sn‐2 lyso GPI in the hTLR2‐hTLR1 and mTLR2‐mTLR6 complexes, respectively. Docking studies were performed using gold and mvd software to obtain insight into the binding conformation of Man4‐GPI and the sn‐2 lyso GPI derivative with TLR2 subfamily members. A total of 100 different conformations were obtained for both complexes; the top ten poses were selected for each complex, and their conformational stability was assessed. Based on the binding mode analysis, the optimal conformation for both Man4‐GPI and sn‐2 lyso GPI was selected from GOLD yield complex. In addition, the selected binding modes were similar to the lipopeptides conformation reported previously 30.
Analysis of the selected hTLR2‐hTLR1–Man4‐GPI complex revealed that Man4‐GPI was recognized in the convex region, which is in the same site where Pam3CSK4 binds 17 (Fig. 1). Man4‐GPI has three lipid chains (Fig. S1) and, among those, the acyl chain at the sn‐1 position and Ino predominate chain were buried in the hTLR2 pocket (volume: approximately 1600 Å3). The fatty acid substituent at the sn‐2 position was accommodated into the TLR1 channel (volume: approximately 400 Å3), and the head group of Man4‐GPI was exposed out of the TLR2 pocket and interacted with the hydrophilic residues (Fig. 2A). Six hydrogen‐bonding contacts between hTLR2‐hTLR1 and the Man4‐GPI were observed (Fig. 2B), and the TLR residues that participated were Phe325, Asp327, Asn294 of hTLR2, as well as Gly313 and Gly316 of hTLR1.
Figure 1.
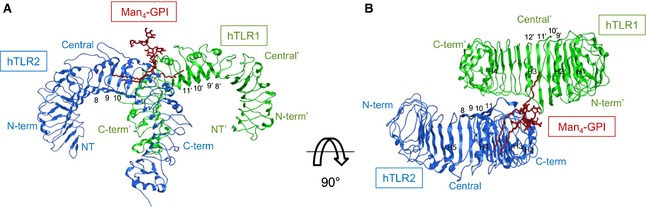
Docked structure of the hTLR2‐hTLR1–Man4‐GPI complex. Ribbon diagram of hTLR2‐hTLR1–Man4‐GPI (hTLR2, hTLR1 and Man4‐GPI are shown in green, blue and dark red, respectively). (A) Side view. (B) Top view. LRR modules and helix numbers are written in black.
Figure 2.
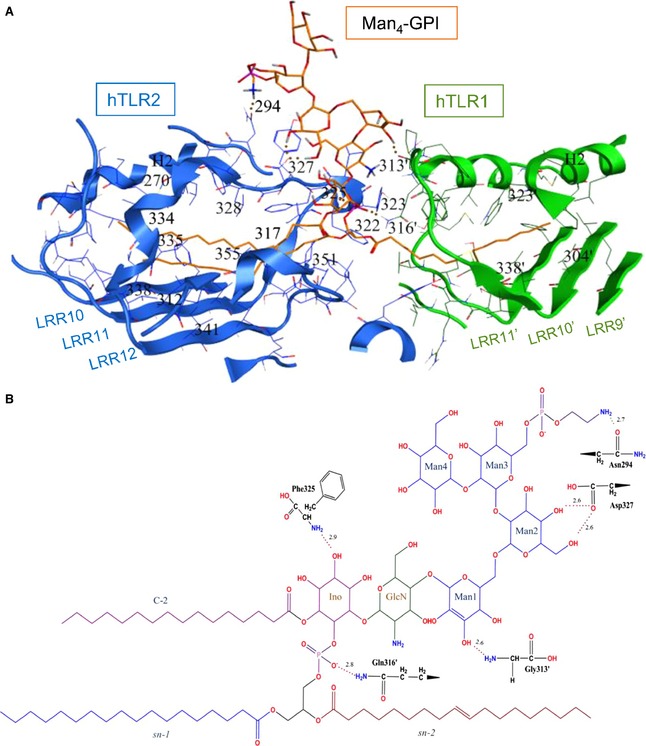
The Man4‐GPI binding site in the docked structure of the hTLR2‐hTLR1 complex. (A) The hTLR2 and hTLR1 residues involved in Man4‐GPI binding are shown in blue and green, respectively. The hydrogen bonds are shown by dotted red lines. Carbons, nitrogens, oxygens and phosphorous of Man4‐GPI are coloured in orange, blue, red and purple, respectively. (B) The chemical structure of Man4‐GPI and residues forming hydrogen bonds. Hydrogen bonds are shown with dotted red lines, and their bond distances are written above the lines in angstroms. Carbons, nitrogens, oxygens and phosphorous of Man4‐GPI are coloured in black, blue, red and purple, respectively. Apostrophes are used for hTLR1 residues to differentiate from residues in hTLR2.
The best docking complex for mTLR2‐mTLR6‐sn‐2 lyso GPI among the top ten ranked complexes was selected for analysis. As stated above, the orientation resembles the available crystal structure of the mTLR2‐mTLR6–Pam2CSK4 complex 18. The volume of mTLR2 pocket is approximately 1200 Å3, although the hydrophobic channel of mTLR6 was blocked by phenylalanine residues 343 and 365 18; however, mTLR2‐mTLR6 could still recognize sn‐2 lyso GPI (Fig. 3) because it lacks the fatty acid substituent at the sn‐2 position of Man4‐GPI (Fig. S1). As a result of the presence of the two phenylalanine residues present in mTLR6, we failed to produce Man4‐GPI in a complex with mTLR2‐mTLR6. Eight hydrogen bonds were observed in the mTLR2‐mTLR6–sn‐2 lyso GPI complex (Fig. 4). The amino acids that formed hydrogen bonds with sn‐2 lyso GPI were Glu264, Asp294, Asp327 of mTLR2, and Phe319 and Lys321 of mTLR6. Asp327 was the common hydrogen‐bonding residue in the docked complexes (hTLR2‐hTLR1–Man4‐GPI and mTLR2‐mTLR6–sn‐2 lyso GPI), as observed in the previously reported hTLR2‐hTLR1–Pam3CSK4 and mTLR2‐mTLR6–Pam2CSK4 crystal structures. The hTLR2 contains an Asn residue, whereas mTLR2 contains an Asp residue at position 294, and both of these residues were involved in hydrogen bonding with their respective ligands. In addition to crystallographic studies on TLR2 17, there is also a recent mutational study that supports the docked binding site 35. Phe325 formed a hydrogen bond with Man4‐GPI, and Asp327 formed a hydrogen bond with Man4‐GPI and sn‐2 lyso GPI; these residues were shown to be necessary for mediating cellular responses and for strong nuclear factor‐κB activation in TLR signalling 35. In another mutagenesis study conducted on TLR1, the Gln316Lys substitution was shown to abrogate ligand stimulation, indicating its importance for ligand binding 36. The docked hTLR2‐hTLR1–Man4‐GPI complex showed a potential hydrogen bond between Gln316 of TLR1 and the GPI, which is consistent with previously published data and supports the validation of the selected docked complex.
Figure 3.
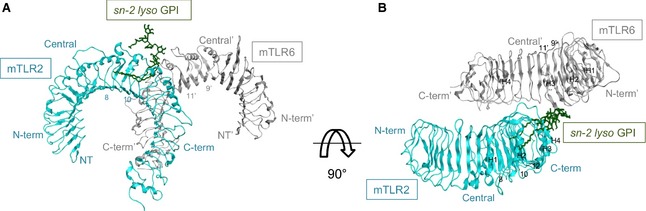
Docked structure of the mTLR2‐mTLR6‐sn‐2 lyso GPI complex. Ribbon diagram of mTLR2‐mTLR6–sn‐2 lyso GPI (mTLR2 and mTLR6 with sn‐2 lyso GPI are shown in cyan and grey, respectively). (A) Side view. (B) Top view. LRR modules and helix numbers are written in black.
Figure 4.
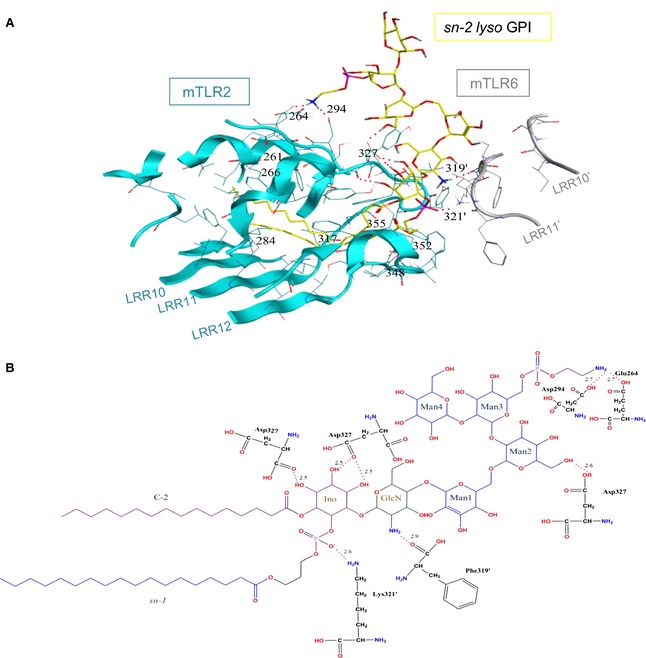
The sn‐2 lyso GPI binding site in the docked structure of the mTLR2‐mTLR6 complex. (A) The mTLR2 and mTLR6 residues involved in sn‐2 lyso GPI binding are shown in cyan and grey, respectively. The hydrogen bonds are shown by dotted red lines. Carbons, nitrogens, oxygens and phosphorous of the sn‐2 lyso GPI are coloured in yellow, blue, red and purple, respectively. (B) The chemical structure of sn‐2 lyso GPI and residues forming hydrogen bonds. Hydrogen bonds are shown with dotted red lines, and their bond distances are written above the lines in angstroms. Carbons, nitrogens, oxygens and phosphorous of sn‐2 lyso GPI are coloured in black, blue, red and purple, respectively. Apostrophes are used for mTLR6 residues to differentiate from residues in mTLR2. Residue Asp327 forms multiple hydrogen bonds with the ligand and so it is shown more than once.
Structural comparison of GPI and lipopeptide complexes of the TLR2 subfamily
TLRs usually recognize ligands at their concave surface, although crystallographic studies have revealed that, when TLR2 heterodimerizes with TLR1 or TLR6, ligand recognition occurs at their convex region 34. The selected docked complexes of Man4‐GPI and sn‐2 lyso GPI also confirmed this unique characteristic of TLR2 (Figs 2A and 4A). Moreover, the convex region ligand‐binding pocket of TLR2 that heterodimerizes with TLR1 and TLR6 to recognize the lipopeptides is present at the edge of the central and C‐terminal domains 16. The Man4‐GPI and sn‐2 lyso GPI binding sites were the same as observed for Pam3CSK4 and Pam2CSK4, respectively. Interestingly, some of the interacting residues in the crystal structure of the hTLR2‐hTLR1–Pam3CSK4 complex were also observed to participate in the docked hTLR2‐hTLR1–Man4‐GPI complex (Fig. 5 and Table 1). To obtain a better view of the conserved residues in both complexes, we have compared them in Fig. S2. In particular, the hTLR2 residues (Asn294 and Asp327) and hTLR1 residues (Gly313 and Gly316) participate in the hydrogen‐bonding network within the Pam3CSK4 crystal complex and the predicted Man4‐GPI complex. In the crystal structure, two ester‐bound lipid chains and a single amide‐bound lipid chain from Pam3CSK4 bound to the hTLR2 and hTLR1 pockets, respectively. Similarly, sn‐1 and c‐2 fatty acid chains shared the hTLR2 pocket, and the sn‐2 fatty acid chain bound to hTLR1. The glycerol and peptide portions in the head group of Pam3CSK4 formed hydrogen bonds and hydrophobic interactions with hTLR2‐hTLR1. Similarly, analysis of the docked hTLR2‐hTLR1–Man4‐GPI complex indicated hydrogen‐bonding interactions between the head group residues of Man4‐GPI (Man, glucosamine and Ino) and the TLRs (Fig. 2).
Figure 5.
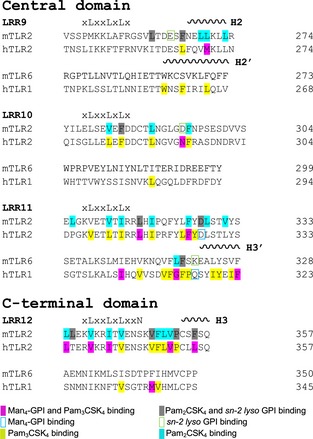
Structure‐based sequence alignment of the ligand‐binding regions of hTLR2, hTLR1, mTLR2 and mTLR6. The ligand binding regions of hTLR2, hTLR1, mTLR2 and mTLR6 sequences are aligned based on their structures. Conserved leucines and residues in the asparagine ladder are written above the sequences. The positions of α‐helices are indicated by coils above the sequences and are numbered.
Table 1. Hydrogen‐bonding interactions of members of the TLR2 subfamily with malarial GPIs and lipopeptides. The hydrogen‐bonding interactions of Man4‐GPI, Pam3CSK4, sn‐2 lyso GPI and Pam2CSK4 with their respective TLRs and hydrogen bond distances are shown.
| TLRs | Residue name and number | Ligand name | Hydrogen bond distance (Å) |
|---|---|---|---|
| hTLR2 | Asn294 | Man4‐GPI | 2.7 |
| Pam3CSK4 | 3 | ||
| Phe325 | Man4‐GPI | 2.9 | |
| Asp327 | Man4‐GPI | 2.6 and 2.5 | |
| Pam3CSK4 | 2.9 | ||
| Phe349 | Pam3CSK4 | 3 | |
| hTLR1 | Gly313 | Man4‐GPI | 2.6 |
| Pam3CSK4 | 2.9 | ||
| Gln316 | Man4‐GPI | 2.8 | |
| Pam3CSK4 | 2.6 | ||
| mTLR2 | Glu264 | sn‐2 lyso GPI | 2.7 |
| Asp294 | sn‐2 lyso GPI | 2.7 | |
| Phe325 | Pam2CSK4 | 3.2 | |
| Asp327 | sn‐2 lyso GPI | 2.5, 2.5, 2.5 and 2.6 | |
| Pam2CSK4 | 2.5 | ||
| Phe349 | Pam2CSK4 | 3 | |
| mTLR6 | Phe319 | sn‐2 lyso GPI | 2.9 |
| Pam2CSK4 | 2.9 | ||
| Lys321 | sn‐2 lyso GPI | 2.6 |
A notable structural similarity of sn‐2 lyso GPI and Pam2CSK4 is the number of lipid chains, which allows sn‐2 lyso GPI to use the Pam2CSK4 binding pocket in the mTLR2‐mTLR6 heterodimer. Therefore, both ligands have few commonly interacting residues (Fig. 5 and Table 1; see also Fig. S3). Pam2CSK4 has two ester‐bound lipid chains and sn‐2 lyso GPI also has two fatty acid chains at the sn‐1 and C‐2 position of the Ino moiety. Both available fatty acid moieties in the sn‐1 and c‐2 positions of Ino of sn‐2 lyso GPI were bound in the mTLR2 pocket, which is the same region where Pam2CSK4 lipid chains are bound 18. Therefore, the small size of the mTLR6 pocket does not make a significant impact on sn‐2 lyso GPI binding. The Phe319 in the LRR11 loop of mTLR6 forms hydrogen bonds with sn‐2 lyso GPI and Pam2CSK4; however, Phe314, the corresponding residue in hTLR1, does not appear to interact with the ligands, which may be a result of differences in the heterodimerization of TLRs.
To evaluate the docked complexes of hTLR2‐hTLR1–Man4‐GPI and mTLR2‐mTLR6–sn2 lyso GPI, we predicted the binding affinity using x‐score 37 and compared it with the crystal structures of tri‐ and di‐acyl lipopeptides. Table 2 shows the calculated binding energy of hTLR2‐hTLR1–Man4‐GPI value to be −13.4 kcal·mol−1, which is close to the value of −12 kcal·mol−1 obtained for the crystal structure of hTLR2‐hTLR1–Pam3CSK4. Similarly, the mTLR2‐mTLR6–sn‐2 lyso GPI had a calculated binding energy of −12 kcal·mol−1, which is almost same as the binding energy of −12.2 kcal·mol−1 predicted for the mTLR2‐mTLR6–Pam2CSK4 complex. Slight differences in the binding energy may be a result of differences between the GPI and lipopeptide complexes such as: (a) P. falciparum GPIs have long lipid chains compared to the lipopeptides that strongly bind their respective receptors and (b) GPIs form more hydrogen bonds with TLRs than with lipopeptides. It should be noted that the crystal structures of TLR2 with other ligands such as pnLTA and PE‐DTPA have shown a lack of hydrogen bonds with TLR2, which leads to low binding affinity because they are unable to stimulate dimerization or activate the receptor 18.
Table 2. Binding affinity prediction. The mean binding affinity scores of docked protein–ligand complexes of hTLR2‐hTLR1–Man4‐GPI and mTLR2‐mTLR6–sn‐2 lyso GPI and crystal structures of hTLR2‐hTLR1–Pam3CSK4 and mTLR2‐mTLR6–Pam2CSK4. pKd, negative logarithm of dissociation constants.
| Protein–ligand complex | Hydrophobic pair score (pKd) | Hydrophobic match score (pKd) | Hydrophobic surface score (pKd) | Predicted mean binding affinity (pKd) | Predicted binding energy (kcal·mol−1) |
|---|---|---|---|---|---|
| hTLR2‐hTLR1–Man4‐GPI | 10.91 | 10.31 | 8.48 | 9.9 | –13.4 |
| hTLR2‐hTLR1–Pam3CSK4 | 9.24 | 10.23 | 7.12 | 8.86 | –12 |
| mTLR2‐mTLR6–sn‐2 lyso GPI | 10.03 | 9.21 | 7.39 | 8.88 | –12 |
| mTLR2‐mTLR6–Pam2CSK4 | 9.97 | 9.83 | 7.18 | 9 | –12.2 |
TLR2 activates the same signalling pathway irrespective of whether it heterodimerizes with TLR1 or TLR6 38. Because our results show that malarial GPIs bind with TLR2 in complex with TLR1 or TLR6, they resemble the known lipopeptides complexes 17. Nevertheless, the P. falciparum GPIs and lipopeptides have a similar series of lipid chains; hence, these P. falciparum GPIs can possibly induce similar TLR2 signalling induced by lipopeptides. Although it has been reported that GPIs from different species with different structures are diversely recognized by TLRs, similar to lipopeptides, after the GPIs bind to ECDs of TLR2, they may induce the dimerization of ECDs that results in dimerization of intracellular TIR domains, which leads to the recruitment of adapter molecules to initiate signalling 16. The GPI‐induced TLR2 signalling, detailed with the adapter molecules, is shown in Fig. 6.
Figure 6.
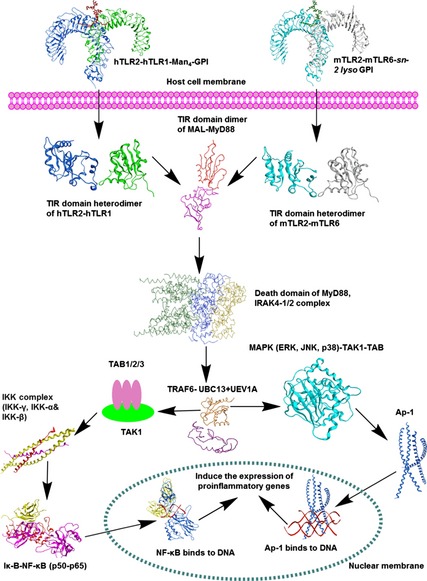
Schematic view of Plasmodium falciparum GPI‐induced TLR2 signalling. TLR2 ECD recognizes GPIs either in combination with TLR1 or TLR6, then their TIR domains dimerize on the cytosolic face and undergo structural changes to recruit adaptor molecules: MyD88, MAL, IL‐1R‐associated kinases (IRAKs), (TGF‐β)‐activated kinase (TAK1), TAK1‐binding protein 1 (TAB1) and TAB2, and then tumour‐necrosis factor‐receptor‐associated factor 6 (TRAF‐6) forms a complex with ligases Ubc13 and Uev1A, which leads to the activation of the mitogen‐activated protein kinase and nuclear factor‐κB pathways to induce the production of proinflammatory cytokines.
Structural stability analysis from MD simulations
Protein stability during MD simulations was monitored by RMSD to examine differences in the monomeric and dimeric forms of the TLR2 subfamily, as well as their effect in the presence of ligand. Therefore, we included dimeric complexes without ligands, even though it is not experimentally possible in the TLR2 subfamily. Accordingly, 15‐ns MD simulations were carried out for two sets of TLRs. The first set contained four systems: hTLR2, hTLR1, hTLR2‐hTLR1 and hTLR2‐hTLR1‐Man4‐GPI; the second set consisted of four systems: mTLR2, mTLR6, mTLR2‐mTLR6 and mTLR2‐mTLR6‐sn‐2 lyso GPI. In addition, to provide a control to compare RMSD of the docked complexes, the 15‐ns MD simulations for the crystal structure of hTLR2‐hTLR1‐Pam3CSK4 were carried out (Fig. S4). The plot of the RMSD of all backbone atoms as a function of time revealed relative changes in the structure, indicating significant protein mobility. As shown in Fig. 7A, the first set of RMSD values for monomers were within a fluctuation range of 0.9–3.3 Å throughout the simulations, except the dimers. For hTLR2‐hTLR1–Man4‐GPI, the RMSD values were in the range 0.9–4.7 Å, whereas, for the hTLR2‐hTLR1 system, the RMSD values were in the range 0.9–5.1 Å during the 15‐ns trajectory. Accordingly, within 15 ns, the RMSD of the ligand‐bound hTLR2‐hTLR1–Man4‐GPI system tended to converge, and a longer simulation time may be needed to reach relaxed equilibrium state. Monomers and the ligand‐unbound hTLR2‐hTLR1 system had not reached equilibrium up to 15 ns. The RMSD determined for the ligand‐unbound hTLR2‐hTLR1 was larger (5.2 Å) than the value calculated for the ligand‐bound hTLR2‐hTLR1–Man4‐GPI complex (4.7 Å). These results were expected because it has been previously shown that both monomers and ligand‐unbound dimers are known to be inactive 39. These data suggest that ligands can induce/stabilize substantial conformation changes on the dimeric complex, whereas the ligand‐free dimer was less stable during the MD simulations. Analysis of the second set showed that the structural drift was continual in all the structures, and the RMSD was in the range 0.9–5 Å, except for the ligand‐bound mTLR2‐mTLR6‐sn‐2 lyso GPI complex (Fig. 7B). The RMSD value of the mTLR2‐mTLR6‐sn‐2 lyso GPI was in the range 0.9–3.2 Å, although, after 3 ns, the system was equilibrated and became stable throughout the simulations and reached a final value 3.1 Å. In both sets, the results showed lower mean RMSD values for ligand‐bound forms than in the ligand‐free forms (3.3 Å for hTLR2‐hTLR1–Man4‐GPI, 3.7 Å for hTLR2‐hTLR1, 2.7 Å for mTLR2‐mTLR6–n‐2 lyso GPI, and 2.9 Å for mTLR2‐mTLR6; Fig. 7), indicating that binding of ligand to this receptor induced/stabilized complex formation. An RMSD analysis of the crystal structure of hTLR2‐hTLR1‐Pam3CSK4 indicates that the RMSD was in the range 0.9–4 Å and it is more stable compared to experimentally solved complexes of hTLR2‐hTLR1–Man4‐GPI. Hence, the results show that the hTLR2‐hTLR1–Man4‐GPI complex needs more time to stabilize compared to the control. It should be noted that, in a MD simulation study on myeloid differentiation protein‐lipid A‐TLR4 complex, the presence of ligand energetically stabilized the complex 39. To observe the conformational changes on the TLR2 subfamily during MD simulation, the distances between the N‐terminal and C‐terminal ends of the TLR2 subfamily structures were calculated for the initial structures and after MD runs using pymol, version 1.5.0.4 (Schrödinger, LLC, Portland, OR, USA; Table 3). Interestingly, after MD simulations, the distances between both their terminals were decreased from their initial structures when hTLR2 and mTLR2 were monomers or dimers with ligands. TLR2 is the key receptor in the heterodimers and the reduced distance observed between both the ends is likely to enable ligand binding and dimerization with TLR1 or TLR6. By contrast, for hTLR1 and mTLR6, the distance between the two ends was found to be increased, which may be to ease ligand binding and heterodimerize with TLR2. The distances measured between the N‐terminal and C‐terminal ends for the final control MD simulation structures for hTLR2‐hTLR1–Pam3CSK4, and the values for hTLR2 and hTLR1, are 54.1 and 44.6 Å, respectively. Those values are closer to the 52 Å of hTLR2 and 45 Å of hTLR1 in the hTLR2‐hTLR1–Man4‐GPI complex (Table 3). In addition, we have calculated the significant movements observed in the ligand‐binding region (Table S1). In the case of ligand‐unbound dimers, the values were variable and inconclusive because these complexes cannot be determined experimentally. Moreover, we calculated the distances of the hTLR2 and hTLR1 both in ligand‐bound and ligand‐unbound forms after 15‐ns MD simulations (Fig. S5). The distances for liganded and unliganded hTLR2 and hTLR1 were 44.9 and 60.4 Å, respectively. Interestingly, this difference shows that unliganded TLR2 heterodimers were unstable and found to disassociate during the course of longer simulation. The values agreed with previously published values 40, indicating that, upon ligand binding, TLRs switch to a shortened and activated form.
Figure 7.
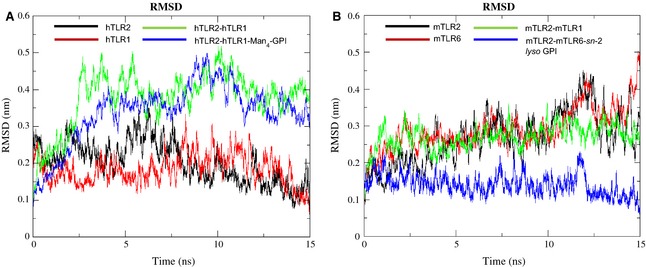
RMSD plots of ligand‐bound and ligand‐unbound complexes. (A) The RMSD plot for the backbone atoms of hTLR2, hTLR1, hTLR2‐ hTLR1 and hTLR2‐hTLR1‐Man4‐GPI relative to the initial structure over 15‐ns MD simulations. (B) The RMSD plot for the backbone atoms of mTLR2, mTLR6, mTLR2‐mTLR6 and mTLR2‐mTLR6‐sn‐2 lyso GPI relative to the initial structure over 15‐ns MD simulations.
Table 3. Comparison of TLR2 subfamily ECDs before and after MD simulations. The distances between the N‐ and C‐terminal ends of TLR2 subfamily members were calculated for their initial and 15‐ns structures.
| TLRs | Initial structure (Å) | After MD simulations as monomer (Å) | After MD simulations as ligand‐unbound dimer (Å) | After MD simulations as ligand‐bound dimer (Å) |
|---|---|---|---|---|
| hTLR2 | 59.1 | 49.3 | 50.9 | 52 |
| hTLR1 | 44.1 | 55.7 | 43.3 | 45 |
| mTLR2 | 56.3 | 52 | 62.7 | 53.9 |
| mTLR6 | 47.9 | 41.8 | 48.4 | 48.7 |
Residual flexibility analysis from MD simulations
The final 5 ns were used to calculate the RMSF plot of backbone atoms for hTLR2, hTLR1, hTLR2‐hTLR1, hTLR2‐hTLR1–Man4‐GPI, mTLR2, mTLR6, mTLR2‐mTLR6 and mTLR2‐mTLR6–sn‐2 lyso GPI (Fig. 8). In addition, the RMSF values were calculated for the crystal structure of hTLR2‐hTLR1–Pam3CSK4 to compare the fluctuations of residues in docked complexes (Fig. S6). For both ligand‐unbound forms, the two sets showed large fluctuations for the backbone atoms compared to the corresponding ligand‐bound form. Notably, the RMSF for control hTLR2‐hTLR1–Pam3CSK4 also showed results similar to other docked complexes compared to ligand‐unbound forms (Fig. S6). The results from both the crystal and docked complexes showed that the residues in the ligand‐binding regions stabilized upon ligand recognition. The RMSF values also indicated that the residues with higher fluctuation values were those located in the loop or helix regions. In both of the sets subjected to MD simulations, the N‐terminal and C‐terminal regions showed higher fluctuation than other LRR regions. The TLR2 subfamily binds with a wide‐range of microbial compounds and proteins in addition to lipoproteins and lipopeptides 25. Among them, peptidoglycan of Staphylococcus aureus can bind to the N‐terminus or C‐terminus of the TLR2 42; proline‐proline‐glutamic acid 18 of Mycobacterium tuberculosis has been shown to interact with the C‐terminal region of TLR2 43; and both the N‐ and C‐terminus LRRs of TLR1 and TLR6 play a minimal role in accommodating LT‐IIb‐B5 44. Hence, we hypothesize that the N‐ and C‐terminal fluctuations observed in our analysis are reasonable because they are involved in diverse interactions with multiple ligands. Moreover, the ligand‐induced dimerization takes place in the C‐terminal region of TLR2, TLR1 and TLR6 17. In addition to these N‐ and C‐terminal regions, there were high fluctuations on hTLR2, hTLR1 and mTLR2 in their ligand‐binding LRR 9–12 regions. For mTLR6, fluctuations were observed in the ligand‐binding site LRR 11‐14.
Figure 8.
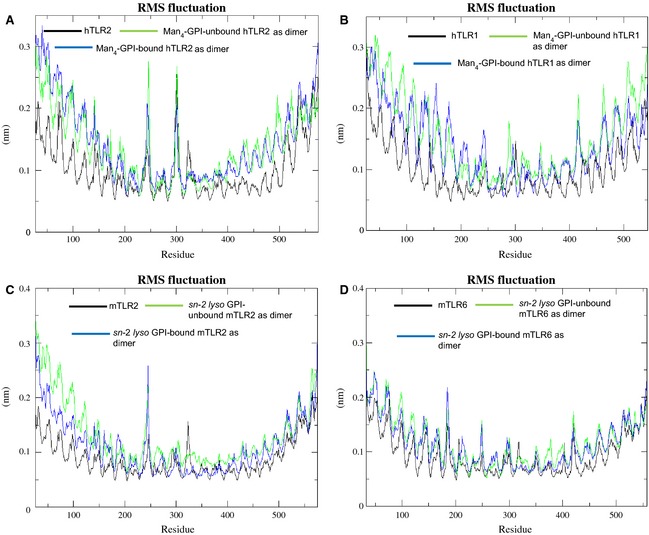
RMSF Plots of ligand‐bound and ligand‐unbound complexes. RMSF plots of residue fluctuations obtained by averaging atomic fluctuations over the last 5 ns of MD simulations. Ligand‐bound and ligand‐unbound states of (A) hTLR2, (B) hTLR1, (C) mTLR2 and (D) mTLR6.
In hTLR2 and hTLR1, relative differences in the loop regions were observed compared to the helix and β‐sheet regions in the absence and presence of Man4‐GPI. The binding site residues showed different flexibilities, demonstrating that these residues are stringent after binding to Man4‐GPI (Fig. 8A,B). Interestingly, in the ligand‐binding region, residues Glu246, Thr247, Asn248, Asn300, Asp301, Arg302 and Val303 of hTLR2, as well as Asp288 and Phe289 of hTLR1, showed more fluctuations than the others in the absence and presence of Man4‐GPI. The overall fluctuations of residues in the control hTLR2‐hTLR1–Pam3CSK4 complex are the same as the hTLR2‐hTLR1–Man4‐GPI complex. Moreover, when we compared the residual fluctuations with individual monomers and unliganded dimers, we observed fewer fluctuations (Fig. S6). This observation indicated conformational changes in these residues that were stabilized by an interaction with the Man4‐GPI ligand. Notably, a previous mutagenesis study on TLR2 implies that the above stabilized residues Glu246 and Asp301 had an intermediate response to Pam3CSK4 regardless of there being no contact with TLR1 or the ligand 35. In another set of mTLR2 and mTLR6, the RMSF plot showed that the binding of sn‐2 lyso GPI to mTLR2‐mTLR6 resulted in a decreased flexibility of the residues and was relatively stable (Fig. 8C,D). The fluctuations of residues in hTLR2 and mTLR2 were not the same, possibly as a result of structural differences: (a) the lipid binding pocket of mTLR2 is smaller than hTLR2 and (b) sequence similarity between hTLR2 and mTLR2 is only 68%, which leads to structural changes between those TLRs in the LRR10 and LRR11 regions 17. As discussed above, the role and fluctuations of Glu246 in the hTLR2‐hTLR1–Man4‐GPI complex and the same residue present in the loop region before the beginning of LRR9 of mTLR2 also showed high fluctuations. In addition, LRR10 residues, including Glu299 and Ser300, showed fluctuations, although the RMSF value was relatively low for residues in the protein–ligand complex. The ligand‐binding LRR 9–12 of mTLR2 and LRR 11–14 of mTLR6 was also flexible. The RMSF plot clearly shows the overall increased fluctuations of ligand‐independent complexes and the RMSF values for control agree with the results for the P. falciparum GPI complexes (Fig. S6).
PCA
To better understand the conformational changes of the ligand‐induced dimerization mechanism of TLR2 with their partners, 15‐ns MD trajectories were analyzed by examining only the motions with the principal components. The contributions to the motion of the first ten collective modes for all TLRs are shown in Fig. S7. The application of PCA to the backbone atoms of hTLR2, hTLR1, hTLR2‐hTLR1 and hTLR2‐hTLR1–Man4‐GPI motions of the simulation indicated that over 23%, 15%, 67% and 66%, respectively, of these motions are accounted for by the first two eigenvectors (Fig. S7). On the other hand, the first two eigenvectors covered 11%, 16%, 72% and 40% for mTLR2, mTLR6, mTLR2‐mTLR6 and mTLR2‐mTLR6–sn‐2 lyso GPI, respectively. We also investigated whether conformational changes occurred if the ligand was removed from the heterodimeric complexes of mTLR2 and hTLR2; therefore, we manually removed their ligands and performed the PCA for their backbone atoms. PCA motions of the first two eigenvectors for hTLR2‐hTLR1 and mTLR2‐mTLR6 dimers without ligand were over 67% and 72%, respectively (Fig. S7). The motions of backbone atoms for the first two eigenvectors and their amplitude are given in Fig. S8. For dimers bound and unbound to their ligands, the first two modes covered the crucial fluctuations with motion. Consequently, the projections of the TLR2 subfamily in each MD trajectory onto the essential space (planes) defined by eigenvector 1 and 2 (Fig. 9) allow the visualization of the conformational spaces sampled from MD calculations. The distribution of all monomers of hTLR2, hTLR1, mTLR2 and mTLR6 were relatively similar, which indicates that, when TLRs remain as a monomer, they stay in a similar conformational state; however, the dimer with ligand showed dissimilar eigenvectors. The size of each cluster in Fig. 9 indicates that hTLR2‐hTLR1–Man4‐GPI and mTLR2‐mTLR6–sn‐2 lyso GPI undergo large conformational changes during simulation. Each trajectory of the MD simulations projected onto eigenvectors 1 and 2 had two well‐defined clusters, indicating that the monomer and dimer had two distinct minima during the molecular dynamics trajectory. The removal of ligand from the dimeric complexes of hTLR2‐hTLR1 and mTLR2‐mTLR6 led to an extensive sampling of phase space until the system reached different local minima on the energy landscape.
Figure 9.
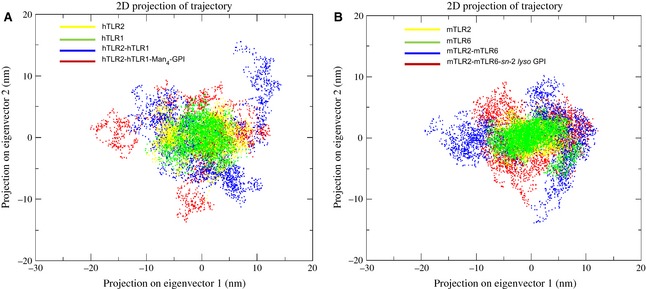
PCA of the TLR2 subfamily. The cloud represents the 15‐ns trajectories projected onto the first two eigenvectors. Every fifth frame of the respective trajectories has been used in both projections. The x‐axis and y‐axis show the projection of the structures of the backbone atoms in the MD trajectories onto the essential space (planes) defined by eigenvectors 1 and 2. (A) The clouds coloured in yellow, green, blue and red display the monomer of hTLR2, hTLR1, hTLR2‐hTLR1 and hTLR2‐hTLR1‐Man4‐GPI trajectories, respectively. (B) The clouds coloured in yellow, green, blue and red display the mTLR2, mTLR6, mTLR2‐mTLR6 and mTLR2‐mTLR6‐ sn‐2 lyso GPI trajectories, respectively.
The protein domain motions were analyzed to identify the corresponding motion modes by the first two eigenvectors. The 0–15‐ns representative structures of both MD sets for the first two eigenvectors are shown in Fig. S9. As expected, the monomer of the TLRs showed large movements in the C‐terminal region, as found in our RMSF results (Fig. 8). The C‐terminal regions are responsible for interacting with other molecules because there were large conformational motion differences for the monomer compared to the dimer (ligand‐bound form). These results are consistent with our RMSF results in that the C‐terminal regions of TLR2 dimers fluctuated when they are bound to ligand, whereas the TLR2 dimeric complexes without ligand showed even higher fluctuations in their C‐terminal regions (Fig. 8). Furthermore, there were notable motions observed in the loops in and around the ligand‐binding regions. The projection of eigenvectors 1 and 2 displayed a pivotal movement of loop regions, which distorted and exposed the basic concave surface of the TLR2 subfamily. The hTLR2 has a large concave cavity compared to that of mTLR2 because its loop regions have more predominant motions than mTLR2. As can be seen in Fig. S6, the difference in motions of the LRR10 loop region of all forms of hTLR2 (hTLR2 as monomer, Man4‐GPI‐unbound hTLR2 dimer with hTLR1, and Man4‐GPI‐bound hTLR2 dimer with hTLR1) suggest that, during the MD simulations, the monomer of the hTLR2 loop region comes forward to accommodate the ligand to induce dimerization. Alternatively, Man4‐GPI‐bound hTLR2 showed that the LRR11 loop region was slightly extended. More fluctuations could be seen in LRR 9–11 loop regions for hTLR2 and loops in the LRR11 for hTLR1. In the case of the monomeric form of mTLR2, motion of ligand‐binding loop regions was observed; however, the ligand‐bound dimer of mTLR2 revealed that fluctuations in the LRR 9–11 loop region were completely stabilized by their interaction with ligand. In particular, mTLR6 showed large motions in their ligand‐binding loop regions located in and around the LRR11 loop, which is known to interact with lipopeptides. The monomer of mTLR6 showed large motions in ligand‐binding loop regions, whereas the dimer with ligand showed less motion. The dimer of ligand‐unbound mTLR6 showed no different motions in their ligand‐binding loop regions and looked similar to monomer. The motions in the loop regions of monomeric mTLR6 indicate that they provide space for ligands to bind with mTLR2. Subsequently, when mTLR6 interacts with ligand through dimerization with mTLR2, the loop regions were relatively fixed. Overall, all of these results showed that the transition of monomer involved bending motions of loops in the ligand‐binding regions, particularly in the LRR 9–11 modules. The observed changes in PCA are consistent with the RMSF analysis (Fig. 8), indicating that the loop regions in the ligand‐binding central domain of TLR2 undergo high fluctuations in the absence of ligand molecules to induce the dimerization with their subfamily members.
The aim of the present study was to determine the binding region of P. falciparum malarial GPIs in the TLR2 subfamily, as well as to understand the ligand‐induced dimerization mechanism at the atomic level. In the present study, molecular docking, MD simulations and PCA were employed to investigate the interaction between malarial GPIs and TLR2 subfamily members. Conformational changes and interactions at their interfaces were analyzed. PCA suggested that the activation loops located in the central region of the TLR2 subfamily were more flexible and displayed significant changes upon ligand binding. After the binding of malarial GPIs, the N‐ and C‐terminal domains of TLR2 displayed a constrained conformation and the wiggling motion was localized to the activation loops. Binding affinity calculations indicated that hydrogen‐bonding interactions played a key role between the TLR2 subfamily and malarial GPIs, similar to lipopeptides. The identified key residues for binding of TLR2 subfamily members to malarial GPIs correlated with previous mutational and crystallography studies. The results obtained in the present study could provide new insights into understanding and regulating the interaction between the TLR2 subfamily and malarial GPIs.
Materials and methods
Protein and ligand structure preparation
Plasmodium falciparum Man4‐GPI and the sn‐2 lyso GPI derivative were selected for molecular docking with TLR2‐TLR1 and TLR2‐TLR6, respectively. The crystal coordinates of hTLR2‐hTLR1–Pam3CSK4 (Protein Data Bank code: 2Z7X) and mTLR2‐mTLR6–Pam2CSK4 (Protein Data Bank code: 3A79) were used as the receptors after the ligands were removed using moe, version 2011.10 45. The two‐dimensional format of P. falciparum Man4‐GPI and sn‐2 lyso GPI was drawn using chembiodraw ultra, version 12.0 (Cambridgesoft, Cambridge, MA, USA) and converted into the three‐dimensional format by moe. The flexible alignment module in moe was used to align the structure of Man4‐GPI to make it structurally similar to Pam3CSK4 and to make sn‐2 lyso GPI structurally similar to Pam2CSK4, facilitating the accommodation of Man4‐GPI and sn‐2 lyso GPI into the same ligand‐binding pockets of Pam3CSK4 and Pam2CSK4, respectively.
Molecular docking
The docking software gold, version 5.1 46, from moe, version 2011.10, and Molegro virtual docker (mvd) software 47 were used, with Pam3CSK4 and Pam2CSK4 being used as reference ligands. gold uses a genetic algorithm for docking, and we selected the gold scoring function for the present study. mvd software uses an evolution algorithm and a piecewise linear potential scoring function. Before docking, the water molecules were removed to neutralize the receptor, ligands were protonated and partial charges were added by applying the MMFF94X forcefield 48 in moe. The flexible small molecules Man4‐GPI and sn‐2 lyso GPI were docked into the binding sites of the macromolecules hTLR2‐hTLR1 and mTLR2‐mTLR6, respectively. Receptor coordinates of the crystal structure of hTLR2‐hTLR1–Pam3CSK4 and mTLR2‐mTLR6–Pam2CSK4 complexes 17 were used to define the binding sites of Man4‐GPI and sn‐2 lyso GPI for docking simulations. The ligand binding sites were defined to detect the cavity within a sphere of 15‐Å radius around the coordinates of the ligands in the hTLR2‐hTLR1–Pam3CSK4 and mTLR2‐mTLR6–Pam2CSK4 complexes. The top ten docked conformations were saved among the 100 poses. Molecular interactions were observed via moe and poseview 49. We used x‐score 37 to assess the binding affinity of the ligands. Images were generated using moe, chembiodraw, vmd 50 and chimera 51.
MD simulations
The structures of hTLR2, hTLR1, mTLR2, mTLR6, hTLR2‐hTLR1, mTLR2‐mTLR6 and hTLR2‐hTLR1–Pam3CSK4 in combination with docking studies were used to generate the hTLR2‐hTLR1–Man4‐GPI and mTLR2‐mTLR6–sn‐2 lyso GPI complexes, which were subjected to 15 ns of MD simulations with yasara dynamics 52 using the amber03 force field 53. Each protein was solvated in the centre of a cubic box with explicit 53 simple point charge water molecules, and periodic boundary conditions were applied in all directions. To replace the water molecules, appropriate Na+ or Cl− counterions were used to neutralize each macromolecular system. The structures were energy minimized to remove bumps and fix the covalent geometry. In each step, energy minimization was performed by the steepest descent method in yasara dynamics. The simulations were performed at a constant temperature (300 °K) and pressure (1 bar) using the Berendsen coupling approach. For all simulations, a 2‐fs time step and 9‐Å nonbonded cut‐off were used. The particle mesh Ewald method was used to treat long‐range electrostatics, and bond lengths involving bonds to hydrogen atoms were constrained using the SHAKE algorithm 54. An additional 500‐ps simulation and 15‐ns production run were performed with snapshots collected every 5 ps. The RMSD and RMSF were calculated using gromacs 55.
PCA
PCA was used to examine the most substantial protein motions related to ligand binding 56. PCA allows the magnitude of a complicated protein system to be decreased, thus segregating the commanding modes of internal flux. The PCA of protein motions are computed as the eigenvectors of the mass‐weighted covariance matrix of the backbone atom's rearrangement. Protein coordinates of the TLRs were extracted from each time frame of the 5‐ps MD trajectories for the protein complexes that were unbound and bound to GPIs. The g_covar gromacs tool was used to calculate and diagonalize the covariance matrix of backbone atoms to yield the eigenvalues and eigenvectors. The g_anaeig gromacs tool was used to analyze and plot the eigenvectors to determine their dominant portion in protein motion.
Supplementary Material
Fig. S1. The two‐dimensional structure of Plasmodium falciparum Man4‐GPI.
Fig. S2. The interaction of ligands with triacyl lipid chains.
Fig. S3. The interaction of ligands with diacyl lipid chains.
Fig. S4. RMSD Plot of ligand‐bound and ligand‐unbound complexes including control.
Fig. S5. The distances of liganded and unliganded differences for monomers were calculated before and after MD simulations.
Fig. S6. RMSF Plots of ligand‐bound and ligand‐unbound complexes including control.
Fig. S7. The eigenvalues for first ten eigenvectors.
Fig. S8. The mode and direction of the TLR2 subfamily.
Fig. S9. The motion modes of representative structures of first two eigenvectors.
Table S1. The distances of significant ligand binding regions in TLR2 subfamily monomers before and after MD simulations.
Acknowledgements
This work was supported by the Mid‐Career Researcher Program through the National Research Foundation of Korea, funded by the Ministry of Education, Science and Technology (2012R1A2A2A02016803). This work was also partly supported by a grant from the Priority Research Centers Program (NRF 2012‐0006687).
References
- 1.Sachs J & Malaney P (2002) The economic and social burden of malaria. Nature 415, 680–685 [DOI] [PubMed] [Google Scholar]
- 2.Organization WH (2011) World Malaria Report 2011 summary. World Malaria Rep 2011, 9–13 [Google Scholar]
- 3.Gomes AP, Vitorino RR, Costa ADP, Mendonça EGD, Oliveira MGDA & Siqueira‐Batista R (2011) Severe Plasmodium falciparum malaria. Rev Bras Ter Intensiva 23, 358–369 [DOI] [PubMed] [Google Scholar]
- 4.Coban C, Ishii KJ, Horii T & Akira S (2007) Manipulation of host innate immune responses by the malaria parasite. Trends Microbiol 15, 271–278 [DOI] [PubMed] [Google Scholar]
- 5.Stevenson MM & Riley EM (2004) Innate immunity to malaria. Nat Rev Immunol 4, 169–180 [DOI] [PubMed] [Google Scholar]
- 6.Gowda DC (2007) TLR‐mediated cell signaling by malaria GPIs. Trends Parasitol 23, 596–604 [DOI] [PubMed] [Google Scholar]
- 7.Schofield L & Grau GE (2005) Immunological processes in malaria pathogenesis. Nat Rev Immunol 5, 722–735 [DOI] [PubMed] [Google Scholar]
- 8.Akira S, Uematsu S & Takeuchi O (2006) Pathogen recognition and innate immunity. Cell 124, 783–801 [DOI] [PubMed] [Google Scholar]
- 9.Gazzinelli RT & Denkers EY (2006) Protozoan encounters with Toll‐like receptor signalling pathways: implications for host parasitism. Nat Rev Immunol 6, 895–906 [DOI] [PubMed] [Google Scholar]
- 10.Tsai YH, Liu X & Seeberger PH (2012) Chemical biology of glycosylphosphatidylinositol anchors. Angew Chem Int Ed Engl 51, 11438–11456 [DOI] [PubMed] [Google Scholar]
- 11.Naik RS, Branch OH, Woods AS, Vijaykumar M, Perkins DJ, Nahlen BL, Lal AA, Cotter RJ, Costello CE, Ockenhouse CFet al (2000) Glycosylphosphatidylinositol anchors of Plasmodium falciparum: molecular characterization and naturally elicited antibody response that may provide immunity to malaria pathogenesis. J Exp Med 192, 1563–1576 [DOI] [PMC free article] [PubMed] [Google Scholar]
- 12.Channe Gowda D (2002) Structure and activity of glycosylphosphatidylinositol anchors of Plasmodium falciparum. Microbes Infect 4, 983–990 [DOI] [PubMed] [Google Scholar]
- 13.Kawai T & Akira S (2010) The role of pattern‐recognition receptors in innate immunity: update on Toll‐like receptors. Nat Immunol 11, 373–384 [DOI] [PubMed] [Google Scholar]
- 14.Roach JC, Glusman G, Rowen L, Kaur A, Purcell MK, Smith KD, Hood LE & Aderem A (2005) The evolution of vertebrate Toll‐like receptors. Proc Natl Acad Sci USA 102, 9577–9582 [DOI] [PMC free article] [PubMed] [Google Scholar]
- 15.Govindaraj RG, Manavalan B, Basith S & Choi S (2011) Comparative analysis of species‐specific ligand recognition in Toll‐like receptor 8 signaling: a hypothesis. PLoS One 6, e25118. [DOI] [PMC free article] [PubMed] [Google Scholar]
- 16.Jin MS & Lee JO (2008) Structures of the toll‐like receptor family and its ligand complexes. Immunity 29, 182–191 [DOI] [PubMed] [Google Scholar]
- 17.Jin MS, Kim SE, Heo JY, Lee ME, Kim HM, Paik SG, Lee H & Lee JO (2007) Crystal structure of the TLR1‐TLR2 heterodimer induced by binding of a tri‐acylated lipopeptide. Cell 130, 1071–1082 [DOI] [PubMed] [Google Scholar]
- 18.Kang JY, Nan X, Jin MS, Youn SJ, Ryu YH, Mah S, Han SH, Lee H, Paik SG & Lee JO (2009) Recognition of lipopeptide patterns by Toll‐like receptor 2‐Toll‐like receptor 6 heterodimer. Immunity 31, 873–884 [DOI] [PubMed] [Google Scholar]
- 19.Liu L, Botos I, Wang Y, Leonard JN, Shiloach J, Segal DM & Davies DR (2008) Structural basis of toll‐like receptor 3 signaling with double‐stranded RNA. Science 320, 379–381 [DOI] [PMC free article] [PubMed] [Google Scholar]
- 20.Park BS, Song DH, Kim HM, Choi BS, Lee H & Lee JO (2009) The structural basis of lipopolysaccharide recognition by the TLR4‐MD‐2 complex. Nature 458, 1191–1195 [DOI] [PubMed] [Google Scholar]
- 21.Yoon SI, Kurnasov O, Natarajan V, Hong M, Gudkov AV, Osterman AL & Wilson IA (2012) Structural basis of TLR5‐flagellin recognition and signaling. Science 335, 859–864 [DOI] [PMC free article] [PubMed] [Google Scholar]
- 22.Manavalan B, Basith S & Choi S (2011) Similar structures but different roles – an updated perspective on TLR structures. Front Physiol 2, 41. [DOI] [PMC free article] [PubMed] [Google Scholar]
- 23.Ishii KJ, Koyama S, Nakagawa A, Coban C & Akira S (2008) Host innate immune receptors and beyond: making sense of microbial infections. Cell Host Microbe 3, 352–363 [DOI] [PubMed] [Google Scholar]
- 24.Takeda K, Takeuchi O & Akira S (2002) Recognition of lipopeptides by Toll‐like receptors. J Endotoxin Res 8, 459–463 [DOI] [PubMed] [Google Scholar]
- 25.Oliveira‐Nascimento L, Massari P & Wetzler LM (2012) The role of TLR2 in infection and immunity. Front Immunol 3, 79. [DOI] [PMC free article] [PubMed] [Google Scholar]
- 26.Anwar MA, Basith S & Choi S (2013) Negative regulatory approaches to the attenuation of Toll‐like receptor signaling. Exp Mol Med 45, e11. [DOI] [PMC free article] [PubMed] [Google Scholar]
- 27.Basith S, Manavalan B, Yoo TH, Kim SG & Choi S (2012) Roles of toll‐like receptors in cancer: a double‐edged sword for defense and offense. Arch Pharm Res 35, 1297–1316 [DOI] [PubMed] [Google Scholar]
- 28.Govindaraj RG, Manavalan B, Lee G & Choi S (2010) Molecular modeling‐based evaluation of hTLR10 and identification of potential ligands in Toll‐like receptor signaling. PLoS One 5, e12713. [DOI] [PMC free article] [PubMed] [Google Scholar]
- 29.Ropert C, Franklin BS & Gazzinelli RT (2008) Role of TLRs/MyD88 in host resistance and pathogenesis during protozoan infection: lessons from malaria. Semin Immunopathol 30, 41–51 [DOI] [PubMed] [Google Scholar]
- 30.Krishnegowda G, Hajjar AM, Zhu J, Douglass EJ, Uematsu S, Akira S, Woods AS & Gowda DC (2005) Induction of proinflammatory responses in macrophages by the glycosylphosphatidylinositols of Plasmodium falciparum: cell signaling receptors, glycosylphosphatidylinositol (GPI) structural requirement, and regulation of GPI activity. J Biol Chem 280, 8606–8616 [DOI] [PMC free article] [PubMed] [Google Scholar]
- 31.Zhu J, Krishnegowda G, Li G & Gowda DC (2011) Proinflammatory responses by glycosylphosphatidylinositols (GPIs) of Plasmodium falciparum are mainly mediated through the recognition of TLR2/TLR1. Exp Parasitol 128, 205–211 [DOI] [PMC free article] [PubMed] [Google Scholar]
- 32.Plewczynski D, Łaźniewski M, Augustyniak R & Ginalski K (2011) Can we trust docking results? Evaluation of seven commonly used programs on PDBbind database. J Comput Chem 32, 742–755 [DOI] [PubMed] [Google Scholar]
- 33.Karplus M & McCammon JA (2002) Molecular dynamics simulations of biomolecules. Nat Struct Biol 9, 646–652 [DOI] [PubMed] [Google Scholar]
- 34.Botos I, Segal DM & Davies DR (2011) The structural biology of Toll‐like receptors. Structure 19, 447–459 [DOI] [PMC free article] [PubMed] [Google Scholar]
- 35.Kajava AV & Vasselon T (2010) A network of hydrogen bonds on the surface of TLR2 controls ligand positioning and cell signaling. J Biol Chem 285, 6227–6234 [DOI] [PMC free article] [PubMed] [Google Scholar]
- 36.Guan Y, Omueti‐Ayoade K, Mutha SK, Hergenrother PJ & Tapping RI (2010) Identification of novel synthetic toll‐like receptor 2 agonists by high throughput screening. J Biol Chem 285, 23755–23762 [DOI] [PMC free article] [PubMed] [Google Scholar]
- 37.Wang R, Lai L & Wang S (2002) Further development and validation of empirical scoring functions for structure‐based binding affinity prediction. J Comput Aided Mol Des 16, 11–26 [DOI] [PubMed] [Google Scholar]
- 38.Buwitt‐Beckmann U, Heine H, Wiesmuller KH, Jung G, Brock R, Akira S & Ulmer AJ (2006) TLR1‐ and TLR6‐independent recognition of bacterial lipopeptides. J Biol Chem 281, 9049–9057 [DOI] [PubMed] [Google Scholar]
- 39.Garate JA & Oostenbrink C (2013) Lipid A from lipopolysaccharide recognition: structure, dynamics and cooperativity by molecular dynamics simulations. Proteins 81, 658–674 [DOI] [PubMed] [Google Scholar]
- 40.Kubarenko A, Frank M & Weber AN (2007) Structure–function relationships of Toll‐like receptor domains through homology modelling and molecular dynamics. Biochem Soc Trans 35, 1515–1518 [DOI] [PubMed] [Google Scholar]
- 41.Latz E, Verma A, Visintin A, Gong M, Sirois CM, Klein DC, Monks BG, McKnight CJ, Lamphier MS, Duprex WPet al (2007) Ligand‐induced conformational changes allosterically activate Toll‐like receptor 9. Nat Immunol 8, 772–779 [DOI] [PubMed] [Google Scholar]
- 42.Li Y, Efferson CL, Ramesh R, Peoples GE, Hwu P & Ioannides CG (2011) A peptidoglycan monomer with the glutamine to serine change and basic peptides bind in silico to TLR‐2 (403–455). Cancer Immunol Immunother 60, 515–524 [DOI] [PMC free article] [PubMed] [Google Scholar]
- 43.Nair S, Ramaswamy PA, Ghosh S, Joshi DC, Pathak N, Siddiqui I, Sharma P, Hasnain SE, Mande SC & Mukhopadhyay S (2009) The PPE18 of Mycobacterium tuberculosis interacts with TLR2 and activates IL‐10 induction in macrophage. J Immunol 183, 6269–6281 [DOI] [PubMed] [Google Scholar]
- 44.Liang S, Hosur KB, Lu S, Nawar HF, Weber BR, Tapping RI, Connell TD & Hajishengallis G (2009) Mapping of a microbial protein domain involved in binding and activation of the TLR2/TLR1 heterodimer. J Immunol 182, 2978–2985 [DOI] [PMC free article] [PubMed] [Google Scholar]
- 45.Chemical Computing Group Inc. (2011) Molecular Operating Environment (MOE), Version 2011.10. Chemical Computing Group Inc., Montreal, QC, Canada [Google Scholar]
- 46.Verdonk ML, Cole JC, Hartshorn MJ, Murray CW & Taylor RD (2003) Improved protein–ligand docking using GOLD. Proteins 52, 609–623 [DOI] [PubMed] [Google Scholar]
- 47.Thomsen R & Christensen MH (2006) MolDock: a new technique for high‐accuracy molecular docking. J Med Chem 49, 3315–3321 [DOI] [PubMed] [Google Scholar]
- 48.Cheng A, Best SA, Merz KM Jr & Reynolds CH (2000) GB/SA water model for the Merck molecular force field (MMFF). J Mol Graph Model 18, 273–282 [DOI] [PubMed] [Google Scholar]
- 49.Stierand K & Rarey M (2010) Drawing the PDB: protein−ligand complexes in two dimensions. ACS Med Chem Lett 1, 540–545 [DOI] [PMC free article] [PubMed] [Google Scholar]
- 50.Humphrey W, Dalke A & Schulten K (1996) VMD: visual molecular dynamics. J Mol Graph 14, 27–38 [DOI] [PubMed] [Google Scholar]
- 51.Pettersen EF, Goddard TD, Huang CC, Couch GS, Greenblatt DM, Meng EC & Ferrin TE (2004) UCSF Chimera – a visualization system for exploratory research and analysis. J Comput Chem 25, 1605–1612 [DOI] [PubMed] [Google Scholar]
- 52.Krieger E, Darden T, Nabuurs SB, Finkelstein A & Vriend G (2004) Making optimal use of empirical energy functions: force‐field parameterization in crystal space. Proteins 57, 678–683 [DOI] [PubMed] [Google Scholar]
- 53.Ponder JW & Case DA (2003) Force fields for protein simulations. Adv Protein Chem 66, 27–85 [DOI] [PubMed] [Google Scholar]
- 54.Kräutler V, van Gunsteren WF & Hünenberger PH (2001) A fast SHAKE algorithm to solve distance constraint equations for small molecules in molecular dynamics simulations. J Comput Chem 22, 501–508 [Google Scholar]
- 55.Van Der Spoel D, Lindahl E, Hess B, Groenhof G, Mark AE & Berendsen HJ (2005) GROMACS: fast, flexible, and free. J Comput Chem 26, 1701–1718 [DOI] [PubMed] [Google Scholar]
- 56.Amadei A, Linssen AB & Berendsen HJ (1993) Essential dynamics of proteins. Proteins 17, 412–425 [DOI] [PubMed] [Google Scholar]
Associated Data
This section collects any data citations, data availability statements, or supplementary materials included in this article.
Supplementary Materials
Fig. S1. The two‐dimensional structure of Plasmodium falciparum Man4‐GPI.
Fig. S2. The interaction of ligands with triacyl lipid chains.
Fig. S3. The interaction of ligands with diacyl lipid chains.
Fig. S4. RMSD Plot of ligand‐bound and ligand‐unbound complexes including control.
Fig. S5. The distances of liganded and unliganded differences for monomers were calculated before and after MD simulations.
Fig. S6. RMSF Plots of ligand‐bound and ligand‐unbound complexes including control.
Fig. S7. The eigenvalues for first ten eigenvectors.
Fig. S8. The mode and direction of the TLR2 subfamily.
Fig. S9. The motion modes of representative structures of first two eigenvectors.
Table S1. The distances of significant ligand binding regions in TLR2 subfamily monomers before and after MD simulations.