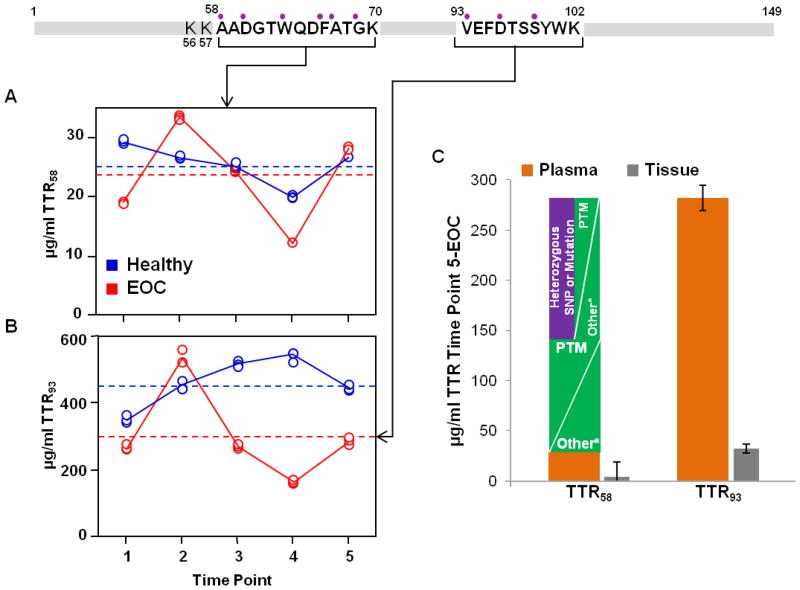
Figure 3.
Absolute quantification for TTR based on two different signature peptides (A) and (B). A clear trend is not realized. The EOC bird follows a similar fluctuation in protein concentration using the two peptides; however, when considering the 5th time point for example, a difference in protein concentration of approximately 10x is exhibited. The dashed lines indicate the average protein concentration derived by each peptide for the Healthy and EOC birds over the longitudinal samples. A plot of the absolute protein concentration for TTR with each peptide for plasma time point 5 (orange) and the ovary tissue (grey) samples (C) includes potential explanations for this concentration discrepancy and comparison to TTR quantified in the tissue. The purple circles above residues in the signature peptides indicate the positions of known variants in human TTR leading to mutation.

