Abstract
Three-dimensional (3D) tumor models have been established in various microfluidic systems for drug delivery and resistance studies in vitro. However, one of the main drawbacks of these models is non-uniform distribution of cells, leaving regions with very low cell density within the 3D structures. As a result, molecular diffusion in the cell compartments is faster than that observed in solid tumors. To solve this problem, we developed a new technique for preparation of 3D tumor models in vitro. It was based on a microfluidic device containing three parallel channels separated by narrowly spaced posts. Tumor cells were loaded into the central channel at high density. To test the system, B16.F10 melanoma cells were perfusion-cultured overnight and the resulting 3D structure was characterized in terms of viability, density, and morphology of cells as well as transport properties of small fluorescent molecules. Immediately upon loading of tumor cells, the cell density was comparable to those observed in B16.F10 tumor tissues in vivo; and the viability of tumor cells was maintained through the overnight culture. The tumor model displayed low extracellular space and high resistance to diffusion of small molecules. For membrane-permeant molecules (e.g., Hoechst 33342), the rate of interstitial penetration was extremely slow, compared to membrane-impermeant molecules (e.g., sodium fluorescein). This versatile tumor model could be applied to in vitro studies of transport and cellular uptake of drugs and genes.
Keywords: in vitro tumor models, multicellular structures, microfluidics, drug transport
Introduction
Three-dimensional (3D) tumor models are invaluable tools for the study of disease mechanisms and drug efficacy. One of the main advantages of 3D models is that they can provide structural barriers observed in solid tumors, which block interstitial penetration and reduce cellular uptake of drugs. The limited drug delivery into tumor cells has been considered to be a leading cause for incomplete response of solid tumors to chemotherapy (Grantab et al., 2006; Jain, 1997, 1998; Wang and Yuan, 2006; Yuan, 2011).
Most 3D tumor models are based upon spheroidal (Durand, 1990; Hsiao et al., 2009; Sutherland and Durand, 1976, 1984), or multicellular layer (MCL) (Grantab et al., 2006; Hicks et al., 1998), arrangements of cells. Although these models have been widely used in investigation of multidrug resistance (Francia et al., 2005; Kobayashi et al., 1993) and drug delivery (Cowan et al., 1996; Cowan and Tannock, 2001; Grantab et al., 2006; Hicks et al., 1997, 2003; Tannock et al., 2002), or utilized for drug screening (Bartholoma et al., 2005; Kunz-Schughart et al., 2004), each of these models has certain limitations. The spheroid, originating from a single cell or small aggregates of cells, can grow to a multicellular structure with a diameter of several hundred microns (Freyer and Sutherland, 1980). However, it is difficult to precisely control size and geometry of spheroids, and it may not be feasible for some tumor cells to form spheroids. In drug delivery studies, it is hard to quantitatively determine interstitial transport of small, non-fluorescent drugs since spatial distributions of these molecules in spheroids are unknown. The MCL is formed by placing a layer of tumor cells on a collagen-coated microporous membrane and culturing them to form a multilayer several hundred microns thick (Cowan et al., 1996; Hicks et al., 1997; Tunggal et al., 1999). Contrary to the tumor spheroid, the MCL has a simple planar geometry, making it well-suited for quantitative analysis of drug penetration (Cowan et al., 1996; Hicks et al., 1998, 2003). It can be used to quantitatively investigate transport of non-fluorescent and unlabeled molecules. However, visualization of fluorescent drug distribution within the MCL or cellular responses to drug treatment often requires disruption of the culture for fixation and tissue sectioning, making this type of model unsuitable for real-time, in situ microscopic visualization of fluorescent drugs and cell markers. Similar to the spheroid, some tumor cells cannot grow to form uniform MCL with a thickness over 100 µm. The limitations of spheroid and MCL models mentioned above can be avoided by engineering 3D tumor tissues in microfluidic systems.
Current approaches to 3D culture of mammalian cells in microfluidic systems usually involve the use of hydrogels for cell trapping, embedment, or encapsulation to provide 3D structures (Bauer et al., 2010; Chen et al., 2010; Elliott and Yuan, 2011; Kim et al., 2007; Ng and Pun, 2008; Sung et al., 2011; Toh et al., 2005, 2007; Wlodkowic and Darzynkiewicz, 2010; Wong et al., 2008). However, the polymeric matrix used may prevent tumor cells from being densely packed in microfluidic channels, resulting in large pores in interstitial space that provide little resistance to small molecule delivery. As a result current microfluidic models cannot provide realistic predictions on efficacies of many chemotherapeutic agents although they may be excellent models for investigation of macromolecule or nanoparticle transport (Ng and Pun, 2008). To increase the cell density, a gel-free technique has been developed for creating 3D structures. It uses peptide cross-linkers to induce cell aggregation, and then the aggregates are loaded into a designated cell compartment (Ong et al., 2008). While this creative strategy circumvents the need for using hydrogels to build 3D cellular structures, the cross-linkers, which are attached to cells for several days before being degraded completely, may affect cell functions or induce adverse effects on cells. The main drawback of this gel-free technique is that the distribution of cells is dramatically heterogeneous in the culture compartment (Ong et al., 2008), with a large fraction of the compartment being occupied by cell culture medium. This fluid space can form least resistance pathways for drug transport that do not exist in solid tumors. In this regard, the gel-free model is also unsuitable for the study of small drug delivery.
To develop 3D structures that provide significant resistance to drug transport throughout entire region in tumor models, we developed a new microfluidic system, in which the cell density in the culture compartment was uniform and comparable to those observed in solid tumors in vivo. The new tumor model was characterized in terms of cell viability, density, and morphology as well as transport and cellular uptake of small fluorescent molecules. Results from the study indicated that the 3D in vitro tumor model was a promising platform for quantitative investigation of drug penetration in tumor tissues.
Materials and Methods
Microfluidic Device Fabrication
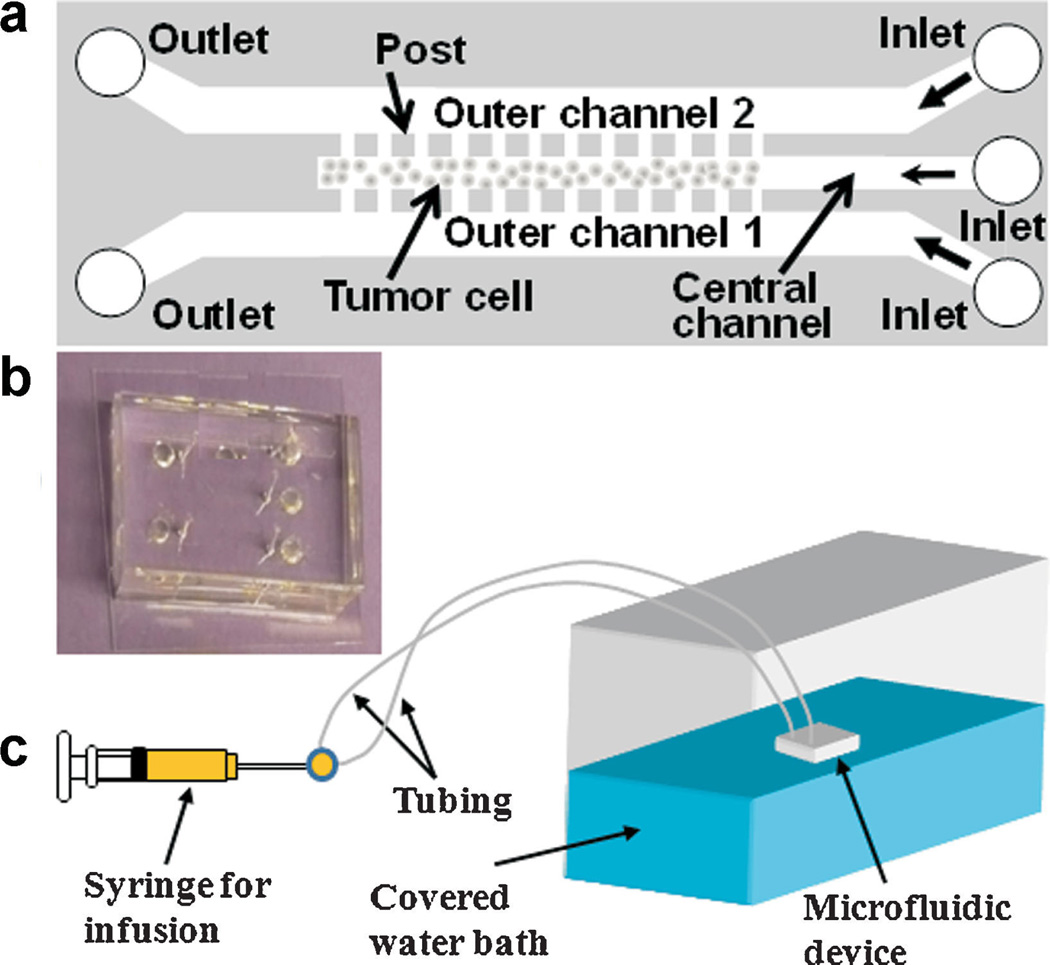
The schematic and the dimensions of the device are shown in Figure 1. The device was designed using AutoCAD and the pattern was transferred to a chrome mask. Standard photolithography techniques were used to prepare the silicon template with the negative photoresist SU-8 3035 on the silicon wafer (MicroChem Corp, Newton, MA). The thickness of SU-8 on the silicon wafer was verified after template preparation using NanoSpec 210 (Nanometrics, Milpitas, CA). The silicon template was then used for replica molding of poly(-dimethylsiloxane) (PDMS; Dow Corning USA, Midland, MI) to obtain microfluidic channels. After curing PDMS at 60°C for 1 h, inlets and outlets were cored using a 20G round punch (Technical Innovations, Angleton, TX). PDMS was then sterilized by submerging in 70% ethanol for 5 min, rinsing with sterile water, and allowing to air dry under a sterile hood. Devices were completed by bonding the PDMS replica to sterile glass coverslips and baking overnight at 100°C. It was found that oxygen plasma treatment was not necessary for sufficient bonding in this study. At inlets, ½-inch 23G stainless steel tubing was inserted and connected to 5-ml plastic syringes via standard 23G luer stubs and polyethylene tubing. In preparation for cell loading, sterilized devices were first vacuum-filled with phosphate-buffered saline (PBS; Cellgro, Mediatech Inc., Manassas, VA), to remove air from microfluidic channels. While still submerged in sterile PBS, a 1:1 (v/v) mixture of collagen type I from calf skin (C8919; Sigma–Aldrich, St. Louis, MO) and 100% ethanol was infused into each outer channel of the device, one channel at a time. Inlets and outlets for the channels not being infused were blocked to prevent the flow of the collagen mixture into the central channel. Once each outer channel was filled with the collagen solution, the entire device, submerged in PBS, was incubated at 37°C for 30 min.
Figure 1.
a: Schematic representation of microfluidic device design for 3D tumor model. The device consisted of three channels that were 0.25 cm in length and 30 µm in height. They were separated by an array of square posts, 50 µm (width) x 30 µm (height), and spaced 4 µm apart. The outer channels were 200 µm wide and the central channel for cell culture was 100 µm wide. b: A photo of the PDMS device. c: Overall setup of the perfusion system for tumor cell culture in the device. The water bath was maintained at 37°C. [Color figure can be seen in the online version of this article, available at http://wileyonlinelibrary.com/bit]
Cell Loading into Microfluidic Device
B16.F10 melanoma cells were cultured in high-glucose Dulbecco’s Modified Eagle Medium (DMEM) containing L-glutamine and sodium pyruvate and supplemented with 10% HyClone bovine growth serum (Thermo Scientific, Rockford, IL). The culture was maintained at 37°C, and 95% air and 5% CO2 (Elliott et al., 2011). Unless otherwise stated, all cell culture reagents were obtained from Gibco, Invitrogen (Grand Island, NY). Prior to cell loading into the microfluidic device, adherent tumor cells were trypsinized and re-suspended in serum-free DMEM at a concentration of 5–6 × 10⁶ cells/ml. In addition, the outer channels pre-treated with collagen were simultaneously infused with DMEM supplemented with 10% fetal bovine serum (Sigma–Aldrich) and 60 mM HEPES buffer at a rate of 0.05 ml/h for 5 min, using a syringe pump (Harvard Apparatus, Holliston, MA). The cell suspension was very gently infused by hand into the central channel, using a 1 ml syringe, to minimize the amount of cells that escaped into the outer channels through the gaps between the posts. Both outlets remained open to allow drainage of medium. During the loading process, the microchip was placed on an inverted microscope stage to ensure proper cell loading. Once the central channel was loaded with cells, the tubing connected to the channel was clamped to prevent backflow of cells toward the inlet and culture media was continually supplied in a one-pass perfusion manner via the outer channels at a flow rate of 0.07 ml/h. The entire device was floated in a 37°C water bath, which was covered for the duration of the overnight culture to prevent evaporation of media from within the device and formation of air bubbles.
Cell Packing Density Determination
Cell nuclei in the central channel were stained by infusing 4’,6-diamidino-2-phenylindole (DAPI; Molecular Probes, Invitrogen), into the outer channels at a concentration of 14 µM in serum-free DMEM for 20 min at a rate of 0.1 ml/h, while the central channel remained closed. After the infusion, the cells were incubated at room temperature for another 30 min to allow further penetration of the dye into the centermost part of the cell compartment. Using confocal microscopy (LSM 510, Zeiss, Thornwood, NY), stacked 2-µm optical slices of the stained nuclei were obtained at three randomly selected positions within the cell compartment. The experiment above was repeated three times, using different devices, for calculation of the average number of cells per unit volume. ImageJ software was used for cell counting.
Cell Viability Staining
B16.F10 cells were stained in situ by infusing DMEM containing CellTracker™ Green CMFDA (5 µM, Invitrogen, Eugene, OR) and propidium iodide (PI; 10 µM, Invitrogen) via the outer channels at 0.1 ml/h for 20 min at 37°C. Cells were immediately imaged by confocal microscopy (LSM 510, Zeiss). The number of dead (i.e., red) cells per unit volume was divided by the cell packing density determined above to estimate the fraction of dead cells, which was equal to unity minus cell viability.
Quantification of Sodium Fluorescein Distribution
The device was first loaded with B16.F10 cells alone as described above, or a mixture of B16.F10 cell suspension and collagen type I solution at 1:1 volume ratio. Then, the device was placed on the stage of an inverted microscope (Zeiss Axiovert 100 TV) to permit real-time fluorescence imaging. Sodium fluorescein (NaF) solution (0.1 mM in serum-free DMEM; Sigma, St. Louis, MO) was infused into one of the outer channels at 0.1 ml/h, and dye-free DMEM was infused into another outer channel at the same rate for 15 min. After the infusion, fluorescence images were taken at various positions along the entire length of the central channel. For each image, MATLAB software was used to determine the 2D distribution of fluorescence intensity. The intensity in the central channel (Ic) was observed to fluctuate randomly with location, presumably due to local heterogeneity in extracellular space distribution and noise in low-light measurement. Therefore, Ic within an image was averaged in the direction of channel length to obtain a mean intensity profile along the channel width (Imean). The mean intensity profile normalized by the intensity in the outer channel (Imax) was determined at four to fives different locations along the length of the central channel. The average and SD of Imean/Imax profiles are reported for each experimental group.
Mathematical Model of NaF Diffusion
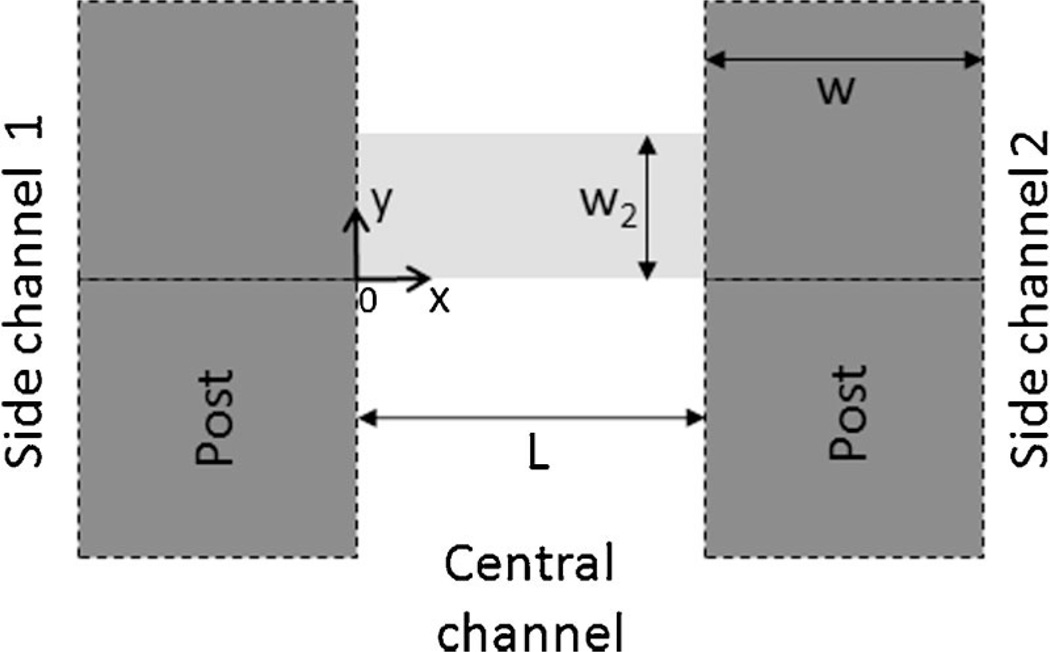
The diffusion of NaF in the central channel was assumed to be 2D and the distribution of NaF was assumed to be periodic along the length of the central channel except near the dead end and the inlet. Therefore, a unit region was defined in Figure 2 for diffusion simulation. It was rectangular in shape with x varying from 0 to L and y from 0 to w2, where L is the width of central channel, w2 = (b + w)/2, w is the width of posts, and b is the width of gaps between two adjacent posts. The model could be further simplified by assuming b/w2 being close to zero. Under these conditions, the governing equation and boundary conditions are:
where c is the concentration in the central channel, c0 is the concentration in the outer channel being perfused with NaF solution, x and y are spatial coordinates, t is time, ε is the fraction of tumor volume that is available for NaF diffusion (Krol et al., 1999, 2003), and D is the apparent diffusion coefficient that has included non-specific binding of NaF to cells and extracellular matrix (ECM) (Lin et al., 2007). The subscript “c” represents the central channel, “1” and “2” represent the gap regions connecting the central channel to the two outer channels being perfused with NaF solution and NaF-free medium, respectively. δ(y) is the Dirac delta function and ℓ is the length of cell plug observed in the gap that may vary between zero, that is, no cell in the gap region, and w when the entire region is occupied by cells. The value of ℓ may also vary among different gaps in a given device. For the specific microfluidic device used in this study, L = 100 µm, w = 50 µm, and b = 4 µm. The baseline values of other model constants were assumed to be as follows: ℓ = w/2, εc = 0.2, ε1 = ε2 = 0.8, D1 = D2 = 4× 10⁻⁶ cm2/s (Nugent and Jain, 1984), and Dc = D1/2. The equations listed above were solved numerically using a finite difference method.
Figure 2.
Model geometry. Molecular diffusion was considered in a unit region in the central channel of the microfluidic device. The region is shown by the light gray area. The dark grey squares represent the PDMS posts. The width of gap between two adjacent posts was assumed to be zero since it was one order of magnitude smaller than the post width. As a result, the gaps on two sides of the region were treated as point source and point sink, respectively.
Results and Discussion
Tumor Model Characterization
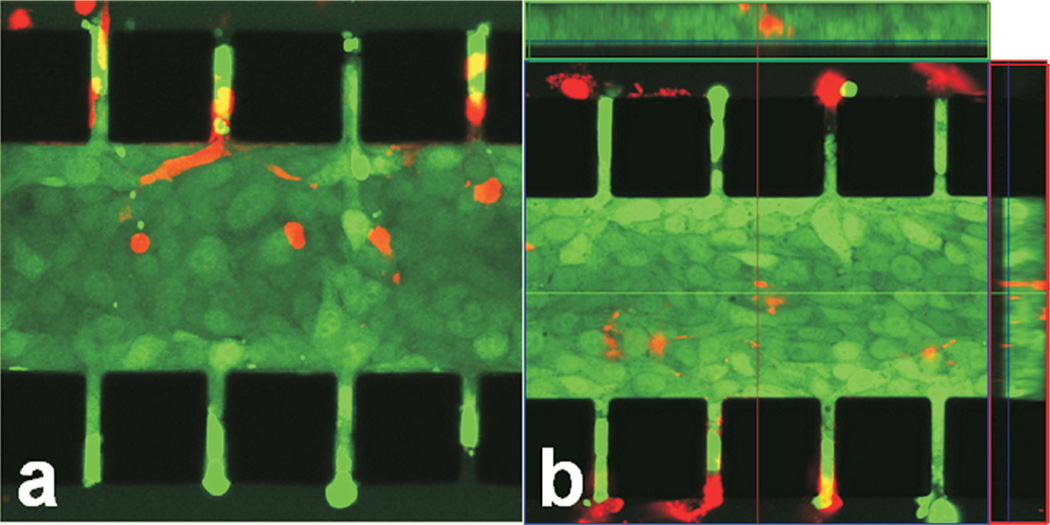
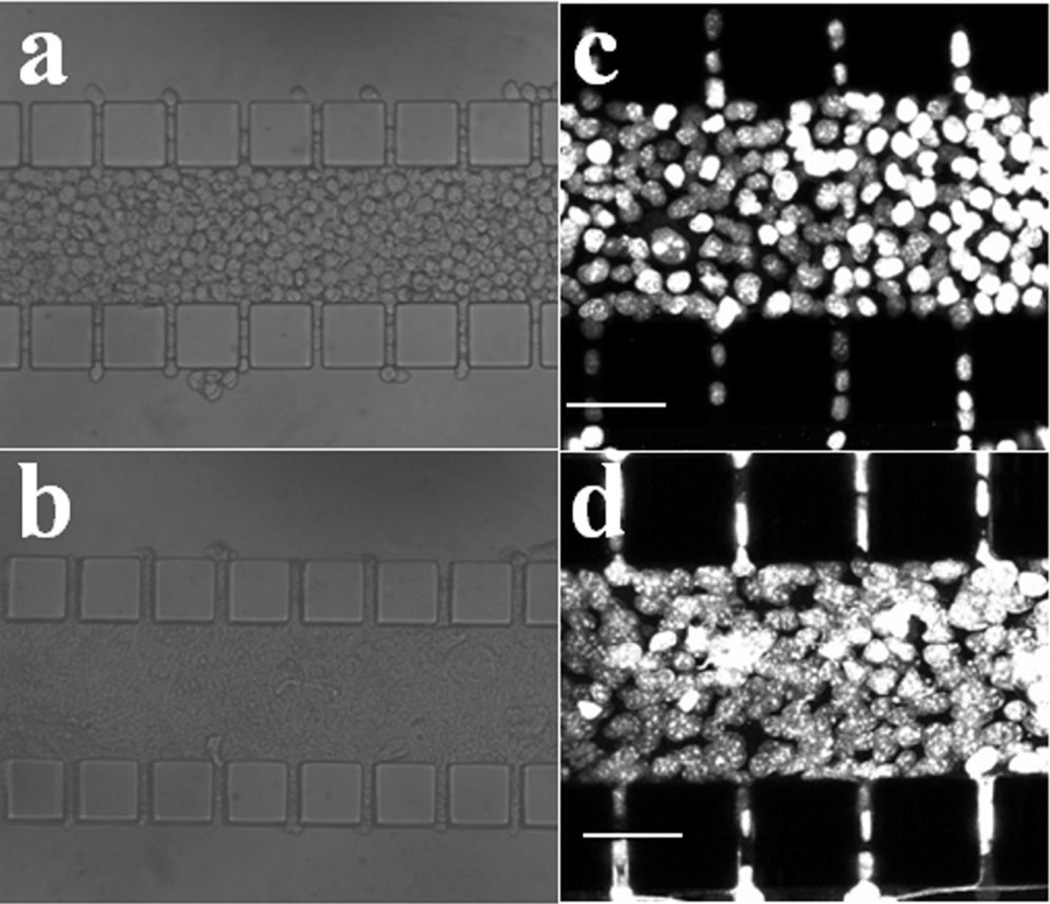
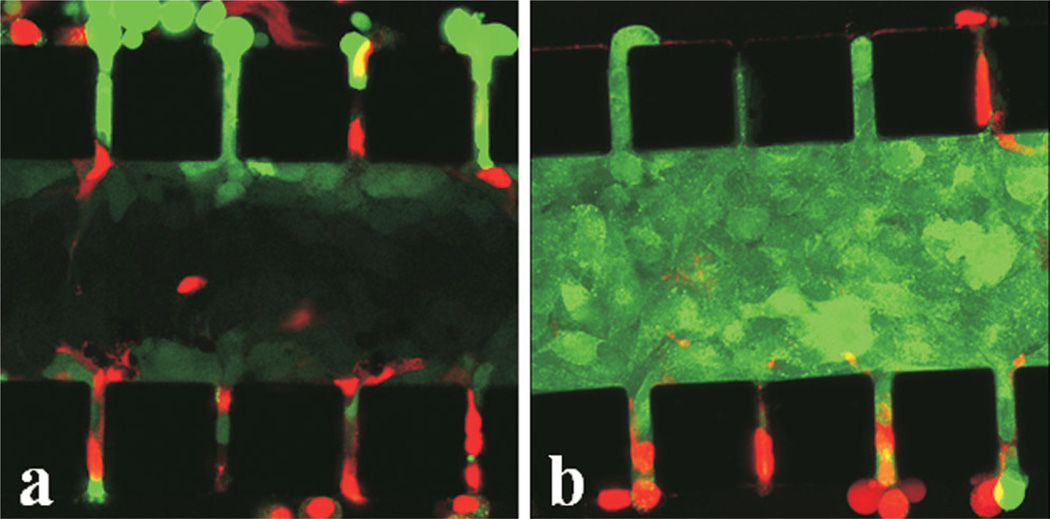
The tumor model was characterized, in terms of viability, density, and morphology of cells. More than 95% of tumor cells were viable after overnight (i.e., 12 h) culture, which could be observed in Figure 3a and b. For those dead cells, their locations were independent of the distance from the outer channels, indicating that the cell death was not caused by the lack of nutrient supply. Morphological changes of cells after overnight culture were compared in Figure 4a and b. Individual cells were clearly visible immediately after cell loading into the central channel but cell outlines became invisible at 12-h post cell loading, implying that the extracellular space was reduced significantly. To further investigate changes in cell morphology, we stained cell nuclei with DAPI. The images shown in Figure 4c and d demonstrated that the nuclei appeared to have elongated and enlarged after overnight culture. Quantitatively, the images of DAPI-stained cells were used to count the number of cells. Based the images in three trials, the mean and standard deviation of cell packing densities were 3.35 × 10⁻⁴ ± 0.73× 10⁻⁴ cells/µm3 in the central channel immediately after cell loading, and 2.78 × 10⁻⁴ ±0.16 × 10⁻⁴ cells/µm3 after overnight culture. These data were on the same order of magnitude as the cell densities observed in vivo (Mossop et al., 2006; Stephens and Peacock, 1978) (see Table I). In light of the slight reduction in the cell packing density and few dead cells, there did not appear to be any significant proliferation of cells during the 12-h culture period. Using the image of cells immediately after they were loaded into the central channel, the diameter of cells was measured. Its mean ±SD were 14.3 ± 1.5 µm (n = 41), suggesting that the average volume of a cell was 1,526 µm3 if the shape of cells was assumed to be spherical (Elliott et al., 2011). Therefore, the volume fraction of cells in the central channel was approximately 51% upon loading or the volume fraction of extracellular space was 49%, which was consistent with the in vivo data of solid tumors reported in the literature (Krol et al., 1999).
Figure 3.
B16.F10 cells in microfluidic device after 12 h culture. The tumor cells were stained with CellTracker™ Green CMFDA and PI (red). Stacked 2-µm optical slices obtained from two different locations of a microchip are shown in panels (a) and (b), respectively. Boxed panels at top and right in panel (b) show cross-sections of the captured region at the dissecting lines. The black squares are PDMS posts. [Color figure can be seen in the online version of this article, available at http://wileyonli-nelibrary.com/bit]
Figure 4.
Images of B16.F10 cells in microfluidic device taken immediately after loading (a,c) and at 12-h post cell loading (b,d). Panels (a) and (b) are images of cell compartment taken under a regular light microscope with trans-illumination; panels (c) and (d) show stacked 2-µm optical slices of the device containing tumor cells with their nuclei labeled with DAPI. These images were taken under a confocal microscope and used for counting cell numbers.
Table I.
Comparison of cell density in various tumor models.
| Tumor model | Cell line | Cell type | Cell packing density (cells/µm3) |
Growth period (days) |
Ref. |
|---|---|---|---|---|---|
| New 3D microfluidic-based tumor model | B16.F10 | Mouse melanoma | 3.35 × 10⁻⁴ ±0.73 × 10⁻⁴ | 0 | |
| 2.78 × 10⁻⁴ ±0.16 × 10⁻⁴ | 0.5 | This study | |||
| Spheroid model | EMT6/Ro | Mouse Mammary carcinoma | 1.7 × 10⁻⁴ | 4–7 | Freyer (1988) |
| MEL28 | Human melanoma | 1.2 × 10⁻⁴ | 4–7 | ||
| Multicellular layer model | HCT-8 | Human colon carcinoma | 0.79 × 10⁻⁴ | 5 | Grantab et al. (2006) |
| In vivo tumor | B16.F10 | The same as above | 5.69 × 10⁻⁴ | —a | Stephens and Peacock, (1978) |
| In vivo tumor | B16.F10 | The same as above | 1.94 × 10⁻⁴ | 7–10 | Mossop et al. (2006) |
| In vivo tumor | 4T1 | Mouse mammary carcinoma | 3.84 × 10⁻⁴ | 7–10 | Mossop et al. (2006) |
Cell density was quantified when tumor size reached approximately 0.1 g.
Another observation in our study was that when cells were just loaded into the central channel, they could easily be pushed out by altering the fluid pressure at the inlets of outer channels via removing and re-connecting the polyethylene tubing. After overnight culture, however, the cell dissociation due to the pressure alteration was rarely observed in the central channel.
Transport of Membrane-Impermeant Molecule
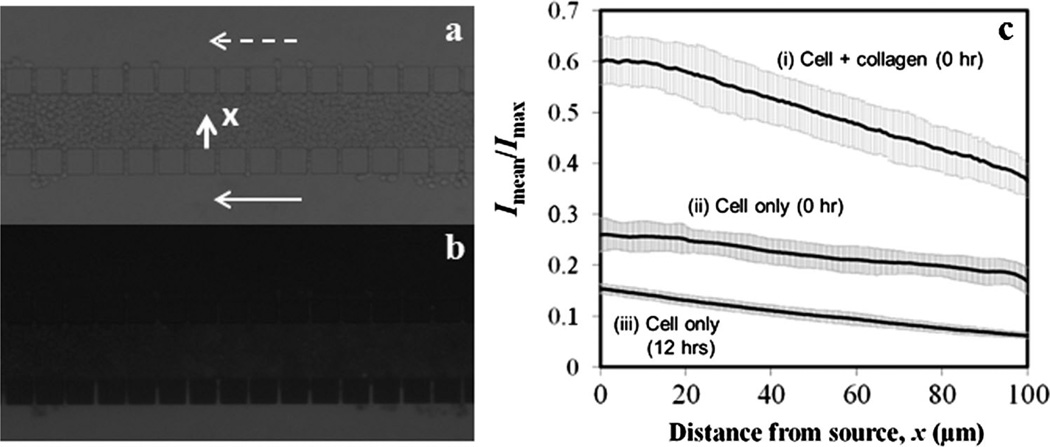
To further characterize the 3D tumor model for drug delivery studies, we investigated transport of a cell membrane-impermeant molecule, sodium fluorescein (NaF), across the central channel in three experimental groups, in which fluorescence intensity profiles of NaF in the central channel were measured at 0- or 12-h post cell loading, or immediately after a mixture of cells and collagen was loaded. In all experiments, microfluidic channels were imaged after the two outer channels were perfused for 15 min with NaF solution and NaF-free medium, respectively. Representative images under trans-illumination and epi-illumination are shown in Figure 5a and b, respectively. The average intensity profiles (Imean/Imax) are shown in Figure 5c. The profile at the top was the highest among the three curves, and slightly nonlinear near x = 0. In this experimental group, the cell density was the lowest because the collagen prevented cells from being densely packed, thereby increasing the extracellular space. The nonlinearity of the curve might be caused by convection (Shamloo et al., 2008). The middle and bottom profiles were approximately linear functions of x, suggesting that the dominant mode of NaF transport in these two groups was diffusion. The profiles also suggested that the extracellular space was reduced after overnight culture, which was caused presumably by cell body enlargement since the cell density was slightly reduced during the same period.
Figure 5.
Distribution of NaFin microfluidic channels. Panel (a) shows atypical image of microfluidic channels with cells in the central channel under trans-illumination.The same region under epi-illumination is shown in panel (b). Both images were taken after the lower channel was perfused continuously for 15 min with NaF solution and the upper channel was perfused with NaF-free medium for the same period. The image in panel (a) also shows the flow direction by arrows, and the origin and direction of x axis, which are the same as those defined in Figure 2. The average fluorescence intensity profiles for NaF in the central channels are shown in panel (c). They were obtained either immediately after loading of a mixture of collagen and cells (0 h), immediately after loading of cell suspension without collagen (0 h), or at 12 h after loading of cell suspension without collagen. Each data point represents the mean of the average intensity from four to five images taken at different locations along the length of the central channel. The error bar indicates standard deviation of data among these locations. The slopes of linear fitting of the data in curves i, ii, and iii were −2.5 × 10⁻³ µm−1, −0.85 × 10⁻³ µm−1, and −0.93 × 10⁻³ µm−1, respectively.
In addition to the intensity level, the slopes and the standard deviations (SD) of the intensity profiles also differed among the three experimental groups. The difference in the slope was likely to be related to the difference in relative resistance to diffusion between the cell compartment and the gaps that connected the central and outer channels (see discussion below). The SD was a measure of variation in Imean/Imax profiles along the length of the central channel. The largest SD was observed in the top curve shown in Figure 5c, which was presumably due to non-uniform mixing of cells with collagen before they were loaded into the central channel. When cells were loaded alone, SD was high initially (see the middle curve), due to heterogeneous distribution of extracellular fluid space, and then decreased significantly after overnight culture (see the bottom curve), because cell body enlargement would occur preferentially in the least resistance region where the extracellular fluid space was large. The experiments discussed above were repeated twice and similar intensity profiles were obtained, indicating that the results were reproducible.
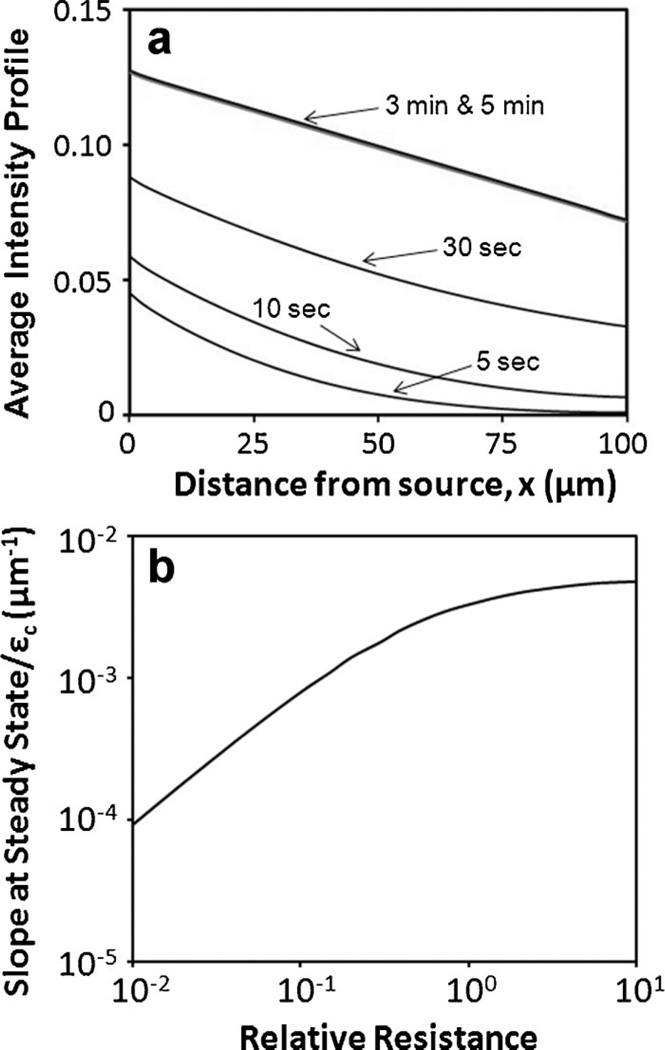
To understand which factors could influence the slope of concentration profiles shown in Figure 5c, we developed a mathematical model and used it to numerically simulate 2D diffusion of NaF in the tumor model. Results from the simulation indicated that the average concentration, which corresponded to Imean/Imax measured experimentally, increased with time and reached a steady state within 5 min because there was insignificant difference between the concentration profiles at 3 and 5 min, respectively (Fig. 6a). This model prediction was verified experimentally by comparing Imean/Imax profiles measured at 5 and 60 min, respectively. There was no difference between these profiles (data not shown). For a given dimension of microfluidic device, the mathematical model predicted that the 2D concentration profiles normalized by c0 and εc depended on x, t, and a dimensionless parameter, R, which is the relative resistance to diffusion between the central channel and the gaps, i.e.,
assuming that ε 1 = ε2 and D1 = D2. At steady state, the intensity profiles were predicted to be linear and the slope of the linear profile, normalized by εc, depended only on R. The predicted relationship is shown in Figure 6b. The baseline value of R was 0.64 for the slope to be 2.8 × 10⁻³ µm−1. The model also predicted that the slope was equal to εc/L or εc was equal to the product of slope and L. Using the slope data measured in this study (Fig. 5c), and L = 100 µm, the value of εc immediately after cell loading was calculated to be 0.42, which was close to the extracellular volume fraction based on the cell density measurement reported above. The difference was only 14% that might be due to errors in estimating single cell volume and the presence of isolated pores in the extracellular space within the central channel that were unavailable for NaF diffusion. At 12-h post cell loading, the value of εc was calculated to be 0.22, which was significantly smaller than its value immediately after cell loading. Most likely, this reduction in εc was caused by inadequate connection of the extracellular space between different regions in the central channel (Yuan et al., 2001). Using the slope data, the values of εc estimated above, and the curve shown in Fig. 6b, the values of R at 0 and 12-h post cell loading were estimated to be 0.354 and 2.66, respectively. The analysis above indicated that the overnight culture of tumor cells in the microfluidic device caused an increase in R by a factor of 7.5, in which a factor of 1.9 was due to the reduction in extracellular space (i.e., εc was decreased from 0.42 to 0.22) and at least a factor of 4.0 was due to a decrease in diffusion coefficient of NaF (i.e., Dc) in the cell compartment, because it was unlikely for ε1 and D1 to increase and ℓ to decrease during the overnight culture.
Figure 6.
Numerical simulation of average concentration profiles of NaF across the central channel. The time-dependent concentration profiles normalized by c0 were assumed to be the same as the average intensity profiles (Imean/Imax). They are plotted in panel (a) for different time points. The profiles at 3 and 5 min were approximately the same, suggesting that the profiles had reached a steady state at 5 min. The steady state profile could be compared to Imean/Imax measured experimentally. The slope of the steady state profile, normalized by εc, is shown in panel (b). It depended only on the resistance to NaF diffusion in the cell compartment relative to that in the gaps between posts.
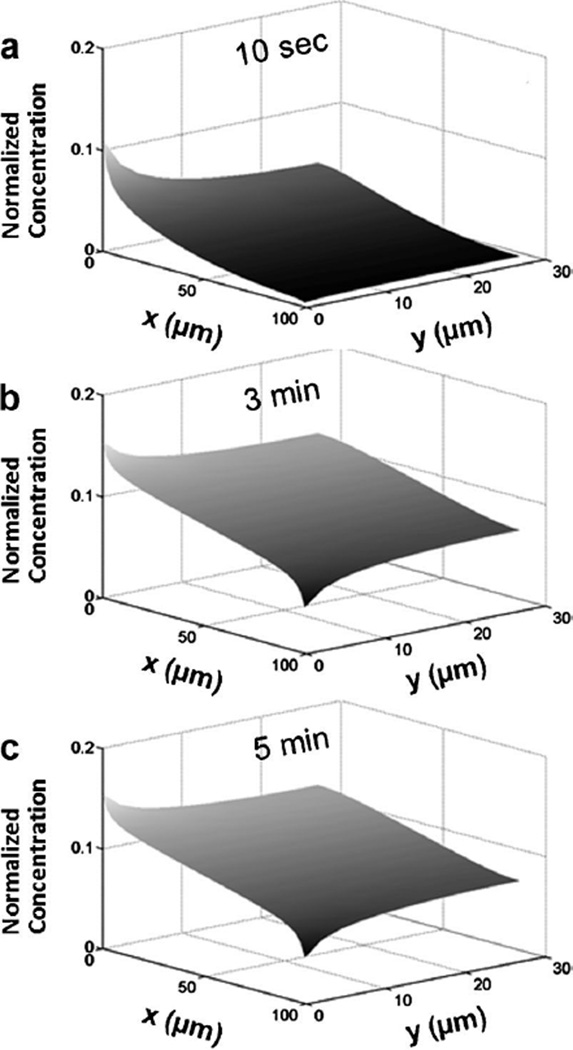
The 2D distributions of NaF in the central channel were also simulated in the study. The results at 10 s, 3 min, and 5 min are shown in Figure 7a–c, respectively. They were approximately uniform in the y direction for t ≥ 3 min except at locations near the gap regions where the concentration was the highest at x = 0 and the lowest at x = L.
Figure 7.
Two-dimensional concentration profiles of NaF in the central channel. The profiles were calculated at three time points: (a) 10 s, (b) 3 min, and (c) 5 min. There was a significant increase in concentration from 10 s to 3 min but minimal change in concentration distribution when the diffusion time was longer than 3 min.
Penetration of Membrane-Permeant Molecule
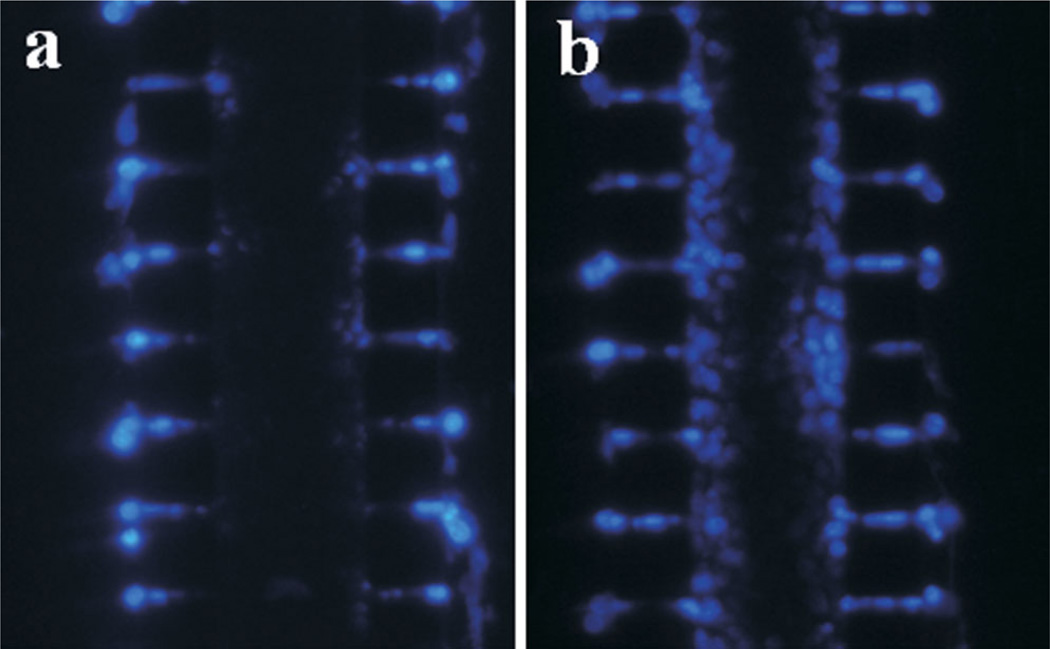
Several small fluorescent dyes that were cell membrane-permeant were used in the investigation. They included CellTracker Green and PI used for cell viability determination (Fig. 3a), DAPI for cell density measurement (Fig. 4c and d), and Hoechst 33342 for staining cell nuclei (Fig. 8). The cellular uptake and subsequent entrapment via reactions with intracellular molecules would effectively reduce extracellular concentration of these molecules. In this regard, the cells could be considered as molecular sinks that effectively reduced the rate of transport and depth of penetration in the cell compartment. CellTracker™ Green, PI, and DAPI could uniformly label all cells in the central channel after being infused into the two outer channels for 20 min, indicating that the rate of diffusion for each dye was faster than the rates of cellular uptake and intracellular entrapment. For Hoechst 33342, however, the penetration depth was less than those of the other three fluorescent dyes even at 2 h after the side channels were perfused with its solution (16 µM) for 20 min at 0.1 ml/h and room temperature (Fig. 8b). The limited penetration was consistent with the observation in a previous study of Hoechst 33342 using spheroid model (Durand, 1982), and the data of anticancer drug penetration in previous studies based on spheroid and MCL models (Hicks et al., 1998, 2003; Tannock et al., 2002; Tunggal et al., 1999; West et al., 1980). In fact, a correlation has been shown between rate of anti-cancer drug transport through MCL and packing density of tumor cells (Grantab et al., 2006), suggesting that poor penetration of small drug molecules in solid tumors is caused by cellular uptake.
Figure 8.
Distribution of Hoechst 33342 in microfluidic channel. Both outer channels were perfused for 20 min with Hoechst 33342 solution (16 µM) at 12-h post cell loading. The images were taken at 30 min (a) and 2 h (b) after the outer channels were loaded with Hoechst dye. [Color figure can be seen in the online version of this article, available at http://wileyonlinelibrary.com/bit]
Another interesting result observed in the study was the lack of penetration for calcein acetoxymethyl ester (calcein-AM) loaded into the outer channels. Calcein-AM has been routinely used to stain the cytosol of viable cells. However, it could only stain the cells close to the outer channels that were perfused with a solution of calcein-AM (10 µM) and PI (10 µM) for 20 min (Fig. 9a); and this pattern of calcein distribution could not be improved when the perfusion time was increased to 3 h at 37°C. As a comparison, another pattern of calcein distribution in the central channel is shown in Figure 9b, where the cells were incubated in the same solution of calcein-AM and PI for 20 min at 37°C prior to being loaded into the microfluidic device. This control image demonstrated that calcein-AM could stain the cytosol of cells cultured outside the microfluidic device. The discrepancy described above might have two possible explanations. One was that the lack of calcein-AM penetration in the central channel was due to cellular uptake, which consumed a significant amount of calcein-AM in extracellular space and left few molecules available for further penetration. The same phenomenon has been observed in spheroid and MCL models. To improve the penetration depth of calcein-AM in these 3D tumor models, previous studies have to first inactivate cytosolic esterases via temperature reduction during dye delivery and then increase the temperature to 37°C to entrap the dye in cytosol via hydrolysis of calcein-AM (Al-Abd et al., 2008; Wartenberg and Acker, 1995). However, we observed that the same temperature manipulation (i.e., first loading the dye for 30 min at 0°C on ice and then incubating the chip at 37°C in a water bath for up to 3 h) had minimal effects on calcein-AM penetration in our tumor model. The second explanation was that calcein-AM uptake at lower extracellular concentration, which occurred in the middle region of the central channel, was blocked in cells with multidrug resistance. It has been shown that calcein-AM uptake can be extruded by P-glycoprotein and that calcein produced in cells can be pumped out by multidrug resistance-associated protein (MDP) (Legrand et al., 1998). When the extracellular concentration was high in regular cell culture or for cells close to the outer channels, the molecular pumps were saturated. As a result, the intracellular concentration of calcein was increased significantly (Fig. 9a and b).
Figure 9.
Distribution of calcein-AM in microfluidic channel. a: Both outer channels were perfused with a solution of calcein-AM (10 µM) and PI (10 µM) at 12-h post cell loading. The perfusion was performed for 20 min at 37°C. The image was taken immediately after the perfusion. b: Cells in the image were pre-incubated in the same solution of calcein-AM and PI for 20 min at 37°C before they were loaded into the microfluidic channel. The image was taken at 12-h post cell loading. [Color figure can be seen in the online version of this article, available at http://wileyonlinelibrary.com/bit]
Potential Applications
The 3D tumor model developed in this study can be used for in vitro drug delivery and efficacy studies in a more realistic environment. For example, it can be combined with the fluorescence recovery after photobleaching (FRAP) technique to measure diffusion coefficient of fluorescent tracer/ drug in tumor interstitial space (Berk et al., 1997). It can be used to investigate effects of cellular uptake on small molecule penetration in tumor tissues. Another application is to investigate mechanisms of drug resistance when the system is combined with fluorescent reporters that can indicate cell death (e.g., PI) or cellular responses to drugs (e.g., fluorescent protein sensors). The microfluidic system is better than the MCL for drug resistance study since it allows easier determination of spatial and temporal distributions of fluorescent reporters. Unlike the cell monolayers used routinely in drug resistance studies, the microfluidic system can generate a concentration gradient of drugs exists across the cell compartment, which can mimic perivascular distribution of drugs delivered systemically. This gradient may lead to cell killing in regions with high concentration and drug resistance in regions with low concentration. As a result, both dead and resistant cells are observed simultaneously within the same system. In addition to the applications discussed above, our model can be used to investigate mechanisms of spreading of replication-competent viruses or bacterial cells in studies of oncolysis or gene delivery in solid tumors (Elliott et al., 2011). The viruses and bacteria, carrying genes for fluorescent proteins, can be visualized in 3D using confocal or two photon microscopy. Furthermore, the microfluidic model can be applied to investigation of mechanisms of tumor cell invasion in a mechanically confined environment (Irimia and Toner, 2009), when tumor cells migrate from central to outer channels. It may also be useful for co-culturing tumor and stromal cells in the microfluidic system to study their interactions (Hsiao et al., 2009; Langley and Fidler, 2011; Tlsty and Coussens, 2006).
In summary, a new in vitro tumor model was established, which might provide a promising platform for drug delivery studies. It exemplified the benefits of microfluidic approaches to development of in vitro tumor models that could more closely mimic characteristics of native tumor tissues, in terms of cell density and microcirculatory system for nutrient and drug supply. The ability to directly visualize distributions of fluorescent molecules and tumor cells in 3D configuration without disrupting the system proved the usefulness of this model for time-dependent drug penetration and pharmacodynamics studies. Compared to other 3D tumor models, there were a few unique features in this model. These included (i) high density of cells in the central channel, which was comparable to the value measured in solid tumors in vivo, (ii) short period required to achieve high cell density, compared to spheroid and MCL models, and (iii) well-controlled geometry of multicellular structures for drug transport studies. In addition, all types of tumor cells can be loaded into the microfluidic system to form 3D structures, at least for a short period, whereas spheroid and MCL models are limited to those that are capable of forming multicellular structures in vitro. Future studies need to be performed to characterize ECM and cell–cell adhesion in the current model, monitor changes in the tumor model over extended culture periods, and incorporate additional features of solid tumors into the model design.
Acknowledgments
This work was supported in part by a grant from the National Science Foundation (BES-0828630). NTE was supported in part by an NIH predoctoral fellowship (CA123714). We thank Professor Nan Jokerst and Dr. Lin Luan for advice and training on soft photolithography. We also thank the reviewers for their excellent comments.
References
- Al-Abd AM, Lee JH, Kim SY, Kun N, Kuh HJ. Novel application of multicellular layers culture for in situ evaluation of cytotoxicity and penetration of paclitaxel. Cancer Sci. 2008;99(2):423–431. doi: 10.1111/j.1349-7006.2007.00700.x. [DOI] [PMC free article] [PubMed] [Google Scholar]
- Bartholoma P, Impidjati Reininger-Mack A, Zhang Z, Thielecke H, Robitzki A. A more aggressive breast cancer spheroid model coupled to an electronic capillary sensor system for a high-content screening of cytotoxic agents in cancer therapy: 3-dimensional in vitro tumor spheroids as a screening model. J Biomol Screen. 2005;10(7):705–714. doi: 10.1177/1087057105277841. [DOI] [PubMed] [Google Scholar]
- Bauer M, Su G, Beebe DJ, Friedl A. 3D microchannel co-culture: Method and biological validation. Integr Biol (Camb) 2010;2(7–8):371–378. doi: 10.1039/c0ib00001a. [DOI] [PMC free article] [PubMed] [Google Scholar]
- Berk DA, Yuan F, Leunig M, Jain RK. Direct in vivo measurement of targeted binding in a human tumor xenograft. Proc Natl Acad Sci USA. 1997;94(5):1785–1790. doi: 10.1073/pnas.94.5.1785. [DOI] [PMC free article] [PubMed] [Google Scholar]
- Chen MC, Gupta M, Cheung KC. Alginate-based microfluidic system for tumor spheroid formation and anticancer agent screening. Biomed Microdevices. 2010;12(4):647–654. doi: 10.1007/s10544-010-9417-2. [DOI] [PubMed] [Google Scholar]
- Cowan DS, Tannock IF. Factors that influence the penetration of methotrexate through solid tissue. Int J Cancer. 2001;91(1):120–125. doi: 10.1002/1097-0215(20010101)91:1<120::aid-ijc1021>3.0.co;2-y. [DOI] [PubMed] [Google Scholar]
- Cowan DS, Hicks KO, Wilson WR. Multicellular membranes as an in vitro model for extravascular diffusion in tumours. Br J Cancer. 1996;(Suppl 27):S28–S31. [PMC free article] [PubMed] [Google Scholar]
- Durand RE. Use of Hoechst 33342 for cell selection from multicell systems. J Histochem Cytochem. 1982;30(2):117–122. doi: 10.1177/30.2.6174559. [DOI] [PubMed] [Google Scholar]
- Durand RE. Multicell spheroids as a model for cell kinetic studies. Cell Tissue Kinet. 1990;23(3):141–159. doi: 10.1111/j.1365-2184.1990.tb01111.x. [DOI] [PubMed] [Google Scholar]
- Elliott NT, Yuan F. A review of three-dimensional in vitro tissue models for drug discovery and transport studies. J Pharm Sci. 2011;100(1):59–74. doi: 10.1002/jps.22257. [DOI] [PubMed] [Google Scholar]
- Elliott N, Lee T, You L, Yuan F. Proliferation behavior of E. coli in a three-dimensional in vitro tumor model. Integr Biol (Camb) 2011;3(6):696–705. doi: 10.1039/c0ib00137f. [DOI] [PMC free article] [PubMed] [Google Scholar]
- Francia G, Green SK, Bocci G, Man S, Emmenegger U, Ebos JM, Weinerman A, Shaked Y, Kerbel RS. Down-regulation of DNA mismatch repair proteins in human and murine tumor spheroids: Implications for multicellular resistance to alkylating agents. Mol Cancer Ther. 2005;4(10):1484–1494. doi: 10.1158/1535-7163.MCT-04-0214. [DOI] [PubMed] [Google Scholar]
- Freyer JP. Role of necrosis in regulating the growth saturation of multicellular spheroids. Cancer Res. 1988;48(9):2432–2439. [PubMed] [Google Scholar]
- Freyer JP, Sutherland RM. Selective dissociation and characterization of cells from different regions of multicell tumor spheroids. Cancer Res. 1980;40:3956–3965. [PubMed] [Google Scholar]
- Grantab R, Sivananthan S, Tannock IF. The penetration of anticancer drugs through tumor tissue as a function of cellular adhesion and packing density of tumor cells. Cancer Res. 2006;66(2):1033–1039. doi: 10.1158/0008-5472.CAN-05-3077. [DOI] [PubMed] [Google Scholar]
- Hicks KO, Ohms SJ, van Zijl PL, Denny WA, Hunter PJ, Wilson WR. An experimental and mathematical model for the extravascular transport of a DNA intercalator in tumours. Br J Cancer. 1997;76(7):894–903. doi: 10.1038/bjc.1997.481. [DOI] [PMC free article] [PubMed] [Google Scholar]
- Hicks KO, Fleming Y, Siim BG, Koch CJ, Wilson WR. Extravascular diffusion of tirapazamine: Effect of metabolic consumption assessed using the multicellular layer model. Int J Radiat Oncol Biol Phys. 1998;42(3):641–649. doi: 10.1016/s0360-3016(98)00268-5. [DOI] [PubMed] [Google Scholar]
- Hicks KO, Pruijn FB, Sturman JR, Denny WA, Wilson WR. Multicellular resistance to tirapazamine is due to restricted extravascular transport: A pharmacokinetic/pharmacodynamic study in HT29 multicellular layer cultures. Cancer Res. 2003;63(18):5970–5977. [PubMed] [Google Scholar]
- Hsiao AY, Torisawa YS, Tung YC, Sud S, Taichman RS, Pienta KJ, Takayama S. Microfluidic system for formation of PC-3 prostate cancer co-culture spheroids. Biomaterials. 2009;30(16):3020–3027. doi: 10.1016/j.biomaterials.2009.02.047. [DOI] [PMC free article] [PubMed] [Google Scholar]
- Irimia D, Toner M. Spontaneous migration of cancer cells under conditions of mechanical confinement. Integr Biol (Camb) 2009;1(8–9):506–512. doi: 10.1039/b908595e. [DOI] [PMC free article] [PubMed] [Google Scholar]
- Jain RK. The Eugene M. Landis Award Lecture 1996. Delivery of molecular and cellular medicine to solid tumors. Microcirculation. 1997;4(1):1–23. doi: 10.3109/10739689709148314. [DOI] [PubMed] [Google Scholar]
- Jain RK. The next frontier of molecular medicine—Delivery of therapeutics. Nat Med. 1998;4(6):655–657. doi: 10.1038/nm0698-655. [DOI] [PubMed] [Google Scholar]
- Kim MS, Yeon JH, Park JK. A microfluidic platform for 3-dimensional cell culture and cell-based assays. Biomed Microdevices. 2007;9(1):25–34. doi: 10.1007/s10544-006-9016-4. [DOI] [PubMed] [Google Scholar]
- Kobayashi H, Man S, Graham CH, Kapitain SJ, Teicher BA, Kerbel RS. Acquired multicellular-mediated resistance to alkylating agents in cancer. Proc Natl Acad Sci U S A. 1993;90(8):3294–3298. doi: 10.1073/pnas.90.8.3294. [DOI] [PMC free article] [PubMed] [Google Scholar]
- Krol A, Maresca J, Dewhirst MW, Yuan F. Available volume fraction of macromolecules in the extravascular space of a fibrosarcoma: Implications for drug delivery. Cancer Res. 1999;59(16):4136–4141. [PubMed] [Google Scholar]
- Krol A, Dewhirst MW, Yuan F. Effects of cell damage and glycos-aminoglycan degradation on available extravascular space of different dextrans in a rat fibrosarcoma. Int J Hyperthermia. 2003;19(2):154–164. doi: 10.1080/02656730210166519. [DOI] [PubMed] [Google Scholar]
- Kunz-Schughart LA, Freyer JP, Hofstaedter F, Ebner R. The use of 3-D cultures for high-throughput screening: The multicellular spheroid model. J Biomol Screen. 2004;9(4):273–285. doi: 10.1177/1087057104265040. [DOI] [PubMed] [Google Scholar]
- Langley RR, Fidler IJ. The seed and soil hypothesis revisited—The role of tumor-stroma interactions in metastasis to different organs. Int J Cancer. 2011;128(11):2527–2535. doi: 10.1002/ijc.26031. [DOI] [PMC free article] [PubMed] [Google Scholar]
- Legrand O, Simonin G, Perrot JY, Zittoun R, Marie JP. Pgp and MRP activities using calcein-AM are prognostic factors in adult acute myeloid leukemia patients. Blood. 1998;91(12):4480–4488. [PubMed] [Google Scholar]
- Lin CW, Wang Y, Challa P, Epstein DL, Yuan F. Transscleral diffusion of ethacrynic acid and sodium fluorescein. Mol Vis. 2007;13:243–251. [PMC free article] [PubMed] [Google Scholar]
- Mossop BJ, Barr RC, Henshaw JW, Zaharoff DA, Yuan F. Electric fields in tumors exposed to external voltage sources: Implication for electric field-mediated drug and gene delivery. Ann Biomed Eng. 2006;34(10):1564–1572. doi: 10.1007/s10439-006-9151-3. [DOI] [PubMed] [Google Scholar]
- Ng CP, Pun SH. A perfusable 3D cell-matrix tissue culture chamber for in situ evaluation of nanoparticle vehicle penetration and transport. Biotechnol Bioeng. 2008;99(6):1490–1501. doi: 10.1002/bit.21698. [DOI] [PMC free article] [PubMed] [Google Scholar]
- Nugent LJ, Jain RK. Extravascular diffusion in normal and neoplastic tissues. Cancer Res. 1984;44(1):238–244. [PubMed] [Google Scholar]
- Ong SM, Zhang C, Toh YC, Kim SH, Foo HL, Tan CH, van NoortD, Park S, Yu H. A gel-free 3D microfluidic cell culture system. Biomaterials. 2008;29(22):3237–3244. doi: 10.1016/j.biomaterials.2008.04.022. [DOI] [PubMed] [Google Scholar]
- Shamloo A, Ma N, Poo MM, Sohn LL, Heilshorn SC. Endothelial cell polarization and chemotaxis in a microfluidic device. Lab Chip. 2008;8(8):1292–1299. doi: 10.1039/b719788h. [DOI] [PubMed] [Google Scholar]
- Stephens TC, Peacock JH. Cell yield and cell survival following chemotherapy of the B16 melanoma. Br J Cancer. 1978;38(5):591–598. doi: 10.1038/bjc.1978.254. [DOI] [PMC free article] [PubMed] [Google Scholar]
- Sung KE, Yang N, Pehlke C, Keely PJ, Eliceiri KW, Friedl A, Beebe DJ. Transition to invasion in breast cancer: A microfluidic in vitro model enables examination of spatial and temporal effects. Integr Biol (Camb) 2011;3(4):439–450. doi: 10.1039/c0ib00063a. [DOI] [PMC free article] [PubMed] [Google Scholar]
- Sutherland RM, Durand RE. Radiation response of multicell spheroids–an in vitro tumour model. Curr Top Radiat Res Q. 1976;11(1):87–139. [PubMed] [Google Scholar]
- Sutherland RM, Durand RE. Growth and cellular characteristics of multicell spheroids. Recent Results Cancer Res. 1984;95:24–49. doi: 10.1007/978-3-642-82340-4_2. [DOI] [PubMed] [Google Scholar]
- Tannock IF, Lee CM, Tunggal JK, Cowan DS, Egorin MJ. Limited penetration of anticancer drugs through tumor tissue: A potential cause of resistance of solid tumors to chemotherapy. Clin Cancer Res. 2002;8(3):878–884. [PubMed] [Google Scholar]
- Tlsty TD, Coussens LM. Tumor stroma and regulation of cancer development. Annu Rev Pathol. 2006;1:119–150. doi: 10.1146/annurev.pathol.1.110304.100224. [DOI] [PubMed] [Google Scholar]
- Toh YC, Ho ST, Zhou Y, Hutmacher DW, Yu H. Application of a polyelectrolyte complex coacervation method to improve seeding efficiency of bone marrow stromal cells in a 3D culture system. Biomaterials. 2005;26(19):4149–4160. doi: 10.1016/j.biomaterials.2004.10.033. [DOI] [PubMed] [Google Scholar]
- Toh YC, Zhang C, Zhang J, Khong YM, Chang S, Samper VD, van Noort D, Hutmacher DW, Yu H. A novel 3D mammalian cell perfusion-culture system in microfluidic channels. Lab Chip. 2007;7(3):302–309. doi: 10.1039/b614872g. [DOI] [PubMed] [Google Scholar]
- Tunggal JK, Cowan DS, Shaikh H, Tannock IF. Penetration of anticancer drugs through solid tissue: A factor that limits the effectiveness of chemotherapy for solid tumors. Clin Cancer Res. 1999;5(6):1583–1586. [PubMed] [Google Scholar]
- Wang Y, Yuan F. Delivery of viral vectors to tumor cells: Extracellular transport, systemic distribution, and strategies for improvement. Ann Biomed Eng. 2006;34(1):114–127. doi: 10.1007/s10439-005-9007-2. [DOI] [PubMed] [Google Scholar]
- Wartenberg M, Acker H. Quantitative recording of vitality patterns in living multicellular spheroids by confocal microscopy. Micron. 1995;26(5):395–404. doi: 10.1016/0968-4328(95)00009-7. [DOI] [PubMed] [Google Scholar]
- West GW, Weichselbaum R, Little JB. Limited penetration of methotrexate into human osteosarcoma spheroids as a proposed model for solid tumor resistance to adjuvant chemotherapy. Cancer Res. 1980;40(10):3665–3668. [PubMed] [Google Scholar]
- Wlodkowic D, Darzynkiewicz Z. Microfluidics: Emerging prospects for anti-cancer drug screening. World J Clin Oncol. 2010;1(1):18–23. doi: 10.5306/wjco.v1.i1.18. [DOI] [PMC free article] [PubMed] [Google Scholar]
- Wong AP, Perez-Castillejos R, Christopher Love J, Whitesides GM. Partitioning microfluidic channels with hydrogel to construct tunable 3-D cellular microenvironments. Biomaterials. 2008;29(12):1853–1861. doi: 10.1016/j.biomaterials.2007.12.044. [DOI] [PMC free article] [PubMed] [Google Scholar]
- Yuan F. Physiological barriers to drug transport. In: Bronzino JD, Peterson DR, editors. The biomedical engineering handbook. 4th edn. Boca Raton, FL, USA: CRC Press; 2011. [Google Scholar]
- Yuan F, Krol A, Tong S. Available space and extracellular transport of macromolecules: Effects of pore size and connectedness. Ann Biomed Eng. 2001;29(12):1150–1158. doi: 10.1114/1.1424915. [DOI] [PubMed] [Google Scholar]


