

Abstract
Overexpression of the ped/pea-15 gene is a common feature of type 2 diabetes. In the present work, we show that transgenic mice ubiquitously overexpressing ped/pea-15 exhibited mildly elevated random-fed blood glucose levels and decreased glucose tolerance. Treatment with a 60% fat diet led ped/pea-15 transgenic mice to develop diabetes. Consistent with insulin resistance in these mice, insulin administration reduced glucose levels by only 35% after 45 min, compared to 70% in control mice. In vivo, insulin-stimulated glucose uptake was decreased by almost 50% in fat and muscle tissues of the ped/pea-15 transgenic mice, accompanied by protein kinase Cα activation and block of insulin induction of protein kinase Cζ. These changes persisted in isolated adipocytes from the transgenic mice and were rescued by the protein kinase C inhibitor bisindolylmaleimide. In addition to insulin resistance, ped/pea-15 transgenic mice showed a 70% reduction in insulin response to glucose loading. Stable overexpression of ped/pea-15 in the glucose-responsive MIN6 beta-cell line also caused protein kinase Cα activation and a marked decline in glucose-stimulated insulin secretion. Antisense block of endogenous ped/pea-15 increased glucose sensitivity by 2.5-fold in these cells. Thus, in vivo, overexpression of ped/pea-15 may lead to diabetes by impairing insulin secretion in addition to insulin action.
Type 2 diabetes is a genetically determined disorder, affecting over 150 million people worldwide (35). The pathogenesis of type 2 diabetes is characterized both by insulin resistance in muscle, fat, and liver and by impaired insulin secretion (10, 16). Whether a single genetic defect may simultaneously cause impaired insulin action and secretion in common forms of human diabetes and by what mechanism are unknown.
PED/PEA-15 is a ubiquitously expressed multifunctional protein. It controls mitogenic signaling by binding extracellular signal-regulated kinases and anchoring them to the cytoplasm (14). PED/PEA-15 also inhibits several apoptotic pathways through a number of different mechanisms and plays an important role in tumor development and sensitivity to antineoplastic agents (5, 6, 11, 15, 30, 34). Recently, PED/PEA-15 was reported to bind to and increase the cellular stability of phospholipase D, enhancing its activity in the cell (8, 35). In addition, we showed that overexpression of the ped/pea-15 gene is a common defect in type 2 diabetes (7). Overexpression of PED/PEA-15 protein impairs insulin-stimulated GLUT4 translocation and glucose transport in cultured muscle and adipose cells, suggesting that ped/pea-15 overexpression may contribute to insulin resistance in type 2 diabetics (7).
Other studies have demonstrated that ped/pea-15-induced resistance to insulin action on glucose disposal is accompanied by activation of the classical protein kinase C (PKC) isoform PKCα (8). In turn, the induction of PKCα by ped/pea-15 overexpression prevents subsequent activation of atypical PKCζ/λ by insulin (8). Rescue of PKCζ/λ function in ped/pea-15-overexpressing cells restores glucose transport to its normal sensitivity to insulin. Thus, in cultured muscle and adipose cells, ped/pea-15 generates resistance to insulin action on glucose disposal by impairing normal regulation of PKCζ/λ function by PKCα. Accumulating evidence now indicates that the atypical PKCs ζ and λ are major downstream effectors activating the glucose transport machinery in response to insulin in both skeletal muscle and adipose tissues (12). Activation of atypical PKCs by insulin is defective in humans with type 2 diabetes as well as in animal models of type 2 diabetes (12, 17, 18). It therefore appears that atypical PKCs are key molecules in the pathogenesis of type 2 diabetes and may represent important drug targets as well.
Defective insulin secretion in response to secretogogues also plays an important role in the pathogenesis of type 2 diabetes (24). At least in part, this further abnormality appears to be genetically determined (2, 33). However, metabolic abnormalities determined by insulin resistance also contribute to beta-cell failure in type 2 diabetes (2, 24, 33). In the present report, we show that overexpression of ped/pea-15 to levels similar to those found in many type 2 diabetics may lead to diabetes in transgenic mice. This defect is accompanied by defective insulin action on glucose transport and, additionally, by impaired glucose-stimulated insulin secretion. Thus, overexpression of the ped/pea-15 gene may cause diabetes by impairing beta-cell function in addition to insulin sensitivity.
MATERIALS AND METHODS
Generation of ped/pea-15 transgenic mice.
ped/pea-15 cDNA (7) was cloned in the BamHI sites of plasmid pBap2, containing the human beta-actin promoter. To generate transgenic mice, the 5.2-kb ClaI fragment was excised, purified by agarose gel electrophoresis, and injected into pronuclei of C57BL/6J × DBA/2J mouse embryos. Three F0 founders were identified by Southern blot analysis of genomic DNA by probing with the PstI fragment of the human β-actin promoter.
To establish transgenic lines, founder mice were mated with BDF1 mice. Heterozygous transgenic mice were subsequently identified by Southern blotting with either the ClaI fragment or the PCR amplification product of the fragment obtained with primers 5′-CGCGGATCCATGGCTGAGTACGGGACCCTC-3′ and 5′-GGCCTTCTTCGGTGGGGGAGCCAATTTGATGATCTCTTCCTCA-3′; by Northern blotting with the ClaI fragment; and by Western blotting with polyclonal rabbit antibodies against PED/PEA-15 protein (7). Three lines (L1, L61, and L30) overexpressing PED/PEA-15 protein were established. Animals were kept in a 12-h dark-light cycle and fed standard or chow with a 60 kcal% fat content (Research Diets formulas D12328 and D12331, respectively; Research Diets, Inc., New Brunswick, N.J.) ad libitum. All procedures described below were approved by the Institutional Animal Care and Utilization Committee.
Phenotypic analysis.
Blood glucose levels were measured with glucometers (Accu-check; Boehringer Mannheim), plasma insulin was measured by enzyme immunoassays (ultrasensitive mouse insulin enzyme-linked immunosorbent assay; Mercordia AB, Uppsala, Sweden), fasting plasma free fatty acids were measured with the Wako NEFA C kit (Wako, Richmond, Va.), and triglycerides were measured with the Infinity triglyceride reagent (Sigma, St. Louis, Mo.).
Insulin tolerance tests.
Random-fed mice were subjected to intraperitoneal injection with insulin (0.75 mU g of body weight−1). Venous blood was subsequently drawn by tail clipping at 0, 15, 30, 45, 60, 90, and 120 min after insulin injection to determine blood glucose levels.
Glucose tolerance tests and insulin secretion.
Mice were fasted overnight and then injected with glucose (2 g kg of body weight−1) intraperitoneally. Venous blood glucose was drawn by tail clipping at 0, 15, 30, 45, 60, 90, and 120 min without reclipping of the tails. We also measured plasma insulin concentrations at 2, 5, 15, and 30 min.
In vivo tissue glucose transport during glucose tolerance tests.
2-Deoxy-d-[1,2-3H]glucose (Amersham) was mixed with 20% glucose and then injected intraperitoneally (2 mg kg of body weight−1; 10 μCi/mouse) into weight-matched mice. Blood samples were obtained from the tail veins at 0, 15, 30, 45, 60, 90, and 120 min, and glucose concentrations were determined. The glucose specific activity was determined as described before (37). At 120 min, mice were killed and tissues were snap frozen in liquid nitrogen. To determine tissue accumulation of 2-deoxyglucose-6-phosphate, 100 to 500 mg of tissue was homogenized in 2 ml of distilled water, and 1.6 ml of the homogenate was transferred to 1.6 ml of 7% ice-cold perchloric acid. The sample was centrifuged to remove precipitated protein, and 2.5 ml of the supernatant was neutralized for 30 min with 625 μl of 2.2 M KHCO3. The precipitate was removed by centrifugation, and the supernatant was divided into 800-μl aliquots. One aliquot was used to determine total 3H radioactivity, and another was passed through an AG 1-X8 anion exchange resin column (Bio-Rad, Hercules, Calif.) to remove labeled 2-deoxyglucose-phosphate. The column was washed with 3 ml of distilled water, and the radioactivity in the eluted volume was measured in a scintillation counter. The difference between total and eluted 3H radioactivity represents accumulated 2-deoxy-d-[1,2-3H]glucose-6-phosphate. The protein pellet was digested for 20 min at 55°C with 1 N KOH, and the protein concentration was determined by the Bradford assay (Bio-Rad, Hercules, Calif.). To calculate 2-deoxyglucose uptake, the radioactivity was divided by the integrated glucose specific activity area under the curve and the sample protein content.
Tissue collection and immunoblotting.
Tissue samples (tibialis and soleus muscles and subcutaneous and perigonadal adipose tissues) were collected rapidly after mice were sacrificed by pentobarbitone overdose. Tissues were snap frozen in liquid nitrogen and stored at −80°C for subsequent Western blotting, biochemical assays of PKC activity, and diacylglycerol levels. Tissue samples were homogenized in a Polytron (Brinkman Instruments, Westbury, N.Y.) in 100 mg of buffer A per ml according to the method of Qu et al. (26). After centrifugation at 3,000 × g, the supernatant was centrifuged at 200,000 × g for 90 min to pellet the crude membrane and cytosolic fractions. Further purifications to obtain the plasma membrane fractions were achieved as described by Uphues et al. (32). Ouabain-sensitive Na+/K+ ATPase was used as a marker enzyme for plasma membranes, and activity was determined as described by Russ et al. (29).
Membranes recovered from the 0.72 M sucrose layer were 12-fold enriched in the activity of the Na+/K+ ATPase and considered to represent the plasma membrane fraction. Preparation of total tissue lysates was achieved by homogenization in TAT buffer (4). Total homogenates and plasma membrane fractions were subjected to sodium dodecyl sulfate-polyacrylamide gel electrophoresis (SDS-PAGE) with 10% gels, as described by Laemmli (21). Proteins separated on the gels were electroblotted onto nitrocellulose filters as described before (8) and probed with antibodies to GLUT4, PKC (Santa Cruz Biotech Inc., Santa Cruz, Calif.), PLD (BioSource International, Camarillo, Calif.) phospho-Akt (Ser473) (Cell Signaling Technology, Inc., Beverly, Mass.), or Akt (Upstate Biotechnology, Lake Placid, N.Y.).
Determination of PKC and phosphatidylinositol 3-kinase activities.
For determination of PKCα activity, tissues and cells were homogenized in TAT buffer, followed by immunoprecipitation with specific PKCα antibodies. PKC activity in the immunoprecipitates was then assayed as described by Condorelli et al. (8). Alternatively, for assaying phosphatidylinositol 3-kinase, tissue homogenates were precipitated with phosphotyrosine antibodies coupled to protein A-Sepharose, and phosphatidylinositol 3-kinase activity in the immunoprecipitates was determined as described by Filippa et al. (13).
Lipid extraction and diacylglycerol measurement.
Muscle and adipose tissues and cells were powdered under liquid nitrogen and then extracted in 1:2 (vol/vol) chloroform-methanol as described by Turinsky et al. (31). sn-1,2 Diacylglycerol was determined with the diacylglycerol kinase assay of Preiss et al. (25). [γ-32P]phosphatidic acid was separated by thin-layer chromatography on Silica Gel-60 plates (Merck) as described previously (31). The plates were developed in chloroform-methanol-acetic acid (65:15:5, vol/vol/vol), and the positions of the spots corresponding to [γ-32P]phosphatidic acid were determined by autoradiography. Radioactivity in the spots was determined by liquid scintillation counting.
Cell culture procedures and transfection.
MIN6 cells were cultured in Dulbecco's modified Eagle's medium (Life Technologies, Karlsruhe, Germany) containing 25 mM glucose, 50 μM 2-mercaptoethanol, and 10% fetal calf serum (Biochrom, Hamburg, Germany) at 37°C in a 5% CO2 atmosphere (23). For insulin secretion experiments, cells were seeded into 96-well plates at a density of 3 × 10⁴ cells per well. Three days after plating, the cells were washed with Earle's balanced salt solution containing 0.1% bovine serum albumin (Sigma). After starvation for 1 h in the same salt solution, the cells were incubated with either 0.1 or 16.7 mM glucose, as indicated, for 1 additional hour. The cell supernatant was filtered through Multiscreen MAVN filter plates (Millipore, Eschborn, Germany) and stored at −20°C until the insulin determination was performed.
Ped/pea-15 antisense (5′-TGACGCCTCCGGAGCTGAGA-3′) and scrambled (5′-GGCAATTTCGAGCGGCACGC-3′) oligonucleotides were synthesized by PRIMM (Milan, Italy). The ped/pea-15 expression vector has been reported (7). Transfection of ped/pea-15 cDNA and antisense DNAs was performed as described previously (15).
Adipocytes were isolated from epididymal fat pads by collagenase digestion, as described previously (28). The number of adipocytes isolated was adjusted to 106 cells/ml of suspension, and 2-deoxyglucose uptake was measured as described previously (6).
Immunohistochemical analysis.
Pancreas from transgenic and control animals were fixed in 4% paraformaldehyde-0.1 M sodium phosphate buffer at 4°C overnight and placed in 30% sucrose at 4°C overnight. After being embedded in Tissue-Tek OTC compound and frozen at −20°C, tissue sections were prepared. Immunohistochemical analysis was carried out with the H38 rabbit insulin antibody (Santa Cruz Biotechnology, Inc.; 1:200 dilution), the N-17 goat glucagon antibody (Santa Cruz Biotechnology, Inc.; 1:200 dilution), or PED/PEA-15 antiserum (7) (1:20,000 dilution). Incubation with the primary antibody was followed by incubation with biotinylated anti-rabbit or anti-goat immunoglobulin G and peroxidase-labeled streptavidin. Analysis of serial consecutive islet sections stained with either insulin or the PED/PEA-15 antibodies was used to confirm ped/pea-15 expression in insulin-immunopositive beta cells.
Statistical procedures.
Data were analyzed with Statview software (Abacusconcepts) by one-factor analysis of variance. P values of less than 0.05 were considered statistically significant. The total area under the curve for glucose response during the insulin tolerance test was calculated by the trapezoidal method.
RESULTS
Generation of transgenic mice overexpressing ped/pea-15.
To investigate the relevance of ped/pea-15 overexpression to glucose tolerance, we used the β-actin promoter to generate transgenic mice overexpressing human ped/pea-15 (hped/pea-15) ubiquitously, as ped/pea-15 overexpression frequently occurs in type 2 diabetes (7) (Fig. 1a). Three lines of mice (L1, L61, and L30) were established in which ped/pea-15 RNA as well as ped/pea-15 protein featured a 5 to 20-fold increased expression in fat, in skeletal and in cardiac muscles, three major targets of insulin action (Fig. 1b and c). Transgenic mice were fertile and generated viable offspring showing no significant growth alterations compared to control mice or other apparent abnormalities. L1 ped/pea-15 transgenic mice also exhibited normal fasting glucose levels (Fig. 2a). However, random-fed blood glucose levels were mildly elevated in the transgenic (145 ± 40 and 138 ± 28 mg/dl in male and female mice, respectively) versus the nontransgenic littermates (115 ± 37 and 103 ± 18 mg/dl in males and females, respectively). The difference between transgenic and control mice was significant (P < 0.01). In addition, glucose loading (2 mg kg−1) rendered the transgenic mice significantly hyperglycemic for the following 120 min. (Fig. 2b and c), indicating decreased glucose tolerance in ped/pea-15 transgenic mice. Almost identical abnormalities were observed in L61 and L30 transgenic mice (data not shown). As shown in Fig. 2, gender had no effect on the impairment in glucose tolerance caused by overexpression of ped/pea-15. Aging (3 to 12 months) also determined no significant changes in ped/pea-15-induced decreases in glucose tolerance (data not shown).
FIG. 1.

Generation of ped/pea-15 transgenic mice. a. Subcloning of the ped/pea-15 cDNA in the BamHI sites of plasmid pBap2 containing the β-actin promoter. Tissues from ped/pea-15 transgenic mice (Tg) and their nontransgenic littermates (C) were collected as described under Materials and Methods and subjected to Northern (b) or Western (c) blotting. Northern blots (25 μg of RNA/lane) were probed with ped/pea-15 cDNA as reported (6). Loading of the same amount of RNA in each lane was ensured by further blotting for β-actin. Quantitation of the blots was performed by densitometric analysis. Data are plotted as increase of ped/pea-15 mRNA expression in transgenic versus control mice. Bars represent the means ± standard deviation of comparisons in five transgenic and five nontransgenic animals. For Western blotting, tissues from control and transgenic mice (L1, L30, and L6 lines) were solubilized, and lysates (100 μg of protein/lane) were blotted with PED/PEA-15 antiserum (6), followed by chemiluminescence and autoradiography. Three representative experiments are shown.
FIG. 2.
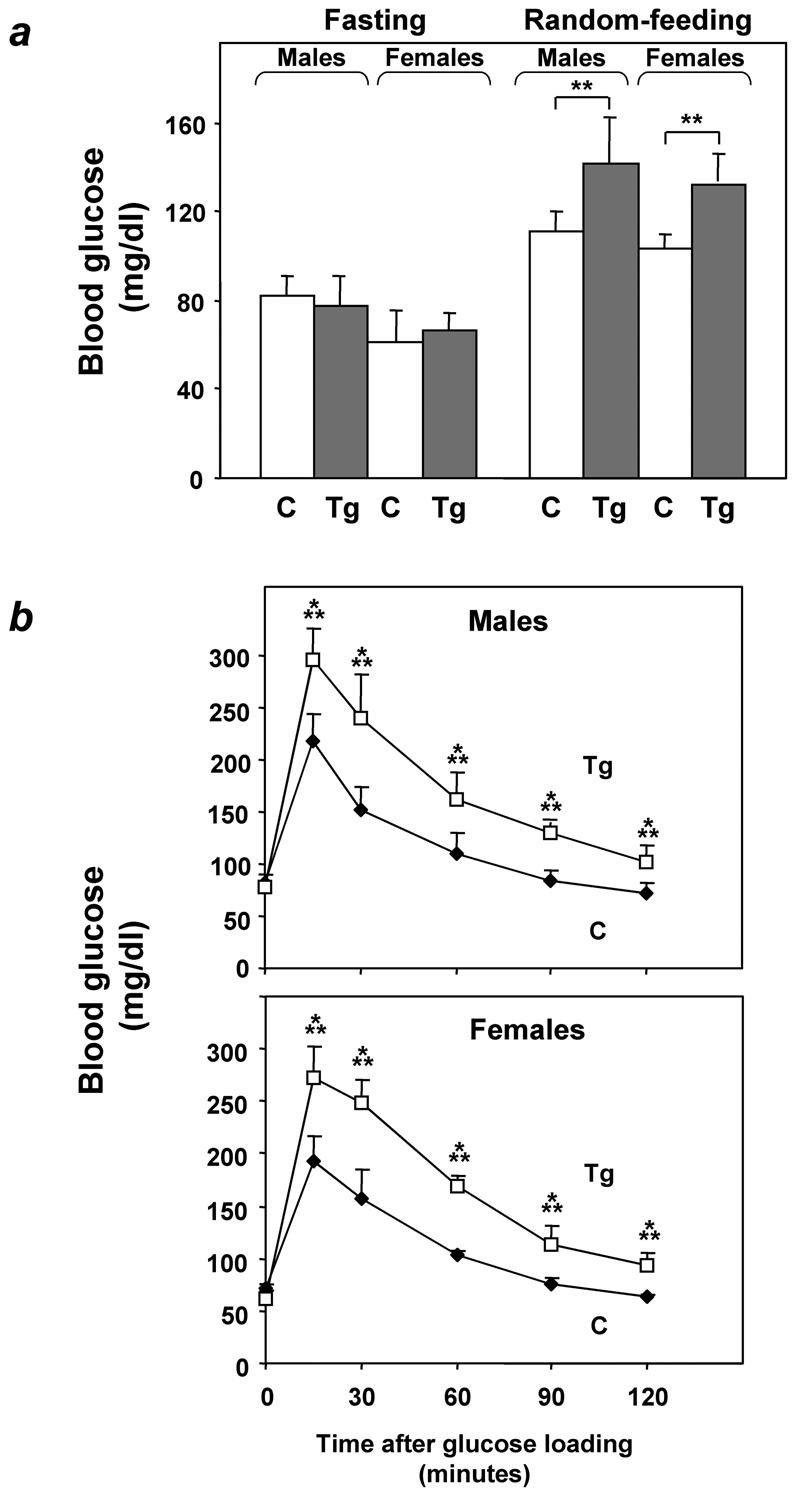
Glucose tolerance in ped/pea-15 transgenic mice. (a) ped/pea-15 transgenic mice (Tg) and their nontransgenic littermates (C) were either fasted for 12 h or fed ad libitum (random feeding). Blood glucose levels were then determined as described under Materials and Methods. Bars represent the mean ± standard deviation of determinations in at least 10 mice in each group. The differences in fasting glucose levels between transgenic and control mice were not statistically significant. Alternatively (b), whole-blood glucose was determined at 0 to 120 min after intraperitoneal glucose injection (2 mg kg−1) of age-matched male (top panel) and female (bottom panel) transgenic and control mice after overnight fasting. Values are expressed as mean ± standard deviation for at least 12 mice in each group. Asterisks denote statistically significant differences (**, P < 0.01; ***, P < 0.001).
Feeding L1 ped/pea-15 transgenic mice and their nontransgenic littermates a 60% fat diet for 10 weeks led to a 25% increased body weight compared to the standard 10% fat diet (P < 0.001; Fig. 3a). This increase in body weight caused only slight elevations of both fasting and random-fed blood glucose levels in nontransgenic animals (Fig. 3b). Glucose levels during tolerance tests were only moderately increased in nontransgenic mice after high-fat diet feeding (Fig. 3c). In ped/pea-15 transgenic mice, increased body weight was accompanied by a significant elevation in both fasting and random-fed blood glucose levels (138 ± 20 and 204 ± 38, respectively, versus 68 ± 32 and 124 ± 40, respectively, in control mice; P < 0.001). Moreover, as shown by glucose loading, the high-fat diet further and severely deteriorated glucose tolerance in the ped/pea-15 transgenic mice, indicating that, in vivo, overexpression of ped/pea-15 in conjunction with environmental modifiers may lead to diabetes. Gender had no significant effect on these diet-induced abnormalities in ped/pea-15 transgenic mice (data not shown).
FIG. 3.

Effect of high-fat feeding on glucose tolerance in ped/pea-15 transgenic mice. Three-month-old female transgenic (Tg) and control (C; nontransgenic littermates) mice were fed either standard (10% fat) or 60% fat diets for 10 weeks. Animals were then weighed (a), and blood glucose levels were determined (b) after overnight fasting and in random-fed animals. Bars represent the mean ± standard deviation of values from at least 10 mice in each group. The differences in fasting blood glucose levels in control mice treated with standard or high-fat diets were not statistically significant. Asterisks denote statistically significant differences (*, P < 0.05; ***, P < 0.001). Alternatively (c), glucose tolerance was compared in weight-matched female transgenic and control animals (at least 10 animals/group) subjected to the two different diets, as outlined in the legend to Fig. 2. Differences in blood glucose levels after high-fat diet treatment were significant at P < 0.001 (transgenic mice) and P < 0.06 (control mice).
Effect of ped/pea-15 overexpression on insulin sensitivity.
Female L1 ped/pea-15 transgenic mice featured a 10-fold increase in fasting insulin levels compared to control animals (Fig. 4a; P < 0.001). Fasting nonesterified free fatty acid and triglyceride blood concentrations in ped/pea-15 transgenic mice were also increased by 47 and 65%, respectively, suggesting the presence of insulin resistance in these animals (Fig. 4b and c; P < 0.01). Almost identical differences were present in male mice (data not shown). To address the effect of ped/pea-15 overexpression on insulin sensitivity, we performed insulin tolerance tests. In control animals, intraperitoneal injection of insulin (0.125 mU g−1) caused a severe and sustained drop in random-fed blood glucose levels (Fig. 4d and e). This decrease achieved a maximum (70%; P < 0.001) after 45 min and was maintained for a further 45 min. At variance, insulin reduced glucose levels by only 40% after 45 min in ped/pea-15 transgenic mice, whether male or female. This smaller reduction was followed by a progressive rescue of the initial blood glucose concentration over the next 45 min. The same differences were observed in transgenic mice of the L30 and L61 lines and in control animals (data not shown).
FIG. 4.

Insulin sensitivity in ped/pea-15 transgenic mice. Three-month old female ped/pea-15 transgenic mice and age-matched nontransgenic littermates (16 per group) were fasted for 12 h, followed by determination of insulin (a), triglycerides (b), and free fatty acid (c) levels in plasma as described under Materials and Methods. Bars represent the mean ± standard deviation of duplicate determinations in each animal. Differences between transgenic and control mice were significant at P < 0.001 (serum insulin) and P < 0.01 (serum free fatty acids and triglycerides). Alternatively, random-fed male (d) or female (e) mice (n = 12/group) were injected intraperitoneally with insulin (0.75 mU g−1), followed by determinations of blood glucose levels at the indicated times. Values are expressed as mean ± standard deviation of duplicate determinations in each animal. Asterisks denote statistically significant differences (P < 0.01).
In cultured cells, ped/pea-15 overexpression causes resistance to insulin action on glucose uptake (7). We therefore asked whether ped/pea-15 overexpression also impairs insulin stimulation of the glucose transport machinery in vivo. We compared glucose uptake in perigonadal and subcutaneous fat and in the tibialis and soleus muscles in L1 ped/pea-15 transgenic and in control mice. A 50% decrease in glucose uptake was observed in perigonadal and subcutaneous fat (Fig. 5a; the difference from control animals significant at the P < 0.001 and P < 0.01 levels, respectively). Also, glucose uptake in the tibialis and soleus muscles from transgenic animals was decreased by 43 and 37%, respectively, compared to the nontransgenic mice (Fig. 5b; P < 0.05). Glucose uptake was similarly reduced in both female and male transgenic mice (data not shown). Thus, insulin resistance in peripheral tissues might provide an important contribution to the impaired glucose tolerance of ped/pea-15 transgenic mice. In parallel with the decreased glucose uptake, GLUT4 membrane translocation in response to insulin and feeding was also significantly decreased in tibialis muscles and perigonadal adipose tissues from ped/pea-15 transgenic mice (Fig. 5c). This abnormality was accompanied by no significant change in the total GLUT4 levels in transgenic muscle or adipose tissues.
FIG. 5.

Glucose transport in ped/pea-15 transgenic mice. (a) Weight-matched female transgenic (Tg; n = 6) and control (C; n = 6) mice were subjected to intraperitoneal injection of d-[1,2-3H]glucose (2g kg of body weight−1; 10 μCi/mouse) and insulin (0.75 mU g of body weight−1) and killed, and tissues were snap-frozen in liquid nitrogen. d-[1,2-3H]glucose-6-phosphate accumulated in muscle and fat tissues was quantitated as described under Materials and Methods. Bars represent mean values ± standard deviations. Differences between control and transgenic animals were significant at P < 0.05 (tibialis and soleus muscles), P < 0.01 (subcutaneous fat), and P < 0.001 (perigonadal fat). (b) Alternatively, tissues from insulin-injected animals were frozen in liquid nitrogen and harvested for plasma membrane preparation as described under Materials and Methods. Total homogenates and plasma membrane lysates were then analyzed by Western blotting with GLUT4 antibodies. Blots were revealed by enhanced chemiluminescence and autoradiography. The autoradiographs shown are representative of four independent experiments.
PKC signaling in ped/pea-15 transgenic mice.
To address the molecular mechanism responsible for these abnormalities, we measured PKCα activity in immunoprecipitates from lysates of transgenic and control tissues. PKCα activity was constitutively increased in adipose tissue from fasted transgenic mice (Fig. 6a). In addition, there was little further activation in the random-fed state in these animals, even upon insulin injection. At variance with the ped/pea-15 transgenic mice, PKCα activity increased by twofold in the fed state in the nontransgenic mice. In addition, in these mice, insulin further increased PKCα activity up to 2.5-fold above fasting levels.
FIG. 6.

PKCα activation in ped/pea-15 transgenic mice. (a) Weight-matched female mice were fasted overnight or fed ad libitum, followed by intraperitoneal insulin injection (0.75 mU g−1 body weight), as indicated. The animals were killed, and perigonadal fat tissue was collected, homogenized, and immunoprecipitated with PKCα antibodies. PKC activity was assayed in the immunoprecipitates as outlined under Materials and Methods. Bars represent the mean ± standard deviation of data from at least seven mice per group. Asterisks denote statistically significant differences (P < 0.01). Alternatively, fat or muscle tissues were solubilized, and lysates were Western blotted with phospho-PKC (P-PKC), PKC (panel b), or phospholipase D 1(PLD1) antibodies (panel c). Bands were revealed by enhanced chemiluminescence and autoradiography. The autoradiographs shown are representative of four (PKCα and phospholipase D 1) and three (PKCζ) independent experiments. (d) For determining diacylglycerol levels, tissues were extracted in chloroform-methanol, and lipid extracts were assayed by adding diacylglycerol kinase and [γ-32P]ATP as described under Materials and Methods. [32P]phosphatidic acid was separated by thin-layer chromatography and quantitated by liquid scintillation counting. Bars represent the mean ± standard deviation of data from at least six mice per group. Asterisks denote statistically significant differences (*P < 0.05, **P < 0.01).
The differences in PKCα activity between transgenic and control mice were accompanied by parallel changes in phosphorylation of the Ser657 PKCα key activation site, with no change in the total levels of PKCα in the tissues (Fig. 6b). In the control mice, transition from the fasted to the fed state was also accompanied by fourfold-increased phosphorylation of the Thr410 key activation site of PKCζ/λ (P < 0.001), indicating PKCζ/λ activation. A similar induction of PKCζ/λ was observed after administration of insulin to those animals (data not shown). The effect of feeding was decreased by 50% (P < 0.05) and 80% (P < 0.01) in muscle and adipose tissues, respectively, from the ped/pea-15 transgenic mice. Again, the decrease in PKCζ/λ activation was accompanied by no significant change in the total PKCζ/λ levels in the tissues. The same changes in PKCα and ζ/λ were observed in male and female ped/pea-15 transgenic mice (data not shown).
PED/PEA-15 is a phospholipase D interactor and increases phospholipase D cellular activity by enhancing its expression level (34). We therefore compared the levels of the phospholipase D product diacylglycerol in extracts from transgenic and control tissues, as diacylglycerol is a major PKCα activator. As revealed by thin-layer chromatography analysis, there diacylglycerol levels in subcutaneous and perigonadal adipose tissues from the ped/pea-15 transgenic mice were increased >2-fold (Fig. 6d; P < 0.01). In tibialis muscles from ped/pea-15 transgenic mice, diacylglycerol levels were also increased by 60% (P < 0.05) over that in the nontransgenic mice. Thus, diacylglycerol levels in fat and skeletal muscle tissues correlated with PED/PEA-15-induced PKCα activity in these tissues. PLD1 expression was also two- and fivefold higher in muscle and adipose tissues, respectively, from transgenic versus control mice (Fig. 6c; P < 0.001). This additional finding suggested that increased phospholipase activity is at least one of the mechanisms determining the high diacylglycerol levels in the tissues of the transgenic mice.
The significance of these findings to the impaired insulin-stimulated glucose uptake in tissues from ped/pea-15 transgenic mice was addressed further in adipocytes isolated from the animals. Consistent with the fat tissue, isolated adipocytes from the transgenic mice showed an almost fivefold decrease in insulin-induced glucose uptake compared to control cells (P < 0.01; Fig. 7a). Bisindolylmaleimide incubation reduced PKCα activity by fourfold in both wild-type and transgenic mouse adipocytes (P < 0.01; Fig. 7b). Simultaneously, bisindolylmaleimide almost completely rescued insulin-stimulated glucose uptake in transgenic mouse adipocytes (Fig. 7a). Preincubation with the phospholipase D inhibitor propanolol also caused a >50% reduction in diacylglycerol and PKCα activity in adipocytes from transgenic as well as control mice. As with bisindolylmaleimide, these changes were accompanied by a significant recovery of insulin-stimulated glucose uptake, indicating an important role of the phospholipase D/PKCα pathway in alteration of glucose uptake by ped/pea-15.
FIG. 7.

Bisindolylmaleimide and propanolol effects on 2-deoxyglucose uptake in epididymal fat adipocytes from ped/pea-15 transgenic mice. Adipocytes from transgenic (Tg) and control (C) mice were incubated with 100 nM bisindolylmaleimide (BDM) or 150 μM propanolol for 30 min, as indicated; 100 nM insulin (final concentration) was then added, and the cells were assayed for 2-deoxyglucose uptake (a). Lysates of adipocytes from transgenic and control mice were immunoprecipitated with PKCα antibodies, followed by determination of PKC activity (b), as described under Materials and Methods. Alternatively, the cells were extracted and diacylglycerol (DAG) levels were determined as described under Materials and Methods (c). Bars represent the means ± standard deviation of duplicate determinations in four (2-deoxyglucose uptake), three (PKCα activity), and five (diacylglycerol levels) independent experiments with fat pads from five transgenic and five control mice. Asterisks denote statistically significant differences (**, P < 0.001).
Activation of the phosphatidylinositol 3-kinase/Akt/protein kinase B (PKB) pathway is a major event leading to stimulation of GLUT4 translocation by insulin. However, insulin injection caused a twofold activation of phosphatidylinositol 3-kinase in skeletal muscles from both transgenic and control mice (Fig. 8a). Based on immunoblotting with specific phospho-Ser473 Akt antibodies, Akt/PKB activity was also normally induced by insulin in transgenic muscles (Fig. 8b), with no gender-related difference (data not shown). It therefore appeared that dysregulation of PKC signaling is a major mechanism responsible for ped/pea-15-induced resistance to insulin action in glucose uptake, independently of the phosphatidylinositol 3-kinase/Akt/PKB pathway. The mechanism of ped/pea-15 inhibition of insulin-stimulated glucose uptake is shown schematically in Fig. 8c.
FIG. 8.
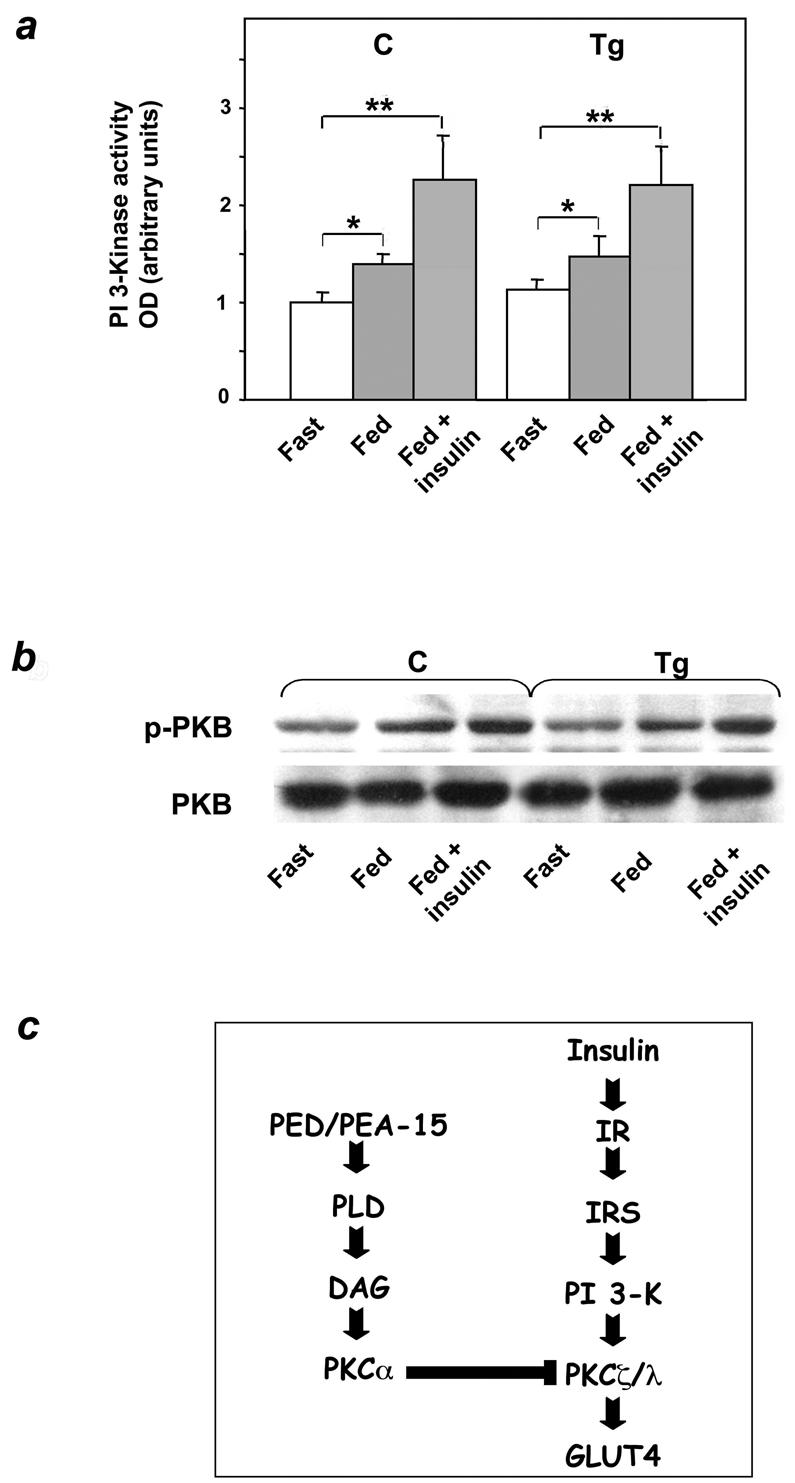
Activation of phosphatidylinositol 3-kinase and Akt in ped/pea-15 transgenic mice. (a) Weight-matched female mice were fasted overnight or fed ad libitum, followed by intraperitoneal insulin injection (0.75 mU g of body weight−1), as indicated. Animals were sacrificed, and the tibialis muscles were collected, homogenized, and assayed for phosphatidylinositol (PI) 3-kinase activity as described under Materials and Methods. Bars represent the mean ± standard deviation of data from five mice per group. The difference in insulin-induced PKB in transgenic versus control mice was not statistically significant. (b) Alternatively, tissue lysates were Western blotted with either PKB or phospho-PKB antibodies. Filters were revealed by enhanced chemiluminescence and autoradiography. The autoradiographs shown are representative of four independent experiments. (c) Proposed mechanism of PED action on insulin-stimulated glucose transport (details in the text). Asterisks denote statistically significant differences (*, P < 0.05; **, P < 0.01).
Glucose-regulated insulin secretion in ped/pea-15 transgenic mice.
Based on insulin tolerance tests, ped/pea-15 transgenic mice developed only a further 20% increase in insulin resistance after the high-fat diet (Fig. 9a; difference from animals fed the standard diet was significant at the P < 0.05 level). In comparison, nontransgenic mice underwent a 60% reduction in their sensitivity to insulin (P < 0.01), and became as insulin resistant as their transgenic littermates (difference from transgenic mice not significant). Nevertheless, nontransgenic mice showed little change in glucose tolerance after the high-fat diet, while ped/pea-15 transgenic mice developed diabetes (Fig. 3c). We therefore hypothesized that resistance to insulin action alone is not sufficient to cause the alteration in glucose tolerance of the ped/pea-15 transgenic mice.
FIG. 9.

Insulin secretion in ped/pea-15 transgenic mice. (a) Transgenic (Tg) and control (C) female mice were fed either a 10% fat standard or a 60% high-fat diet for 10 weeks. Weight-matched animals were then subjected to intraperitoneal insulin tolerance tests as outlined in the legend to Fig. 4. The effect of the high-fat diet on insulin tolerance is expressed as total areas under the curve (glucose AUC). Bars represent the mean ± standard deviation of data from seven mice per group. Asterisks denote statistically significant differences versus mice maintained on the standard diet (*, P < 0.05; **, P < 0.01; ***, P < 0.001). (b) Overexpression of ped/pea-15 in pancreas from ped/pea-15 transgenic mice. Pancreas from ped/pea-15 male transgenic mice (Tg) and their nontransgenic littermates (C) were fixed and embedded in Tissue-Tek OTC, and sections were prepared as described under Materials and Methods. Immunohistochemical analysis of the islets was carried out with PED/PEA-15, insulin, and glucagon antibodies as indicated. Anti-rabbit or anti-goat immunoglobulin G was used as the second antibody. Immunoreactivity was revealed by peroxidase-labeled streptavidin. The microphotographs shown are representative of images obtained from eight transgenic (four male and four female) and seven nontransgenic mice (three male and four female). (c) Weight-matched transgenic and control mice were subjected to intraperitoneal glucose loading as outlined in the legend to Fig. 2, followed by determination of plasma insulin levels at the indicated times. Data points represent the mean ± standard deviation of determinations in 14 transgenic (seven female and seven male) and 16 control mice (eight female and eight male). Differences between control and transgenic mice were statistically significant, as indicated in the text.
To address this possibility, we first analyzed the expression of ped/pea-15 in beta cells of the transgenic mice. Staining of pancreas sections with specific PED/PEA-15 antibodies revealed a significant increase in the immunoreactivity of the islet cores, where beta cells are localized, in L1 transgenic compared to control mice (Fig. 9b). At variance, both insulin and glucagon immunoreactivities were comparable in ped/pea-15 transgenic mice and controls. We next compared insulin secretion following a glucose load in L1 ped/pea-15 transgenic mice and in their nontransgenic littermates. In control mice, a five- to sixfold increase in insulin secretion was observed 2 min after intraperitoneal glucose injection, and the levels remained higher than baseline values for up to 30 min, indicating a second-phase response (Fig. 9c). Based on insulin area under the curve quantitation, the acute first-phase insulin secretory response to glucose was reduced by almost 70% in transgenic mice (P < 0.001). The second-phase response was also significantly impaired in ped/pea-15 transgenic mice compared to control mice (P < 0.01). Almost identical decreases in early and late insulin responses were observed in both male and female transgenic mice. Again, defective insulin secretion was also observed with the L30 and L61 mouse lines (data not shown).
To test the further hypothesis that overexpression of ped/pea-15 is sufficient to impair hyperglycemia-induced insulin secretion, we generated MIN6 beta-cell lines stably overexpressing ped/pea-15 by 3- to 10-fold above endogenous levels (Fig. 10a). We then compared insulin secretion in these cells and in cells expressing only endogenous ped/pea-15. MIN6 control cells responded with a fivefold induction in insulin secretion when subjected to physiological increases in the glucose concentration in the medium (Fig. 10b). In these same cells, the overexpression of ped/pea-15 increased basal insulin secretion (30 to 80%, P < 0.01) and reduced that induced by glucose by 50 to 90% (P < 0.001). These changes closely correlated with the expression levels of ped/pea-15 achieved in the cells. Treatment with a specific antisense oligonucleotide effectively blocked ped/pea-15 expression and almost completely rescued the abnormal insulin secretion in the ped/pea-15 overexpressors (Fig. 10c and d). More importantly, antisense transfection of cells expressing only the endogenous ped/pea-15 enhanced glucose-induced insulin secretion by >2-fold, indicating that this gene has a physiological role in controlling beta-cell secretion in response to glucose.
FIG. 10.

Insulin secretion in ped/pea-15-overexpressing MIN6 cells. (a) MIN6 beta cells were stably transfected with ped/pea-15 cDNA. Several clones overexpressing ped/pea-15 by 3-, 5-, and 10-fold were selected. Three clones were further characterized (termed clones a, b, and c). (b) Transfected cell clones, untransfected cells (NT), and cells transfected with the empty plasmid (PC) were stimulated with either 0.1 mM glucose (open bars) or 16.7 mM glucose (dashed bars), and insulin was assayed in the culture medium as described in the text. Bars represent values ± standard deviation of triplicate measurements in five independent experiments. The differences between ped/pea-15-overexpressing (all clones) and control cells (whether untransfected or transfected with the empty plasmid) were significant at P < 0.01 (basal secretion) and P < 0.001 (glucose-induced secretion). (c) Alternatively, control cells transfected with the empty plasmid (PC) or clone c (Cl.c) cells were transfected either with ped/pea-15 antisense (AS) or with scrambled (SC) oligonucleotides. (d) Glucose-stimulated insulin secretion was assayed as outlined above. Bars represent values ± standard deviation of triplicate measurements in four independent experiments. Basal insulin secretion differences in the antisense versus scrambled oligonucleotide-treated cells were significant at P < 0.001 (empty plasmid-transfected cells) and P < 0.01 (clone c cells). Glucose-stimulated secretion differences in the antisense versus scrambled oligonucleotide-treated cells were also significant at the P < 0.001 (empty plasmid-transfected cells) and P < 0.01 levels (clone c cells).
As in other cell types, overexpression of ped/pea-15 in MIN6 cells also caused a twofold activation of PKCα (Fig. 11a, P < 0.001). Moreover, phospholipase D 1 and diacylglycerol levels in ped/pea-15 overexpressing MIN6 cells were increased compared to those in control cells by 2.5- and 3-fold, respectively (Fig. 11b and c, P < 0.001). Thus, activation of the phospholipase D/PKC pathway also occurs in beta cells overexpressing ped/pea-15.
FIG. 11.

PKCα activity, phospholipase D1 expression, and diacylglycerol levels in ped/pea-15-overexpressing MIN6 cells. MIN6 beta cells stably transfected with ped/pea-15 cDNA (clone c) or the empty vector (empty plasmid-transfected cells [PC]) and untransfected cells (NT) were assayed for PKCα activity (a), phospholipase D1 (PLD1) expression (b), and diacylglycerol (DAG) (c) levels as outlined in the legend to Fig. 6. Western-blotted phospholipase D1 bands were revealed by enhanced chemiluminescence and autoradiography and quantitated by laser densitometry. Bars represent the means ± standard deviation of four (PKCα and phospholipase D1), and five (diacylglycerol) independent determinations. Based on t test analysis, the differences between ped/pea-15-overexpressing and control cells were significant at the P < 0.001 level.
DISCUSSION
Analysis of the gene expression profile revealed increased expression of the ped/pea-15 gene in skeletal muscle and adipose tissues from individuals with type 2 diabetes (7). More recently, 5- to 20-fold overexpression of ped/pea-15 has been demonstrated to occur in almost 30% of the type 2 diabetics in a large Italian cohort, indicating that increased expression of the ped/pea-15 gene is a common abnormality in this form of diabetes (R. Valentino and F. Beguinot, unpublished data). In other studies, we reported that overexpression of ped/pea-15 in cultured skeletal muscle cells and adipocytes impairs insulin action on glucose transport and cell surface recruitment of GLUT4 (7, 8). However, whether the ped/pea-15 defect alone impairs glucose tolerance in vivo remains unknown.
In the present work, we report that transgenic mice overexpressing ped/pea-15 to levels comparable to those occurring in human type 2 diabetes exhibit mildly elevated random-fed blood glucose levels and become hyperglycemic after glucose loading, indicating that increased expression of this gene is sufficient to impair glucose tolerance. Moreover, ped/pea-15 transgenic mice become diabetic when body weight increases through administration of high-fat diets. This additional finding suggests an important interaction of environmental modifiers with ped/pea-15 gene function, leading to a further derangement in glucose tolerance. Based on the insulin tolerance tests, ped/pea-15 transgenic mice are much more insulin resistant than their nontransgenic littermates. The transgenic mice were consistently markedly hyperinsulinemic in the basal state and exhibited increased free fatty acid levels in blood. The transgenic mice also show reduced insulin response to a glucose challenge, indicating that the overexpression of ped/pea-15 impairs insulin secretion in addition to insulin action. In addition, we found that, when fed high-fat diets, these animals become as insulin resistant as their nontransgenic littermates. Nevertheless, ped/pea-15 transgenic mice develop random hyperglycemia while control animals remain euglycemic. It therefore appears that both decreased glucose-stimulated insulin secretion and impaired insulin action contribute to the abnormal glucose tolerance determined by ped/pea-15 gene overexpression.
Decreased insulin sensitivity in ped/pea-15 transgenic mice might have been determined by the increased free fatty acids (1, 3, 27). However, it is unlikely that higher free fatty acid levels in ped/pea-15 transgenic mice could completely account for insulin resistance, as ped/pea-15 overexpression also impairs insulin action on glucose uptake in cultured cells (7, 8). Previous studies in yeasts as well as in eukaryotic cells showed that ped/pea-15 gene encodes a phospholipase D interactor (35). Importantly, in cultured cells, binding to PED/PEA-15 protein stabilizes the phospholipase, leading to enhanced phospholipase activity (35). In L6 skeletal muscle cells stably overexpressing ped/pea-15, inhibition of phospholipase D activity rescues insulin action on glucose transport (our unpublished observations), underlining the importance of proper phospholipase D function for normal insulin sensitivity of the insulin-regulated glucose transport system. In addition, our previous work has shown that L6 cells overexpressing ped/pea-15 feature constitutive activation of the classical PKC isoform PKCα (8). Activation of PKCα by ped/pea-15, in turn, determines almost complete loss of PKCζ/λ sensitivity to insulin and of insulin action on glucose transport in these cells (8).
We now show that muscle and fat tissues from ped/pea-15 transgenic mice also feature reduced insulin action on glucose transport and PKCζ/λ activation and, simultaneously, increased PKCα activity and phospholipase D levels. Transgenic tissues also exhibit increased levels of diacylglycerol, a major activator of PKCα. The same abnormalities persist in epididymal fat pad adipocytes from ped/pea-15 transgenic mice. In these cells, as in L6 muscle cells overexpressing ped/pea-15 (8), pharmacological block of PKCα or phospholipase D activities rescues insulin-stimulated glucose transport. Thus, the overexpression of ped/pea-15 in tissues from the transgenic mice seems to determine insulin resistance in glucose disposal by inhibiting PKCζ/λ function through the induction of PKCα (Fig. 7). Consistent with this mechanism, Leitges et al. have recently shown that elimination of the PKCα gene by homologous recombination enhances insulin signaling and action on glucose transport in mice (22).
Insulin-induced activation of atypical PKCs is markedly impaired in tissues of type 2 diabetic individuals as well as in those from animal models of type 2 diabetes (12, 17, 18, 19). This abnormality has been proposed to account for the decreased insulin-stimulated glucose disposal observed during hyperinsulinemic-euglycemic clamps in type 2 diabetic humans and monkeys (12). The defective activation of atypical PKCs in skeletal muscle from type 2 diabetic individuals was also shown to be independent of PKC protein levels and accompanied by normal activation of phosphatidylinositol 3-kinase and Akt by insulin (12, 19, 20). Based on those studies, however, the mechanism responsible remains unclear. The finding that ped/pea-15 gene overexpression impairs glucose disposal in major insulin target tissues by inhibiting insulin activation of PKCζ/λ indicates that, at least in part, the impaired glucose utilization in type 2 diabetics can be accounted for by increased levels of ped/pea-15. In fact overexpression of ped/pea-15 was found to represent a common abnormality in type 2 diabetes (7), and this defect does not determine changes in phosphatidylinositol 3-kinase or Akt activation by insulin in either cultured skeletal muscle cells (7, 8) or muscle tissue from ped/pea-15 transgenic mice.
The abnormal beta-cell function in ped/pea-15 transgenic mice might have been caused by the metabolic consequences of insulin resistance. More likely, ped/pea-15 overexpression directly impairs beta-cell function. In fact, we have shown that ped/pea-15 overexpression in cultured beta cells causes a twofold increase in basal insulin secretion and inhibits that induced by glucose. Thus, beta-cell overexpression may contribute to the basal hyperinsulinemia found in ped/pea-15 transgenic mice while rendering them unable to compensate for hyperglycemia by further increasing plasma insulin levels. Similar to other tissues from the transgenic mice, overexpression of ped/pea-15 in cultured beta cells led to activation of the phospholipase D/PKCα pathway. At variance with insulin-regulated glucose transport, however, PKCα inhibition allowed only partial reversal of the insulin secretion defect in ped/pea-15-overexpressing beta cells (data not shown). Thus, abnormal PKCα signaling might contribute to the secretion abnormalities in these cells. Whether different mechanisms play a major role and the identity of these mechanisms remain to be defined and are presently under investigation in our laboratory.
The control of glucose-regulated insulin secretion appears to represent a physiological function of ped/pea-15 in beta cells. Hence, transfection of a specific antisense oligonucleotide into MIN6 cells expressing only endogenous ped/pea-15 enhanced glucose-induced insulin secretion by almost threefold. This additional finding identifies ped/pea-15 as a novel gene controlling insulin secretion in addition to insulin action. Under appropriate environmental conditions, ped/pea-15 overexpression leads to diabetes by impairing both of these functions and may contribute to genetic susceptibility to type 2 diabetes in humans.
Acknowledgments
This work was supported in part by the European Community (grant QLRT-1999-00674 to F.B., EUDG program), grants from the Associazione Italiana per la Ricerca sul Cancro (to F.B. and P.F.) and the Ministero dell'Università e della Ricerca Scientifica (PRIN to F.B. and P.F. and FIRB RBNE0155LB). The financial support of Telethon Italy is gratefully acknowledged (grants E.0896 to F.B. and C.40 to C.T.). M.A. Maitan and F. Fiory are recipients of fellowships from the Federazione Italiana per la Ricerca sul Cancro.
The technical help of Maria Russo and Salvatore Sequino is also acknowledged.
REFERENCES
- 1.Arner, P. 2002. Insulin resistance in type 2 diabetes: role of fatty acids. Diabetes Metab. Res. Rev. 18(Suppl. 2):S5-S9. [DOI] [PubMed] [Google Scholar]
- 2.Bell, G. I., and K. S. Polonsky. 2001. Diabetes mellitus and genetically programmed defects in beta-cell function. Nature 414:788-791. [DOI] [PubMed] [Google Scholar]
- 3.Boden, G., and G. I. Shulman. 2002. Free fatty acids in obesity and type 2 diabetes: defining their role in the development of insulin resistance and beta-cell dysfunction. Eur. J. Clin. Investig. 32(Suppl. 3):14-23. [DOI] [PubMed] [Google Scholar]
- 4.Caruso, M., C. Miele, A. Oliva, G. Condorelli, F. Oriente, G. Riccardi, B. Capaldo, F. Fiory, D. Accili, P. Formisano, and F. Beguinot. 2000. The IR1152 mutant insulin receptor selectively impairs insulin action in skeletal muscle but not in liver. Diabetes 49:1194-1202. [DOI] [PubMed] [Google Scholar]
- 5.Condorelli, G., A. Trencia, G. Vigliotta, A. Perfetti, U. Goglia, A. Cassese, A. M. Musti, C. Miele, S. Santopietro, P. Formisano, and F. Beguinot. 2002. Multiple members of the mitogen-activated protein kinase family are necessary for PED/PEA-15 anti-apoptotic function. J. Biol. Chem. 277:11013-11018. [DOI] [PubMed] [Google Scholar]
- 6.Condorelli, G., G. Vigliotta, A. Cafieri, A. Trencia, P. Andalo, F. Oriente, C. Miele, M. Caruso, P. Formisano, and F. Beguinot. 1999. PED/PEA-15: an anti-apoptotic molecule that regulates FAS/TNFR1-induced apoptosis. Oncogene 18:4409-4415. [DOI] [PubMed] [Google Scholar]
- 7.Condorelli, G., G. Vigliotta, C. Iavarone, M. Caruso, C. G. Tocchetti, F. Andreozzi, A. Cafieri, M. F. Tecce, P. Formisano, L. Beguinot, and F. Beguinot. 1998. PED/PEA-15 gene controls glucose transport and is overexpressed in type 2 diabetes mellitus. EMBO J. 17:3858-3866. [DOI] [PMC free article] [PubMed] [Google Scholar]
- 8.Condorelli, G., G. Vigliotta, A. Trencia, M. A. Maitan, M. Caruso, C. Miele, F. Oriente, S. Santopietro, P. Formisano, and F. Beguinot. 2001. Protein kinase C (PKC)-alpha activation inhibits PKC-zeta and mediates the action of PED/PEA-15 on glucose transport in the L6 skeletal muscle cells. Diabetes 50:1244-1252. [DOI] [PubMed] [Google Scholar]
- 9.Czech, M. P. 1980. Insulin action and the regulation of hexose transport. Diabetes 39:399-409. [DOI] [PubMed] [Google Scholar]
- 10.DeFronzo, R. A. 1995. Pathogenesis of type 2 diabetes: metabolic and molecular implications for identifying diabetes genes. Diabetes Rev. 5:177-269. [Google Scholar]
- 11.Estelles, A., C. A. Charlton, and H. M. Blau. 1999. The phophoprotein protein PEA-15 inhibits Fas- but increases TNF-R1-mediated caspase-8 activity and apoptosis. Dev. Biol. 216:16-28. [DOI] [PubMed] [Google Scholar]
- 12.Farese, R. V. 2002. Function and dysfunction of aPKC isoforms for glucose transport in insulin-sensitive and insulin-resistant states. Am. J. Physiol. Endocrinol. Metab. 283:E1-E11. [DOI] [PubMed] [Google Scholar]
- 13.Filippa, N., C. L. Sable, C. Filloux, B. Hemmings, and E. Van Obberghen. 1999. Mechanism of protein kinase B activation by cyclic AMP-dependent protein kinase. Mol. Cell. Biol. 19:4989-5000. [DOI] [PMC free article] [PubMed] [Google Scholar]
- 14.Formstecher, E., J. W. Ramos, M. Fauquet, D. A. Calderwood, J. C. Hsieh, B. Canton, X. T. Nguyen, J. V. Barnier, J. Camonis, M. H. Ginsberg, and H. Chneiweiss. 2001. PEA-15 mediates cytoplasmic sequestration of ERK MAP kinase. Dev. Cell 1:239-250. [DOI] [PubMed] [Google Scholar]
- 15.Hao, C., F. Beguinot, G. Condorelli, A. Trencia, E. G. Van Meir, V. W. Yong, I. F. Parney, W. H. Roa, and K. C. Petruk. 2001. Induction and intracellular regulation of tumor necrosis factor-related apoptosis-inducing ligand (TRAIL) mediated apoptosis in human malignant glioma cells. Cancer Res. 61:1162-1170. [PubMed] [Google Scholar]
- 16.Kahn, C. R. 1994. Insulin action, diabetogenes, and the cause of type II diabetes. Diabetes 43:1066-1084. [DOI] [PubMed] [Google Scholar]
- 17.Kanoh, Y., G. Bandyopadhyay, M. P. Sajan, M. L. Standaert, and R. V. Farese. 2000. Thiazolidinedione treatment enhances insulin effects on protein kinase C-ζ/λ activation and glucose transport in adipocytes of nondiabetic and Goto-Kakizaki type II diabetic rats. J. Biol. Chem. 275:16690-16696. [DOI] [PubMed] [Google Scholar]
- 18.Kanoh, Y., G. Bandyopadhyay, M. P. Sajan, M. L. Standaert, and R. V. Farese. 2001. Rosiglitazone, insulin treatment, and fasting correct defective activation of protein kinase C-ζ/λ by insulin in vastus laterlais muscles and adipocytes of diabetic rats. Endocrinology 142:1595-1605. [DOI] [PubMed] [Google Scholar]
- 19.Kim, Y. B., K. Kotani, T. P. Ciaraldi, R. V. Farese, R. R. Henry, and B. B. Kahn. 2001. Insulin-stimulated PKCζ/λ activity is impaired in muscles of insulin resistant subjects. Diabetes 250(Suppl. 2):A62. [Google Scholar]
- 20.Kim, Y. B., S. E. Nikoulina, T. P. Ciaraldi, R. R. Henry, and B. B. Kahn. 1999. Normal insulin-dependent activation of Akt/protein kinase B, with diminished activation of phophoinositide 3-kinase in muscle in type 2 diabetes. J. Clin. Investig. 104:733-741. [DOI] [PMC free article] [PubMed] [Google Scholar]
- 21.Laemmli, U. K. 1970. Cleavage of structural proteins during the assembly of the head of bacteriophage T4. Nature 227:680-685. [DOI] [PubMed] [Google Scholar]
- 22.Leitges, M., M. Plomann, M. L. Standaert, G. Bandyopadhyay, M. P. Sajan, Y. Kanoh, and R. V. Farese. 2002. Knockout of PKCα enhances insulin signaling through PI3K. Mol. Endocrinol. 16:847-858. [DOI] [PubMed] [Google Scholar]
- 23.Miyazaki, J., K. Araki, E. Yamato, H. Ikegami, T. Asano, Y. Shibasaki, Y. Oka, and K. Yamamura. 1990. Establishment of a pancreatic beta cell line that retains glucose-inducible insulin secretion: special reference to expression of glucose transporter isoforms. Endocrinology 127:126-132. [DOI] [PubMed] [Google Scholar]
- 24.Pinget, M., and S. Boullu-Sanchis. 2002. Physiological basis of insulin secretion abnormalities. Diabetes Metab. 28(Suppl. 6):S7-S13. [PubMed] [Google Scholar]
- 25.Preiss, J. E., C. R. Loomis, R. M. Bell, and J. E. Niedel. 1987. Quantitative measurement of sn-1,2-diacylglycerols. Methods Enzymol. 141:294-299. [DOI] [PubMed] [Google Scholar]
- 26.Qu, X., J. P. Seale, and R. Donnelly. 1999. Tissue and isoform-selective activation of protein kinase C in insulin-resistant obese Zucker rats—effects of feeding. J. Endocrinol. 162:207-214. [DOI] [PubMed] [Google Scholar]
- 27.Reaven, G. M. 1988. Role of insulin resistance in human diabetes. Diabetes 37:1595-1607. [DOI] [PubMed] [Google Scholar]
- 28.Rodbell, M. 1964. Metabolism of isolated fat cells. J. Biol. Chem. 239:173-181. [PubMed] [Google Scholar]
- 29.Russ, M., A. Wichelhaus, I. Uphues, T. Kolter, and J. Eckel. 1994. Photoaffinity labelling of cardiac membrane GTP-binding proteins in response to insulin. Eur. J. Biochem. 219:325-330. [DOI] [PubMed] [Google Scholar]
- 30.Trencia, A., A. Perfetti, A. Cassese, G. Vigliotta, C. Miele, F. Oriente, S. Santopietro, F. Giacco, G. Condorelli, P. Formisano, and F. Beguinot. 2003. Protein kinase B/Akt binds and phosphorylates PED/PEA-15, stabilizing its antiapoptotic action. Mol. Cell. Biol. 23:4511-4521. [DOI] [PMC free article] [PubMed] [Google Scholar]
- 31.Turinsky, J., B. P. Bayly, and D. M. O'Sullivan. 1990. 1,2-Diacylglycerol and ceramide levels in rat skeletal muscle and liver in vivo. J. Biol. Chem. 265:7933-7938. [PubMed] [Google Scholar]
- 32.Uphues, I., T. Kolter, B. Goud, and J. Eckel. 1995. Failure of insulin-regulated recruitment of the glucose transporter GLUT4 in cardiac muscle of obese Zucker rats is associated with alterations of small-molecular-mass GTP-binding proteins. Biochem. J. 311:161-166. [DOI] [PMC free article] [PubMed] [Google Scholar]
- 33.White, M. F. 2002. IRS proteins and the common path to diabetes. Am. J. Physiol. Endocrinol. Metab. 283:E413-E422. [DOI] [PubMed] [Google Scholar]
- 34.Xiao, C., B. F. Yang, N. Asadi, F. Beguinot, and C. Hao. 2002. Tumor necrosis factor-related apoptosis-inducing ligand-induced death-inducing signaling complex and its modulation by c-FLIP and PED/PEA-15 in glioma cells. J. Biol. Chem. 277:25020-25025. [DOI] [PubMed] [Google Scholar]
- 35.Zhang, Y., O. Redina, Y. M. Altshuller, M. Yamazaki, J. Ramos, H. Chneiweiss, Y. Kanaho, and M. A. Frohman. 2000. Regulation of expression of phospholipase D1 and D2 by PEA-15, a novel protein that interacts with them. J. Biol. Chem. 275:35224-35232. [DOI] [PubMed] [Google Scholar]
- 36.Zimmet, P., K. G. Alberti, and J. Shaw. 2001. Global and societal implications of the diabetes epidemic. Nature 414:782-787. [DOI] [PubMed] [Google Scholar]
- 37.Zisman, A., O. D. Peroni, E. D. Abel, M. D. Michael, F. Mauvais-Jarvis, B. B. Lowell, J. F. Wojtaszewski, M. F. Hirshman, A. Virkamaki, L. J. Goodyear, C. R. Kahn, and B. B. Kahn. 2000. Targeted disruption of the glucose transporter 4 selectively in muscle causes insulin resistance and glucose intolerance. Nat. Med. 6:924-928. [DOI] [PubMed] [Google Scholar]