

Abstract
Background
The optimal glycaemic control target in pregnant women with pre-existing diabetes is unclear, although there is a clear link between high glucose concentrations and adverse birth outcomes.
Objectives
To assess the effects of different intensities of glycaemic control in pregnant women with pre-existing type 1 or type 2 diabetes.
Search methods
We searched the Cochrane Pregnancy and Childbirth Group’s Trials Register (30 April 2012).
Selection criteria
We included randomised controlled trials comparing different glycaemic control targets in pregnant women with pre-existing diabetes.
Data collection and analysis
Two review authors assessed trial eligibility and risk of bias, and extracted data.
Main results
We included three trials all in women with type 1 diabetes (223 women and babies), and all with a high risk of bias. Two trials compared very tight (3.33 to 5.0 mmol/L fasting blood glucose (FBG)) with tight-moderate (4.45 to 6.38) glycaemic control targets, with one trial of 22 babies reporting no perinatal deaths or serious perinatal morbidity. In the same trial, there were two birth defects in the very tight and none in the tight-moderate group with no significant differences in caesarean section between groups (risk ratio 0.92, 95% confidence interval (CI) 0.49 to 1.73). In these two trials glycaemic control was not significantly different between the very tight and tight-moderate groups by the third trimester, although one trial of 22 women found significantly less maternal hypoglycaemia in the tight-moderate group.
In a trial of 60 women and babies comparing tight ( 5.6 mmol/L FBG); moderate (5.6 to 6.7); and loose (6.7 to 8.9) glycaemic control targets, there were two neonatal deaths in the loose and none in the tight or moderate groups. There were significantly fewer women with pre-eclampsia, fewer caesareans and fewer birthweights greater than 90th centile in the combined tight-moderate compared with the loose group.
Authors’ conclusions
In a very limited body of evidence, few differences in outcomes were seen between very tight and tight-moderate glycaemic control targets in pregnant women with pre-existing type 1 diabetes, including actual glycaemic control achieved. There is evidence of harm (increased pre-eclampsia, caesareans and birthweights greater than 90th centile) for ‘loose’ control (FBG above 7 mmol/L). Future trials comparing interventions, rather than glycaemic control targets, may be more feasible particularly for pregnant women with type 2 diabetes.
Medical Subject Headings (MeSH): Blood Glucose [*metabolism]; Diabetes Mellitus, Type 1 [blood; *therapy]; Diabetes Mellitus, Type 2 [blood]; Fasting [blood]; Hemoglobin A, Glycosylated [metabolism]; Hyperglycemia [blood; therapy]; Hypoglycemic Agents [therapeutic use]; Infant, Newborn; Insulin [therapeutic use]; Pregnancy in Diabetics [blood; *therapy]; Randomized Controlled Trials as Topic; Reference Values
MeSH check words: Female, Humans, Pregnancy
BACKGROUND
Description of the condition
Diabetes and pregnancy
Recent figures from the USA and the UK indicate that between 0.5% and 0.75% pregnant women have pre-existing diabetes (type 1 or type 2) (Albrecht 2010; Bell 2008). Other studies have recorded similar levels of pre-existing type 1 and type 2 diabetes in pregnant women (McElduff 2005a; McElduff 2005b). Albrecht 2010 noted that the rate of pre-existing type 2 diabetes more than quadrupled in the period from 1994 to 2004, so that it is now more common than pre-existing type 1 diabetes (0.42% versus 0.33% in this study). The increase in type 2 diabetes in pregnant women has been partly attributed to increasing obesity (ACOG 2005) and others have noted the striking association between type 2 diabetes and socio-economic status (Murphy 2009).
Type 1 diabetes usually occurs early in life with a sudden onset of insulin deficiency, thought to be a result of an autoimmune attack of the insulin producing pancreatic beta-cells (Galerneau 2004; Griffith 2004). Type 2 diabetes mellitus tends to occur later in adulthood rather than in childhood and is characterised by tissue resistance to the action of insulin as well as abnormalities of insulin secretion, thereby increasing the levels of glucose in the blood (Dunne 2005). Gestational diabetes is characterised by glucose intolerance that begins or is first detected during pregnancy and is not covered in this review. A review on ‘Different techniques of blood glucose monitoring in women with gestational diabetes for improving maternal and infant health’ is currently being prepared (Pelaez-Crisologo 2009).
The presence of diabetes increases the risk of poor fetal and neonatal outcomes, as well as the risk of poorer outcomes for the mother. Women with type 1 diabetes have an elevated risk of pregnancy loss, perinatal mortality, fetal macrosomia (a fetus which is large for gestational age) and congenital malformations (Platt 2002). This is also true for women with pre-existing type 2 diabetes (CEMACH 2007; Inkster 2006); and women with type 2 diabetes may even have higher rates of adverse outcomes than women with type 1 diabetes (Kinsley 2007). A recent systematic review found perinatal mortality to be higher for women with type 2 compared with type 1 diabetes - odds ratio 1.50 95% confidence interval 1.15 to 1.96 (Balsells 2009).
Metabolic disruptions resulting from a hyperglycaemic and insulin-resistant fetal environment can affect organogenesis (development of organs) in early pregnancy. Cardiovascular malformations are the most common birth defects in infants born to diabetic mothers (Inkster 2006). Apart from macrosomia (high birth-weight, often defined as greater than 4000 g), other adverse outcomes for infants may include large-for-gestational age, shoulder dystocia (difficulty in delivering shoulders of baby), neonatal hypoglycaemia (blood sugar which is lower than normal), preterm birth, hyperbilirubinaemia (excess bilirubin), hypocalcaemia (lower than normal calcium) and neonatal intensive care admission (Jensen 2004; Macintosh 2006; Ray 2001; Walkinshaw 2005; Weintrob 1996). Furthermore, long-term follow-up of infants of diabetic mothers suggests that exposure to maternal diabetes in utero increases the risk of obesity and type 2 diabetes for these children in the future (Dabelea 2000).
In pregnant women with type 1 (insulin-dependent) diabetes, insulin is used to control fluctuations in blood glucose levels throughout the day (Galerneau 2004). In type 2 diabetes, lifestyle changes (including diet and exercise) are the first line of treatment, with the option of using oral hypoglycaemic agents or insulin to lower blood glucose if necessary. Management of diabetes in pregnancy therefore aims for control of glucose levels using careful combinations of diet, exercise and insulin or other anti-diabetogenic drugs, if required (ACOG 2005).
Description of the intervention
The intervention of interest in this review is treatment to achieve different glycaemic control targets (e.g. low or tight versus very low or very tight) rather than comparing different treatment strategies, the more usual intervention employed in diabetes trials (Home 2008). In other words, trials eligible for this review will have randomised women to intensive versus more intensive glycaemic targets, whereas comparisons of different treatments have glycaemic control as an outcome, not an intervention.
Glycaemic control
The goal of glycaemic control is to keep glucose concentrations as close to normal as possible by monitoring glycated haemoglobin (haemoglobin A1c (HbA1c)) which reflects glycaemic control over the preceding 60 to 90 days (Colman 1997); or by measuring blood glucose concentrations (e.g. fasting or postprandial concentrations, or from clinic or self-monitoring measurements) or both. Ideally women with type 1 or type 2 diabetes would be aiming for normal glucose concentrations before embarking on a pregnancy, but this is frequently not the case since many pregnancies are unplanned. In addition, some women with type 2 diabetes may not be aware that they are diabetic until they are screened later in pregnancy.
Ways of achieving more intensive glycaemic control regimens might include more frequent hospital visits, more intensive insulin therapy, home-based systems that involve setting specific targets, as well as higher level system changes such as regional standard setting, audit and feedback (Bell 2008).
Glycated haemoglobin (HbA1c)
Glycated haemoglobins are formed when glucose in the blood spontaneously reacts with the amino groups of the haemoglobin protein (Schneider 2007). HbA1c became firmly established as a critical diabetes control measure through the findings of the landmark Diabetes Control and Complications Trial which conclusively demonstrated that a sustained lowering of HbA1c was associated with significantly fewer microvascular complications, a marker of disease control (DCCT 1993; Schneider 2007).
For diabetic women of reproductive age, intensive periconceptional glycaemic control was subsequently shown to reduce the incidence of congenital anomalies and spontaneous abortions (DCCT 1996b; Ray 2001; Steel 1990; Willhoite 2007).
Some guidelines advise pregnant women with pre-existing type 1 and type 2 diabetes to monitor their HbA1c concentrations levels every four to eight weeks, aiming to keep them within the normal range (ADIPS 2005). Although HbA1c is normally lower in pregnancy, most laboratories do not report a pregnancy-specific reference range (ADIPS 2005). A recent international consensus statement has recommended a progression towards the use of Systeme International (SI) units (mmol/mol) for reporting of HbA1c levels, rather than the current units (percentage) (Jones 2011). It has been recommended in Australia that dual reporting for HbA1c (in the current units (percentage) and SI units) be used for an interim period (of two years, commencing July 2011), with the use of SI units only thereafter (Jones 2011). Generally 6% to 7% (42 mmol/mol to 53 mmol/mol) for type 1 and type 2 diabetic women who are pregnant, or planning a pregnancy, is regarded as a threshold below which complications are less likely (representing good or optimal control) (Jones 2011). Above 8% (64 mmol/mol) (poor control) may indicate a need to change treatment and management, but there is variation in the thresholds adopted by different bodies.
Results from a randomised trial of continuous glucose monitoring in pregnant women with pre-existing type 1 or type 2 diabetes show that HbA1c concentrations do not improve until the third trimester; suggesting that glycated haemoglobin takes some time to clear from the circulation (Murphy 2008).
The UK NICE Guidelines for Diabetes in Pregnancy suggest that “HbA1c is not a reliable indicator of glycaemic control in the second and third trimesters of pregnancy because of the physiological changes that occur in all pregnant women and lead to reduced HbA1c in women without diabetes, meaning that any apparent reduction ….. does not necessarily indicate improved glycaemic control” (NICE 2008).
Blood glucose concentrations
The UK NICE Guidelines recommend that women with diabetes should aim to keep fasting blood glucose between 3.5 and 5.9 mmol/litre and one-hour postprandial blood glucose below 7.8 mmol/litre during pregnancy, if this can be achieved without increasing the risk of hypoglycaemia (NICE 2008). The American College of Obstetricians and Gynecologists advises that mean capillary concentrations should be maintained at an average of 100 mg/dL (equivalent to 5.56 mmol/L) with HbA1c no higher than 6% (ACOG 2005).
Women with type 1 and type 2 diabetes are advised to self-monitor their blood glucose throughout pregnancy (ADIPS 2005). One method of self-monitoring is to use a memory-based glucose meter to record capillary glucose measurements several times a day which can be then downloaded into data collection systems (Sacks 2006).
Other related Cochrane reviews
Several Cochrane reviews address treatments or regimens for pregnant women with pre-existing diabetes. For example, Tieu 2010 has assessed ‘Oral anti-diabetic agents for women with pre-existing diabetes mellitus/impaired glucose tolerance or previous gestational diabetes mellitus’, and Farrar 2007 has assessed ‘Continuous subcutaneous insulin infusion versus multiple daily injections of insulin for pregnant women with diabetes’. While many other Cochrane reviews cover aspects of diabetes management in general (e.g. dietary advice, exercise, education, adherence, weight loss) it is not clear if the conclusions apply to pregnant women; and indeed some of the reviews have specifically excluded studies in pregnant women. A recent Cochrane review ‘Targeting intensive glycaemic control versus targeting conventional glycaemic control for type 2 diabetes mellitus’ has assessed the effects of glycaemic control in a general population, finding no significant difference in mortality, but fewer microvascular complications, for those patients with more stringent glycaemic control (Hemmingsen 2011).
How the intervention might work
Improving poor glycaemic control
In a small US study of 55 women, 61% with pre-existing diabetes entered their pregnancy with suboptimal control (HbA1c greater than 8%); and women who had not been advised to achieve target levels were more likely to have suboptimal HbA1c levels at the beginning of their pregnancy (Casele 1998). A systematic review of 13 observational studies with a total of 5480 women showed that poor glycated haemoglobin control during pregnancy was associated with increased risk of congenital malformations, miscarriage and perinatal mortality compared with optimal control (Inkster 2006).
Despite views that HBA1c is not a reliable indicator of glycaemic control in pregnancy (NICE 2008), it seems plausible that improving glycaemic control may improve perinatal outcomes, although as Inkster 2006 points out, the association between adverse perinatal outcomes and HbA1c levels may be influenced by related confounders, such as women already having established microvascular complications. Kinsley 2007 also questions the link between poor glycaemic control and adverse birth outcomes, suggesting that other factors, such as mother’s weight and age, and timing and type of care, may also have an influence.
Potential risks of tight glycaemic control
There is some concern that as glycaemic or metabolic control improves, the risk of hypoglycaemia increases (DCCT 1993). The recent Cochane review ‘Targeting intensive glycaemic control versus targeting conventional glycaemic control for type 2 diabetes mellitus’ showed a significantly increased risk of hypoglycaemia for type 2 diabetes patients who underwent intensive glycaemic control compared with conventional glycaemic control (Hemmingsen 2011).
While animal studies have linked hypoglycaemia early in gestation with congenital abnormalities, this does not seem to be the case in humans, even when hypoglycaemic episodes occur during organogenesis (Steel 1990). Maternal deaths due to hypoglycaemia have been reported rarely (ADIPS 2005).
Recent trials in non-pregnant populations of people with type 2 diabetes have failed to show that the benefits of very tight glycaemic control outweigh the harms, with one trial stopping early due to excess deaths (Montori 2009). The authors of the Cochrane review ‘Targeting intensive glycaemic control versus targeting conventional glycaemic control for type 2 diabetes mellitus’ concluded, however, that targeting intensive glycaemic control compared with conventional glycaemic control, was not associated with an increased risk in mortality (Hemmingsen 2011). The interventions needed to achieve very tight glycaemic control may in addition be onerous, overwhelming people’s “capacity to cope clinically, psychologically and financially” (Montori 2009). Pregnant women with diabetes are also likely to experience similar problems in trying to control their blood glucose levels (King 2009).
Why it is important to do this review
In 1989, the St Vincent Declaration set a five-year target for women with diabetes to achieve similar pregnancy outcomes to those achieved by women without diabetes; over 20 years later, that target has not yet been met (Modder 2008).
In assessing evidence related to determining the optimal degree of glycaemic control, this review will contribute to knowledge which can be used by pregnant women with pre-existing diabetes and their clinicians to minimise the risk of adverse birth outcomes and diabetic complications for mothers.
OBJECTIVES
To assess the effects of different intensities of glycaemic control (tight versus very tight) in pregnant women with pre-existing type 1 or type 2 diabetes.
METHODS
Criteria for considering studies for this review
Types of studies
Randomised controlled trials or quasi-randomised controlled trials; including abstracts.
Types of participants
Pregnant women with established diabetes (type 1 or type 2) as diagnosed according to each included study.
(For example, the latest World Health Organization diagnostic criteria for diabetes state that diagnosis should be based on fasting plasma glucose level in excess of 7.0 mmol/L (126 mg/dL) and/or a two-hour plasma glucose level in excess of 11.1 mmol/L (200 mg/dL) following an oral glucose tolerance test (75 g glucose given by mouth) (WHO 2006).
Types of interventions
Studies comparing different intensities of glycaemic control which have predefined definitions of intensity of control. We planned to accept studies that used different target thresholds in their definitions. If blood glucose levels were used as the measure of glycaemic control, we used the definition of ‘tight’ and ‘very tight’ used in each individual study. Methods of achieving targets could include more frequent hospital visits, dietary changes, exercise, more intensive insulin therapy, and/or home-based monitoring systems that involve setting specific targets.
Types of outcome measures
Primary outcomes
Maternal
Hyperglycaemia requiring changes in management during pregnancy.
Pre-eclampsia.
Mode of birth (normal vaginal birth, operative vaginal birth, caesarean section).
Neonatal
Perinatal (fetal and neonatal) and postneonatal mortality.
Congenital fetal anomaly.
Death or morbidity composite (variously defined by trials, e.g. infant death, shoulder dystocia, bone fracture or nerve palsy).
Secondary outcomes
Maternal
Maternal mortality.
Hypoglycaemia requiring treatment during pregnancy.
Cardiovascular events.
Glycaemic control achieved (e.g. blood glucose or HbA1c concentrations).
Induction of labour.
Augmentation of labour.
Perineal trauma.
Pregnancy-induced hypertension.
Weight gain during pregnancy.
Postpartum haemorrhage.
Postpartum infection.
Placental abruption.
Depression.
Anxiety.
Breastfeeding.
Satisfaction with treatment/management.
Adherence with treatment/management.
Diabetic ketoacidosis.
Neonatal
Large-for-gestational age (birthweight greater than 90th centile; or as defined by individual trial).
Macrosomia (greater than 4000 g; or as defined by individual trial).
Shoulder dystocia.
Bone fracture.
Nerve palsy.
Gestational age at birth.
Birthweight.
Head circumference.
Length.
Small-for-gestational age.
Preterm birth.
Neonatal hypoglycaemia.
Neonatal infection.
Neonatal hyperglycaemia.
Respiratory distress syndrome.
Neonatal jaundice (hyperbilirubinaemia).
Hypocalcaemia.
Infant/childhood outcomes
Appropriate weight for age.
Anthropometry (skinfold thickness, fat mass).
Bayley scale of infant development.
Health service use
Extra use of healthcare services (consultations, blood glucose monitoring, length and number of antenatal visits).
Additional requirements for families (such as change of diet, exercise, extra antenatal visits).
Admission to neonatal intensive care unit/nursery.
Length of stay in neonatal intensive care unit/nursery.
Search methods for identification of studies
Electronic searches
We contacted the Trials Search Co-ordinator to search the Cochrane Pregnancy and Childbirth Group’s Trials Register (30 April 2012).
The Cochrane Pregnancy and Childbirth Group’s Trials Register is maintained by the Trials Search Co-ordinator and contains trials identified from:
monthly searches of the Cochrane Central Register of Controlled Trials (CENTRAL)
weekly searches of MEDLINE;
weekly searches of EMBASE;
handsearches of 30 journals and the proceedings of major conferences;
weekly current awareness alerts for a further 44 journals plus monthly BioMed Central email alerts.
Details of the search strategies for CENTRAL, MEDLINE and EMBASE, the list of handsearched journals and conference proceedings, and the list of journals reviewed via the current awareness service can be found in the ‘Specialized Register’ section within the editorial information about the Cochrane Pregnancy and Childbirth Group.
Trials identified through the searching activities described above are each assigned to a review topic (or topics). The Trials Search Co-ordinator searches the register for each review using the topic list rather than keywords.
We did not apply any language restrictions.
Data collection and analysis
Selection of studies
Two review authors independently assessed for inclusion all the potential studies identified as a result of the search strategy. We resolved any disagreements through discussion.
Data extraction and management
We designed a form to extract data. For eligible studies, at least two review authors extracted the data using the agreed form. We resolved discrepancies through discussion. We entered data into Review Manager software (RevMan 2011) and checked for accuracy.
Assessment of risk of bias in included studies
Two review authors independently assessed risk of bias for each study using the criteria outlined in the Cochrane Handbook for Systematic Reviews of Interventions (Higgins 2011). We resolved any disagreement by discussion.
(1) Sequence generation (checking for possible selection bias)
For each included study we described the methods used to generate the allocation sequence in sufficient detail to allow an assessment of whether it should produce comparable groups.
We assessed the methods as:
low risk of bias (any truly random process, e.g. random number table; computer random number generator);
high risk of bias (any non-random process, e.g. odd or even date of birth; hospital or clinic record number);
unclear risk of bias.
(2) Allocation concealment (checking for possible selection bias)
For each included study we described the method used to conceal the allocation sequence and determined whether intervention allocation could have been foreseen in advance of, or during recruitment, or changed after assignment.
We assessed the methods as:
low risk of bias (e.g. telephone or central randomisation; consecutively numbered sealed opaque envelopes);
high risk of bias (open random allocation; unsealed or non-opaque envelopes, alternation; date of birth);
unclear risk of bias.
(3) Blinding of outcome assessment (checking for possible detection bias)
It is not possible to blind the intervention of glycaemic control targets, but assessment of some outcomes is feasible. However, none of the three included trials reported blinding of outcome assessment.
In future updates, we will describe for each included study the methods used, if any, to blind outcome assessors from knowledge of which intervention a participant received. We will assess blinding separately for different outcomes or classes of outcomes.
We will assess methods used to blind outcome assessment as:
low, high or unclear risk of bias.
(4) Incomplete outcome data (checking for possible attrition bias through withdrawals, dropouts, protocol deviations)
For each included trial and for each outcome or class of outcomes we described the completeness of data including attrition and exclusions from the analysis. We stated whether attrition and exclusions were reported, the numbers included in the analysis at each stage (compared with the total randomised participants), reasons for attrition or exclusion where reported, and whether missing data were balanced across groups or were related to outcomes. We assessed methods as:
low risk of bias (e.g. no missing outcome data; missing outcome data balanced across groups);
high risk of bias (e.g. numbers or reasons for missing data imbalanced across groups; ‘as treated’ analysis carried out with substantial departure of intervention received from that assigned at randomisation);
unclear risk of bias.
(5) Selective reporting bias
For each included trial we described how we investigated the possibility of selective outcome reporting bias was examined and what we found.
We assessed the methods as:
low risk of bias (where it is clear that all of the study’s prespecified outcomes and all expected outcomes of interest to the review have been reported);
high risk of bias (where not all the study’s pre-specified outcomes have been reported; one or more reported primary outcomes were not prespecified; outcomes of interest are reported incompletely and so cannot be used; study fails to include results of a key outcome that would have been expected to have been reported);
unclear risk of bias.
(6) Other sources of bias
For each included trial we described any important concerns we had about other possible sources of bias.
We assessed whether each trial was free of other problems that could put it at risk of bias:
low risk of other bias;
high risk of other bias;
unclear whether there is risk of other bias.
(7) Overall risk of bias
We made explicit judgements about whether trials were at high risk of bias, according to the criteria given in the Handbook (Higgins 2011). With reference to (1) to (6) above, we planned to assess the likely magnitude and direction of the bias and whether we considered it likely to impact on the findings. We intended to explore the impact of the level of bias through undertaking sensitivity analyses - see Sensitivity analysis but there were insufficient data to do so.
Measures of treatment effect
Dichotomous data
For dichotomous data, we presented results as summary risk ratio with 95% confidence intervals.
Continuous data
For continuous data, we used the mean difference with 95% confidence intervals if outcomes were measured in the same way between trials.
Dealing with missing data
For included studies, we noted levels of attrition.
The denominator for each outcome in each trial was the number randomised minus any participants whose outcomes were known to be missing.
Assessment of heterogeneity
We assessed statistical heterogeneity in each meta-analysis using the I2 and Chi2 statistics. We regarded heterogeneity to be substantial if either the I2 was greater than 30% or there was a low P value (less than 0.10) in the Chi2 test for heterogeneity.
Assessment of reporting biases
As there were fewer than 10 trials included in the analyses, we were unable to investigate reporting biases (such as publication bias) using funnel plots.
Data synthesis
We carried out statistical analyses using the Review Manager software (RevMan 2011). We presented the primary analysis by the method used to achieve glycaemic control.
We used fixed-effect meta-analysis where it was reasonable to assume that trials were estimating the same underlying treatment effect: i.e. where trials were examining the same intervention, and the trials’ populations and methods were judged to be sufficiently similar. Where the average treatment effect was not clinically meaningful, we did not combine trials.
Subgroup analysis and investigation of heterogeneity
We planned to carry out the following subgroup analyses (on primary outcomes only) but there were insufficient data to do so:
whether the trial includes women with type 1 or type 2 diabetes, or both;
gestational age when women were recruited to the trial;
different measures and targets for glycaemic control;
type(s) of strategies used to target and/or achieve glycaemic control.
In future updates, we plan to assess differences between subgroups by interaction tests available in RevMan 2011.
Sensitivity analysis
We planned to carry out sensitivity analyses to explore the effects of adequacy of allocation concealment (including quasi-randomisation) and other risk of bias components, but there were insufficient data to do this.
RESULTS
Description of studies
See: Characteristics of included studies; Characteristics of excluded studies.
Results of the search
The updated search (February 2012) identified no new studies to consider. From the original search, we included three trials and excluded one trial.
Included studies
Setting
Two trials (Demarini 1994; Sacks 2006) were conducted in the US, and the third (Farrag 1987) was conducted in Saudi Arabia.
Type of diabetes
All three included trials were in women with type 1 diabetes (Demarini 1994; Farrag 1987; Sacks 2006).
Baseline glycaemic control concentrations were not reported, but first trimester HbA1c ranged from a mean of approximately 7% in Sacks 2006, with a corresponding mean of 9.4% in Demarini 1994. Farrag 1987 only reported first trimester mean blood glucose concentrations ranging from 5.6 to 8.9 mmol/L (assumed to be fasting blood glucose, but this was not explicitly stated).
Interventions
Interventions were classified by degree of glycaemic control as follows.
Very tight glycaemic control
Fasting blood glucose (FBG) less than 4.44 mmol/L (Demarini 1994).
FBG 3.33 to 5.0 mmol/L (Sacks 2006).
Tight glycaemic control
FBG less than 5.5 mmol/L (Demarini 1994).
FBG of 5.6 mmol/L or less (Farrag 1987).
Moderate glycaemic control
FBG 5.27 to 6.38 mmol/L (Sacks 2006).
FBG 5.6 to 6.7 mmol/L (Farrag 1987).
Loose glycaemic control
FBG 6.7 to 8.9 mmol/L (Farrag 1987).
These interventions were therefore grouped into the following comparisons.
Very tight versus tight-moderate glycaemic control (Demarini 1994; Sacks 2006).
Tight versus moderate glycaemic control (Farrag 1987).
Tight-moderate versus loose glycaemic control (Farrag 1987).
Method of achieving glycaemic control targets
Each of the trials used different method to achieve glycaemic control targets, with Demarini 1994 focusing on clinician monitoring and several hospital admissions throughout pregnancy. Farrag 1987 used insulin adjustment (one unit for each 0.6 mmol/L above the set target) whereas the most recent trial (Sacks 2006) focused on diet and insulin adjustment based on self-monitoring.
Excluded studies
We excluded the DCCT 1996a trial because all pregnant women received intensive therapy.
Risk of bias in included studies
Overall, the three trials had a high risk of bias (Figure 1; Figure 2).
Figure 1.

Methodological quality graph: review authors’ judgements about each methodological quality item presented as percentages across all included studies.
Figure 2.

Methodological quality summary: review authors’ judgements about each methodological quality item for each included study.
Allocation
None of the three trials described their method of allocation concealment in sufficient detail and only Sacks 2006 specified an adequate method of sequence generation (computer-generated randomisation).
Blinding
The intervention of glycaemic control targets was not feasible to blind; and although assessment of some outcomes could have been blinded, none of the three trials reported doing so.
Incomplete outcome data
Two trials did not report losses to follow-up and one, Sacks 2006, had a 15% loss to follow-up (with all four women lost from the very tight glucose control target group).
Selective reporting
All three trials were at high risk of selective outcome reporting bias.
Other potential sources of bias
The Farrag 1987 trial varied in numbers randomised per group. This may have been part of the trial design (1:2:1 ratio) but no mention of this was made in the paper.
Effects of interventions
1. Very tight versus tight-moderate glycaemic control targets
We included two trials in this comparison (Demarini 1994; Sacks 2006) jointly spanning fasting blood glucose targets of 3.33 to 5.0 mmol/L for very tight glycaemic control targets versus 4.45 to 6.38 mmol/L for tight-moderate glycaemic control targets.
Primary outcomes
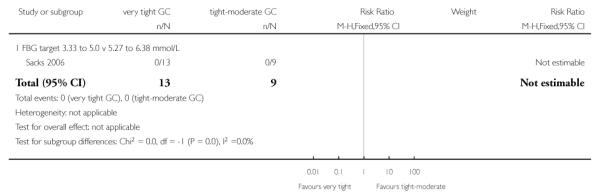
In one trial of 22 women and babies (Sacks 2006), there were no perinatal deaths or instances of serious perinatal morbidity (Analysis 1.1; Analysis 1.2). In this trial, two babies in the very tight control group had birth defects compared with none in the tight-moderate glycaemic control group (risk ratio (RR) 3.57, 95% confidence interval (CI) 0.19 to 66.61; Analysis 1.3). In the same trial, no significant differences in caesarean births were seen between very tight and tight-moderate glycaemic control (RR 0.92, 95% CI 0.49 to 1.73; Analysis 1.4).
Neither trial reported the other primary outcomes of hyperglycaemia requiring changes in management during pregnancy, or pre-eclampsia.
Secondary outcomes
In one trial of 137 women, no significant difference in pregnancy-induced hypertension was seen between the very tight and tight-moderate glycaemic control groups (RR 1.40, 95% CI 0.60 to 3.25 - Analysis 1.5; Demarini 1994). In the other trial of 22 women, no cases of chronic hypertension were reported (Analysis 1.6; Sacks 2006).
In the two trials, glycaemic control was assessed in a number of ways.
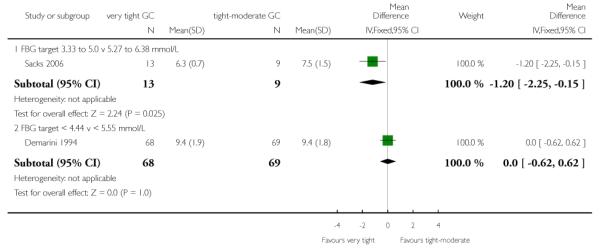
One trial of 26 women (Sacks 2006) reported mean self-monitored blood glucose each trimester; finding significantly better control in the very tight target group in the first (mean difference (MD) −1.23 mmol/L, 95% CI −2.19 to −0.27) and second trimesters (MD −0.99 mmol/L, 95% CI −1.64 to −0.34); but no difference in the third trimester (MD −0.66 mmol/L, 95% CI −1.60 to 0.28; Analysis 1.7). In this trial, no significant differences in daily blood glucose tests were seen between the very tight and the tight-moderate target group (MD 1.60 fewer tests/day, 95% CI −0.15 to 3.35; Analysis 1.8).
Both trials assessed HbA1c concentrations each trimester. In the first trimester, Sacks 2006 found HbA1c to be significantly lower on the very tight target group compared with the tight-moderate target group (MD −1.20%, 95% CI −2.25 to −0.15), while no differences between groups were seen for Demarini 1994 (MD 0%, 95% CI −0.62 to 0.62; Analysis 1.9). In the second and third trimesters, there were no significant differences in HbA1c concentration between very tight and tight-moderate groups in either trial (Analysis 1.10; Analysis 1.11). We did not pool the results of these two trials as there was substantial statistical heterogeneity for HBA1c concentrations in the first and second trimesters, as well as clinical differences between trials such as baseline HbA1c concentrations and differences in the interventions (such as amount of antenatal hospitalisation).
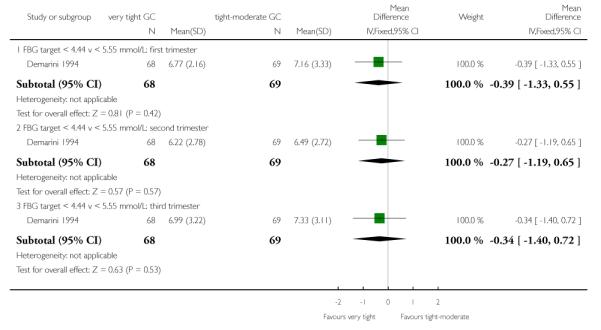
The Demarini 1994 trial also assessed mean preprandial and postprandial glucose concentrations, finding no significant differences between the very tight and tight-moderate groups in any trimester (Analysis 1.12; Analysis 1.13).
In Sacks 2006, women in the tight-moderate glycaemic control target group had significantly fewer days with more than one fasting blood glucose reading below 3.3 mmol/L (MD 20% fewer days, 95% CI 7.00 to 33.00) and below 2.78 mmol/L (MD 17%, 95% CI 4.04 to 29.96). No significant differences between the groups were seen with a threshold of more than one reading below 2.22 mmol/L (MD 8%, 95% CI −3.56 to 19.56; Analysis 1.14). In the same trial, there were significantly fewer hypoglycaemic episodes in the tight-moderate glycaemic control target compared with the very tight group (MD 22% fewer days with more than one subjective hypoglycaemic episode, 95% CI 11.07 to 32.93; Analysis 1.15).
Maternal weight gain during pregnancy was not significantly different between the very tight and the tight-moderate glycaemic control target groups in Sacks 2006 (MD 0.02 kg/week, 95% CI −0.23 to 0.27; Analysis 1.16).
In Demarini 1994, women in the tight-moderate glycaemic control target group had significantly shorter hospital stays compared with the very tight group (MD 10.60 fewer days, 95% CI 9.53 to 11.67; Analysis 1.17).
Gestational age at birth was not significantly different between the very tight and tight-moderate glycaemic control targets (pooled MD 0.43 weeks, 95% CI −0.23 to 1.08; Demarini 1994; Sacks 2006) - Analysis 1.18.
Birthweights pooled across the two trials were not significantly different between the very tight and the tight-moderate glycaemic control target groups (MD −2.62 g, 95% CI −179.83 to 174.59;Demarini 1994; Sacks 2006) - Analysis 1.19.
No differences between groups in Apgar scores less than seven at one minute were seen in the Demarini 1994 trial (RR 1.01, 95% CI 0.40 to 2.55) and none of the babies in this trial had Apgar scores of less than seven at five minutes (Analysis 1.20). In this trial no differences between groups were seen for fetal distress (RR 1.15, 95% CI 0.63 to 2.11; Analysis 1.21) or asphyxia (RR 1.01, 95% CI 0.58 to 1.78; Analysis 1.22).
In Demarini 1994 there was a non-significant trend towards fewer neonates with hypocalcaemia for the very tight compared with the tight-moderate glucose control target (RR 0.55, 95% CI 0.30 to 1.03; 137 neonates; Analysis 1.23) and no significant differences between groups were seen for neonatal hypomagnesaemia (RR 0.65, 95% CI 0.25 to 1.68; 127 neonates; Analysis 1.24).
2. Tight versus moderate glycaemic control targets
We used two of the three arms of the Farrag 1987 trial (45 women and babies) for this comparison (FBG 5.6 or less (tight) versus 5.6 to 6.7 (moderate) mmol).
Primary outcomes
No perinatal deaths were reported in these two arms of the Farrag 1987 trial. In this trial, no significant differences between the tight and moderate glycaemic control target groups were seen for preeclampsia (RR 5.29, 95% CI 0.23 to 122.91; Analysis 2.2) or caesarean births (RR 1.21, 95% CI 0.22 to 6.50; Analysis 2.3). This trial did not report on the outcomes of maternal hyperglycaemia requiring treatment, congenital fetal abnormalities or serious perinatal morbidities.
Secondary outcomes
There were significantly more instances of maternal hypoglycaemia in the first half of pregnancy in the tight, compared with the moderate glycaemic control target (RR 26.47, 95% CI 1.61 to 435.38; Farrag 1987) - Analysis 2.4.
Transient maternal hypertension was not significantly different between the high and moderate glycaemic control target groups (RR 0.59, 95% CI 0.03 to 13.66; Farrag 1987) - Analysis 2.5.
No differences between the tight and moderate glycaemic control target groups were seen for neonatal respiratory distress syndrome (RR 0.91, 95% CI 0.09 to 9.24; Farrag 1987) - Analysis 2.6.
No infants in these two arms of the Farrag 1987 trial were reported to have a birthweight greater than the 90th centile.
3. Tight-moderate versus loose glycaemic control targets
We used all three arms of the Farrag 1987 trial in this comparison, although we combined the ‘tight’ and ‘moderate’ arms (6.7 mmol/L or less; 45 women and babies) and compared this with the ‘loose’ arm (6.7 to 8.9 mmol/L; 15 women and babies).
Primary outcomes
Two neonatal deaths were reported in the loose glycaemic control target group, giving no significant differences between the tight-moderate and loose groups in Farrag 1987 (RR 0.07, 95% CI 0.00 to 1.37; Analysis 3.1).
In Farrag 1987, significantly fewer women in the tight-moderate group compared with the loose glycaemic target group had preeclampsia (RR 0.11, 95% CI 0.01 to 0.99; Analysis 3.2) and caesarean sections (RR 0.28, 95% CI 0.10 to 0.78; Analysis 3.3).
This trial did not report on the outcomes of maternal hyperglycaemia requiring treatment, congenital fetal abnormalities or serious perinatal morbidities.
Secondary outcomes
Maternal hypoglycaemia in the first half of pregnancy was not significantly different between the tight-moderate and loose glycaemic control target groups (RR 5.22, 95% CI 0.32 to 86.28;Farrag 1987) - Analysis 3.4.
Transient maternal hypertension was not significantly different between the tight-moderate and loose glycaemic control target groups (RR 1.81, 95% CI 0.12 to 27.07; Farrag 1987) - .Analysis 3.5.
In Farrag 1987, significantly fewer neonates had respiratory distress syndrome in the tight-moderate compared with the loose glycaemic control target groups (RR 0.17, 95% CI 0.05 to 0.59; Analysis 3.6).
In this trial significantly fewer neonates in the tight-moderate (compared with the loose glycaemic control target group) had birthweights greater than the 90th centile (RR 0.01, 95% CI 0.00 to 0.20; Analysis 3.7).
DISCUSSION
Summary of main results
Very few differences were seen between very tight (3.33 to 5.0 mmol/L FBG) and tight-moderate (4.45 to 6.38 mmol/L fasting blood glucose (FBG)) targets in pregnant women with pre-existing type 1 diabetes in two small trials, although there were significantly more cases of hypoglycaemia and longer hospital stays with very tight control targets.
A single trial comparing tight (5.6 mmol/L or less FBG), moderate (5.6 to 6.7 mmol/L) and loose (6.7 to 8.9 mmol/L) glycaemic control targets found few differences between the tight and moderate groups, although significantly more women in the tight group had hypoglycaemia in the first half of pregnancy. In the loose group, significantly more women had pre-eclampsia, and there were significantly more caesareans and birthweights greater than 90th centile.
In the very tight and tight-moderate glycaemic control target comparisons, neither group achieved their targets. In Sacks 2006 women in the very tight group (target of less than 5 FBG) had a mean FBG of 7.28 and the tight-moderate group (less than 6.28 FBG) had a mean FBG of 7.94 in the third trimester. The corresponding figures for Demarini 1994 were less than 4.44 and mean 6.99 FBG for the very tight group and less than 5.55 and mean 7.33 FBG for the tight-moderate group.
Limited body of evidence
Only three small trials of 223 women with pre-existing type 1 diabetes were able to be included in this review. No trials in pregnant women with pre-existing type 2 diabetes were located.
All three included trials were at high risk of bias particularly in regard to unclear allocation concealment methods, no blinded outcome assessment and selective outcome reporting (for example, pre-eclampsia was reported in only one of the trials). However, any potential bias is likely to have been overshadowed by the small number and size of trials with their different designs, interventions and reported outcomes.
The trials are far too small to show differences in important but rare outcomes such as perinatal mortality, birth defects and even the more common ones such as caesarean sections.
Glycaemic control as an intervention
We used FBG concentrations to assess whether women were meeting their glycaemic control targets, as this was the only measurement common to all three trials. Each of the trials used different definitions and thresholds. While this meant some overlap (and some gaps) in our very tight, tight, moderate and loose categorisation, this approximated less than 5 mmol/L FBG for very tight, less than 6 mmol/L for tight, less than 7 mmol/L for moderate and less than 9 mmol/L for loose glycaemic control. Our tight category is reasonably consistent with recent recommendations from the UK (less than 5.9 mmol/L FBG) and the US (less than 5.56 mmol/L) (ACOG 2005; NICE 2008).
Our findings of lack of achievement in reaching glycaemic targets is consistent with Langer and colleagues’ experience where 40% to 50% of pregnant women with type 1 diabetes and 55% to 74% of pregnant women with type 2 diabetes achieved their glycaemic control targets (Langer 2008) and also in Manderson 2003, where glycaemic control success was poor (11% of FBG readings within target ranges) in pregnant women with type 1 diabetes.
There is, however, some indication both in pregnant women with pre-existing type 1 diabetes (Manderson 2003) and women with gestational diabetes (De Veciana 1995) that postprandial glucose targets may be more achievable than pre-prandial targets and that using postprandial targets may lead to reductions in outcomes such as pre-eclampsia (Manderson 2003). In a trial included in this review (Demarini 1994), neither preprandial (see above) or postprandial targets met the current NICE 2008 standard of less than 7.8 mmol/L (postprandial values were 8.55 mmol/L in the very tight group and 8.66 in the tight group).
Sacks and colleagues argue that glycaemic targets for type 1 and 2 should not be identical, and suggest that type 1 targets be relaxed to avoid maternal hypoglycaemia. They observe that many high FBG values may be the result of women trying to combat their hypoglycaemia and that raising glucose targets may therefore actually lower mean glucose values, without worsening maternal and neonatal outcomes (Sacks 1997).
There is also debate about the relationship between glycaemic control and birth outcomes, with Langer 1994 finding a reduction in macrosomia with more intensive control in women with gestational diabetes, even though differences in mean glucose concentrations were not apparent between the intensive and conventionally managed groups. In a later paper, Langer and colleagues argue for aggressive management of pregnant women with type 2 diabetes using insulin in combination with oral antidiabetic drugs and glucose self-monitoring (Langer 2008).
For diabetes in the general (non-pregnant) population, there is current debate about the merits (or otherwise) of intensive glycaemic control. A systematic review of intensive versus conventional glucose control (with varying definitions of degree of control) showed a reduced risk for some cardiovascular outcomes such as nonfatal myocardial infarction, no reduced risk for cardiovascular death or all-cause mortality, and increased risk for severe hypoglycaemia (Kelly 2009). The recent Cochrane review ‘Targeting intensive glycaemic control versus targeting conventional glycaemic control for type 2 diabetes mellitus’ also showed that targeting intensive glycaemic control may increase the risk of hypoglycaemia, with no increased risk in mortality, when compared with conventional glycaemic control, for type 2 diabetic patients (Hemmingsen 2011).
AUTHORS’ CONCLUSIONS
Implications for practice
In a very limited body of evidence, few differences were seen between very tight and tight-moderate glycaemic control targets in outcomes for pregnant women with pre-existing type 1 diabetes, including actual glycaemic control achieved. Although the optimal glycaemic control target remains elusive, there is some evidence of harm (increased pre-eclampsia, caesareans and birth-weights greater than the 90th centile) for ‘loose’ control (FBG greater than 7 mmol/L). There is no evidence from randomised trials about the effects of different intensities of glucose control in type 2 diabetes.
Implications for research
Sacks and colleagues ended their 2006 paper (Sacks 2006) on the plaintive note that the pilot glycaemic control target data are submitted “in the hope that others may be encouraged to further investigate this possibility”. The recruitment of only 26 women in a three-year period is likely to be one of the reasons why no-one has yet responded to their call.
Future trials comparing interventions, rather than glycaemic control targets, may be more feasible, particularly for pregnant women with pre-existing type 2 diabetes. Such interventions might encompass oral antidiabetics drugs, and combined nutrition and glucose self-monitoring in pregnant women with type 2 diabetes, and further trials on continuous glucose monitoring. Web-based diabetes management interventions have been trialled in general populations and need to be tested in pregnant women and women of reproductive age with diabetes.
More knowledge is needed about the differential responses in type 1 and type 2 diabetes, differences between influences of different types of glycaemic control (preprandial, postprandial, HbA1c) timing (pre-pregnancy (designated as a priority in the UK (Murphy 2009)), early pregnancy, late pregnancy) as well as the combined effects of obesity and elevated glucose in pregnant women and women of reproductive age.
It will be important to evaluate women’s views of interventions so that the benefits outweigh harms as well as overcoming or avoiding impracticalities and inconveniences such as frequent hospital and clinic attendance and intrusive monitoring.
PLAIN LANGUAGE SUMMARY.
Very little evidence from randomised trials about optimal blood sugar (glucose) targets for pregnant women with type 1 or type 2 diabetes
Women who have either type 1 or type 2 diabetes before they become pregnant have an increased risk of pregnancy loss, high birthweight babies and perinatal deaths. The metabolic disruptions to the fetus caused by the mother’s high blood sugars and insulin resistance can affect the development of organs, and cardiovascular malformations are the most common birth defects in infants born to diabetic mothers. Infants of diabetic mothers may also be at increased risk of developing obesity and type 2 diabetes. Management of diabetes in pregnancy therefore aims for tight control of glucose (glycaemic control) using careful combinations of diet, exercise, insulin or other anti-diabetogenic drugs, clinical visits and monitoring.
We identified only three small trials (in a total of 223 pregnant women with type 1 diabetes) looking at different intensities of glycaemic control.
We found very few differences between very tight and tight to moderate glucose targets in two trials, although there were significantly more cases of low blood sugar (hypoglycaemia) and longer hospital stays for women who had very tight blood sugar control.
A single trial comparing tight, moderate and loose blood glucose targets found few differences between the tight and moderate groups, although significantly more women in the tight control group had hypoglycaemia in the first half of pregnancy. In the loose control group, significantly more women had pre-eclampsia, and there were significantly more caesareans and large babies.
It is clearly difficult for women to achieve glucose targets in isolation, and interventions such as monitoring may be successful in helping women to manage their diabetes.
ACKNOWLEDGEMENTS
Jessica Ainge Allen, Rachel Earl and Rebecca Tooher helped with drafting early versions of the protocol. Peter Muller for clinical input during the development of the 2012 update.
As part of the pre-publication editorial process, this review has been commented on by two peers (an editor and referee who is external to the editorial team), a member of the Pregnancy and Childbirth Group’s international panel of consumers and the Group’s Statistical Adviser.
SOURCES OF SUPPORT
Internal sources
ARCH, Discipline of Obstetrics and Gynaecology, The University of Adelaide, Australia.
External sources
Australian Department of Health and Ageing, Australia.
CHARACTERISTICS OF STUDIES
Characteristics of included studies [ordered by study ID]
| Methods | RCT. | |
| Participants | 137 pregnant women and their infants. Recruited: July 1978 to June 1989. Setting: Perinatal Treatment Center, University of Cincinnati, Ohio, USA Inclusion criteria: women with type 1 diabetes enrolled in the trial before 9 weeks’ gestation Exclusion criteria: infants whose birth dates were discrepant by 2 weeks or more from the estimated gestational age Severity of diabetes: Very tight glycaemic control target: 31 White class B-C; 37 White class D-RT Tight-moderate glycaemic control target: 38 White class B-C; 31 White class D-RT Duration of diabetes (years): Very tight glycaemic control target: 11.9 (6.1). Tight glycaemic control target: 11.3 (7.1). |
|
| Interventions |
Very tight glycaemic control target (n = 68): Target of FBG < 80 mg/dL (< 4.44 mmol/L); 1.5 hour postprandial BG < 120 mg/dL (< 6.66 mmol/L) Admitted to hospital immediately on trial entry to achieve strict control; seen weekly throughout pregnancy Tight glycaemic control target (standard management) (n = 69): Target of FBG < 100 mg/dL (< 5.55 mmol/L); postprandial BG < 140 mg/dL (< 7.77 mmol/L) Only admitted to hospital if, after 1 week of outpatient management, the criteria for control of blood glucose were not met; seen biweekly in the first trimester, and weekly thereafter ALL WOMEN: all women received a twice-daily insulin dose including both a short-acting and an intermediate acting insulin, with dietary regulation; blood glucose was monitored with a reflectance meter (Ames dextrometer) All women were admitted to hospital for the 28th week of gestation and again at 1 to 4 weeks before anticipated birth to evaluate and optimise serum glucose control |
|
| Outcomes | HbA1c (first, second, third trimester). Mean preprandial glucose (first, second, third trimester). Mean postprandial glucose (first, second, third trimester). Pregnancy-induced hypertension. Maternal length of hospital stay. Infant serum calcium concentrations - hypocalcaemia defined as serum total of < 8.0 mg/dL (2.00 mmol/L) in term infants (at least 37 weeks GA); and < 7.0 mg/dL (1.75 mmol/L) in preterm infants Infant serum magnesium concentrations - hypomagnesaemia defined as serum magnesium concentration < 1.6 mg/dL (0.66 mmol/L) Perinatal asphyxia (defined as presence of late decelerations in fetal heart rate or prolonged fetal bradycardia (fetal distress) and/or 1 minute Apgar scores < 7) Birthweight. GA. Apgar score. Fetal distress. |
|
| Notes | Mimouni 1987 appears to be an interim report of the trial. | |
| Risk of bias | ||
| Bias | Authors’ judgement | Support for judgement |
| Random sequence generation (selection bias) | Unclear risk | “randomly assigned” - no further information. |
| Allocation concealment (selection bias) | Unclear risk | “randomly assigned” - no further information. |
| Blinding (performance bias and detection bias) All outcomes |
High risk | Not feasible to blind the intervention, although blinded assessment of outcomes would have been possible |
| Incomplete outcome data (attrition bias) All outcomes |
Low risk | No losses to follow-up reported. |
| Selective reporting (reporting bias) | High risk | None of the primary review outcomes of perinatal mortality or serious perinatal morbidity, pre-eclampsia, hyperglycaemia requiring treatment and caesarean birth were reported; many secondary review outcomes also not reported (e.g. large-for-gestational age) |
| Other bias | Low risk | No apparent evidence of other bias. |
| Methods | RCT. | |
| Participants | 60 pregnant women with type 1 diabetes; aged between 24 and 40 years; parity between 3 to 8 Setting: King Fahad Hospital, Alkhobar, Saudi Arabia. Inclusion criteria: White classification B and C for type 1 diabetes. Exclusion criteria: Women with any other medical complications; women who presented after the first trimester |
|
| Interventions |
Tight glycaemic control target (n = 16): Target of 5.6 mmol/L or below*. Moderate glycaemic control target (n = 29): Target between 5.6 and 6.7 mmol/L*. Loose glycaemic control (n = 15): Target between 6.7 and 8.9 mmol/L*. *paper does not specify if this was fasting blood glucose, but we have assumed that it is ALL WOMEN: were admitted to hospital during the first trimester to regulate their diet and insulin requirements (average stay of 8 days); had insulin doses of 1 unit for each 0.6 mmol/L above the set target and adjusted as required; were reviewed every 2 weeks in the clinic for routine antenatal care, glycosuria and bacteriuria; were readmitted to hospital at 20 and 28 weeks’ GA to readjust insulin dose, ultrasound follow-up of biparietal diameter; were asked to count up to 10 fetal movements every day from 28 weeks’ GA; were readmitted to hospital at 36 weeks’ GA for insulin dose readjustment, ultrasonography, fetal movement count, biweekly oestriol estimation and electronic fetal monitoring At 38 weeks’ GA, women with no contraindication for vaginal birth had their cervix evaluated and PGE2 sublingual tablets were administered to women who had an unfavourable cervix |
|
| Outcomes | Fasting, 2-hour postprandial and midnight blood glucose concentrations Length of hospital stay. Ultrasound follow-up of fetal biparietal diameter, head and abdominal circumferences; and femoral length at 30 and 28 weeks’ GA Weekly serumoestriol estimation and electronic fetal monitoring (biochemical and physical tests) from 28 weeks’ GA Perinatal mortality. Pre-eclampsia. Caesarean section. Maternal hypoglycaemia in first half of pregnancy. Transient maternal hypotension. Respiratory distress syndrome. Birthweight > 90th centile. |
|
| Notes | ||
| Risk of bias | ||
| Bias | Authors’ judgement | Support for judgement |
| Random sequence generation (selection bias) | Unclear risk | “allocated at random” - no further details. |
| Allocation concealment (selection bias) | Unclear risk | “allocated at random” - no further details. |
| Blinding (performance bias and detection bias) All outcomes |
High risk | Not feasible to blind the intervention, although blinded assessment of outcomes would have been possible |
| Incomplete outcome data (attrition bias) All outcomes |
Low risk | No losses to follow-up reported. |
| Selective reporting (reporting bias) | High risk | Primary review outcomes of congenital anomalies and maternal hyperglycaemia requiring treatment not reported; many secondary review outcomes not reported |
| Other bias | Unclear risk | Numbers randomised per group are imbalanced (16:29:15). This may have been due to 1:2:1 randomisation but this was not mentioned in the paper |
| Methods | RCT. | |
| Participants | 26 pregnant women with type 1 diabetes who presented for antenatal care before 13 weeks’ GA Recruited from 1 April 2000 to 31 March 2003. Type 1 diabetes was identified on clinical grounds, including requirement for insulin and/or a history of abrupt onset of diabetes, diabetic ketoacidosis or both Setting: Department of Obstetrics and Gynaecology, Kaiser Permanente Hospital, Bellflower, CA, USA |
|
| Interventions |
Very tight glycaemic control target (n = 13 women and babies): Fasting and pre-meal glucose targets of 60 to 90 mg/dL (3.33 to 5.0 mmol/L); and 1 hour post-meal targets of 120 to 140 mg/dL (6.66 to 7.77 mmol/L) Tight glycaemic control target (n = 9 women and babies): Fasting and pre-meal glucose targets of 95 to 115 mg/dL (5.27 to 6.38 mmol/L); and 1 hour post-meal targets of 155 to 175 mg/dL (8.6 to 9.71 mmol/L) ALL WOMEN: were instructed in diet, insulin administration and glucose self-monitoring; diet caloric content was based on ideal prepregnancy weight (40% carbohydrates, 20% fat and 40% protein) For women using multiple injections, combinations of intermediate acting (NPH) and either regular insulin or insulin lispro were used to control maternal glycaemia. Women using continuous insulin infusion (insulin pumps) were trained to adjust their basal and bolus doses of insulin lispro to achieve the target values for their respective group Women were given written and verbal instructions in the daily adjustment of their insulin doses to achieve target glucose values for their assigned group |
|
| Outcomes | Perinatal mortality. Serious perinatal morbidity. Capillary plasma glucose (self-monitored 7 times a day with a memory-based portable glucose meter) Hypoglycaemic symptoms (self-reported nervousness, tremulousness and peri-oral numbness) HbA1c measured each trimester. BMI. Maternal weight gain. Chronic hypertension. GA (weeks). Caesarean. Birth defects. Birthweight. |
|
| Notes | ||
| Risk of bias | ||
| Bias | Authors’ judgement | Support for judgement |
| Random sequence generation (selection bias) | Low risk | “computer-generated block randomization.” |
| Allocation concealment (selection bias) | Unclear risk | “computer-generated block randomization.” |
| Blinding (performance bias and detection bias) All outcomes |
High risk | “open label”; not feasible to blind the intervention, although blinded assessment of outcomes would have been possible |
| Incomplete outcome data (attrition bias) All outcomes |
Unclear risk | 4/26 (15.4%) - all 4 were from the very tight glycaemic control target group (2 women had first trimester abortions, 1 was excluded because she had participated in an earlier pregnancy and 1 left the study because of not attending appointments) |
| Selective reporting (reporting bias) | High risk | Primary review outcomes of pre-eclampsia and maternal hyperglycaemia requiring treatment and serious perinatal morbidity not reported; many secondary review outcomes not reported |
| Other bias | Low risk | No apparent evidence of other bias. |
BG: blood glucose
BMI: body mass index
FBG: fasting blood glucose
GA: gestational age
HbA1c: glycated haemoglobin
mg/dL: milligrams/decilitre
mmol/L: millimol/litre
NPH: neutral protamine hagedorn
RCT: randomised controlled trial
Characteristics of excluded studies [ordered by study ID]
| Study | Reason for exclusion |
|---|---|
| DCCT 1996a | All pregnant women received intensive therapy (“the protocol required that women in the conventional treatment group change to intensive therapy while attempting to become pregnant and during pregnancy”) |
DATA AND ANALYSES
Comparison 1.
Very tight versus tight-moderate glycaemic control
| Outcome or subgroup title | No. of studies | No. of participants | Statistical method | Effect size |
|---|---|---|---|---|
| 1 Perinatal mortality | 1 | 22 | Risk Ratio (M-H, Fixed, 95% CI) | 0.0 [0.0, 0.0] |
| 1.1 FBG target 3.33 to 5.0 v 5.27 to 6.38 mmol/L | 1 | 22 | Risk Ratio (M-H, Fixed, 95% CI) | 0.0 [0.0, 0.0] |
| 2 Serious perinatal morbidity | 1 | 22 | Risk Ratio (M-H, Fixed, 95% CI) | 0.0 [0.0, 0.0] |
| 2.1 FBG target 3.33 to 5.0 v 5.27 to 6.38 mmol/L | 1 | 22 | Risk Ratio (M-H, Fixed, 95% CI) | 0.0 [0.0, 0.0] |
| 3 Birth defects | 1 | 22 | Risk Ratio (M-H, Fixed, 95% CI) | 3.57 [0.19, 66.61] |
| 3.1 FBG target 3.33 to 5.0 v 5.27 to 6.38 mmol/L | 1 | 22 | Risk Ratio (M-H, Fixed, 95% CI) | 3.57 [0.19, 66.61] |
| 4 Caesarean | 1 | 22 | Risk Ratio (M-H, Fixed, 95% CI) | 0.92 [0.49, 1.73] |
| 4.1 FBG target 3.33 to 5.0 v 5.27 to 6.38 mmol/L | 1 | 22 | Risk Ratio (M-H, Fixed, 95% CI) | 0.92 [0.49, 1.73] |
| 5 Pregnancy-induced hypertension | 1 | 137 | Risk Ratio (M-H, Fixed, 95% CI) | 1.40 [0.60, 3.25] |
| 5.1 FBG target < 4.44 v < 5.55 mmol/L | 1 | 137 | Risk Ratio (M-H, Fixed, 95% CI) | 1.40 [0.60, 3.25] |
| 6 Chronic hypertension | 1 | 22 | Risk Ratio (M-H, Fixed, 95% CI) | 0.0 [0.0, 0.0] |
| 6.1 FBG target 3.33 to 5.0 mmol/L v 5.27 to 6.38 mmol/L | 1 | 22 | Risk Ratio (M-H, Fixed, 95% CI) | 0.0 [0.0, 0.0] |
| 7 Self-monitored blood glucose (mean, mmol/L) | 1 | Mean Difference (IV, Fixed, 95% CI) | Subtotals only | |
| 7.1 FBG target 3.33 to 5.0 v 5.27 to 6.38 mmol/L: first trimester | 1 | 22 | Mean Difference (IV, Fixed, 95% CI) | −1.23 [−2.19, −0.27] |
| 7.2 FBG target 3.33 to 5.0 v 5.27 to 6.38 mmol/L: second trimester | 1 | 22 | Mean Difference (IV, Fixed, 95% CI) | −0.99 [−1.64, −0.34] |
| 7.3 FBG target 3.33 to 5.0 v 5.27 to 6.38 mmol/L: third trimester | 1 | 22 | Mean Difference (IV, Fixed, 95% CI) | −0.66 [−1.60, 0.28] |
| 8 Self-monitored blood glucose tests/day | 1 | 22 | Mean Difference (IV, Fixed, 95% CI) | 1.60 [−0.15, 3.35] |
| 8.1 FBG target 3.33 to 5.0 v 5.27 to 6.39 mmol/L | 1 | 22 | Mean Difference (IV, Fixed, 95% CI) | 1.60 [−0.15, 3.35] |
| 9 HbA1c (%): first trimester | 2 | Mean Difference (IV, Fixed, 95% CI) | Subtotals only | |
| 9.1 FBG target 3.33 to 5.0 v 5.27 to 6.38 mmol/L | 1 | 22 | Mean Difference (IV, Fixed, 95% CI) | −1.20 [−2.25, −0.15] |
| 9.2 FBG target < 4.44 v < 5.55 mmol/L | 1 | 137 | Mean Difference (IV, Fixed, 95% CI) | 0.0 [−0.62, 0.62] |
| 10 HbA1c (%): second trimester | 2 | Mean Difference (IV, Fixed, 95% CI) | Subtotals only | |
| 10.1 FBG target 3.33 to 5.0 v 5.27 to 6.38 mmol/L | 1 | 22 | Mean Difference (IV, Fixed, 95% CI) | −0.5 [−1.09, 0.09] |
| 10.2 FBG target < 4.44 v < 5.55 mmol/L | 1 | 137 | Mean Difference (IV, Fixed, 95% CI) | 0.10 [−0.37, 0.57] |
| 11 HbA1c (%): third trimester | 2 | Mean Difference (IV, Fixed, 95% CI) | Subtotals only | |
| 11.1 FBG target 3.33 to 5.0 v 5.27 to 6.38 mmol/L | 1 | 22 | Mean Difference (IV, Fixed, 95% CI) | −0.30 [−0.92, 0.32] |
| 11.2 FBG target < 4.44 v < 5.55 mmol/L | 1 | 137 | Mean Difference (IV, Fixed, 95% CI) | −0.10 [−0.49, 0.29] |
| 12 Mean preprandial glucose (mmol/L) | 1 | Mean Difference (IV, Fixed, 95% CI) | Subtotals only | |
| 12.1 FBG target < 4.44 v < 5.55 mmol/L: first trimester | 1 | 137 | Mean Difference (IV, Fixed, 95% CI) | −0.39 [−1.33, 0.55] |
| 12.2 FBG target < 4.44 v < 5.55 mmol/L: second trimester | 1 | 137 | Mean Difference (IV, Fixed, 95% CI) | −0.27 [−1.19, 0.65] |
| 12.3 FBG target < 4.44 v < 5.55 mmol/L: third trimester | 1 | 137 | Mean Difference (IV, Fixed, 95% CI) | −0.34 [−1.40, 0.72] |
| 13 Mean postprandial glucose (mmol/L) | 1 | Mean Difference (IV, Fixed, 95% CI) | Subtotals only | |
| 13.1 FBG target < 4.44 v < 5.55 mmol/L: first trimester | 1 | 137 | Mean Difference (IV, Fixed, 95% CI) | −0.94 [−2.05, 0.17] |
| 13.2 FBG target < 4.44 v < 5.55 mmol/L: second trimester | 1 | 137 | Mean Difference (IV, Fixed, 95% CI) | −0.56 [−1.38, 0.26] |
| 13.3 FBG target < 4.44 v < 5.55 mmol/L: third trimester | 1 | 137 | Mean Difference (IV, Fixed, 95% CI) | −0.11 [−1.26, 1.04] |
| 14 Percent days below FBG threshold of ≥ 1 result less than: | 1 | Mean Difference (IV, Fixed, 95% CI) | Subtotals only | |
| 14.1 3.33 mmol/L | 1 | 22 | Mean Difference (IV, Fixed, 95% CI) | 20.0 [7.00, 33.00] |
| 14.2 2.78 mmol/L | 1 | 22 | Mean Difference (IV, Fixed, 95% CI) | 17.0 [4.04, 29.96] |
| 14.3 < 2.22 mmol/L | 1 | 22 | Mean Difference (IV, Fixed, 95% CI) | 8.0 [−3.56, 19.56] |
| 15 More than 1 subjective hypoglycaemic episode (% of days) | 1 | 22 | Mean Difference (IV, Fixed, 95% CI) | 22.0 [11.07, 32.93] |
| 15.1 FBG target 3.33 to 5.0 v 5.27 to 6.38 mmol/L | 1 | 22 | Mean Difference (IV, Fixed, 95% CI) | 22.0 [11.07, 32.93] |
| 16 Maternal weight gain during pregnancy (kg/week) | 1 | 22 | Mean Difference (IV, Fixed, 95% CI) | 0.02 [−0.23, 0.27] |
| 16.1 FBG target 3.3 to 5.0 v 5.27 to 6.38 mmol/L | 1 | 22 | Mean Difference (IV, Fixed, 95% CI) | 0.02 [−0.23, 0.27] |
| 17 Maternal hospitalisation (days) | 1 | 137 | Mean Difference (IV, Fixed, 95% CI) | 10.60 [9.53, 11.67] |
| 17.1 FBG target < 4.44 v < 5.55 mmol/L | 1 | 137 | Mean Difference (IV, Fixed, 95% CI) | 10.60 [9.53, 11.67] |
| 18 Gestational age (weeks) | 2 | 159 | Mean Difference (IV, Fixed, 95% CI) | 0.43 [−0.23, 1.08] |
| 18.1 FBG target 3.33 to 5.0 v 5.27 to 6.38 mmol/L | 1 | 22 | Mean Difference (IV, Fixed, 95% CI) | −0.30 [−2.44, 1.84] |
| 18.2 FBG target < 4.44 v < 5.55 mmol/L | 1 | 137 | Mean Difference (IV, Fixed, 95% CI) | 0.5 [−0.19, 1.19] |
| 19 Birthweight (g) | 2 | 159 | Mean Difference (IV, Fixed, 95% CI) | −2.62 [−179.83, 174. 59] |
| 19.1 FBG target 3.33 to 5.0 v 5.27 to 6.38 mmol/L | 1 | 22 | Mean Difference (IV, Fixed, 95% CI) | −272.0 [−803.99, 259.99] |
| 19.2 FBG target < 4.44 v < 5.55 mmol/L | 1 | 137 | Mean Difference (IV, Fixed, 95% CI) | 31.0 [−156.95, 218. 95] |
| 20 Apgar score | 1 | Risk Ratio (M-H, Fixed, 95% CI) | Subtotals only | |
| 20.1 < 7 at 1 minute: FBG target < 4.44 v < 5.55 mmol/L | 1 | 137 | Risk Ratio (M-H, Fixed, 95% CI) | 1.01 [0.40, 2.55] |
| 20.2 < 7 at 5 minutes: FBG target < 4.44 v < 5.55 mmol/L | 1 | 137 | Risk Ratio (M-H, Fixed, 95% CI) | 0.0 [0.0, 0.0] |
| 21 Fetal distress | 1 | 137 | Risk Ratio (M-H, Fixed, 95% CI) | 1.15 [0.63, 2.11] |
| 21.1 FBG target < 4.44 v < 5.55 mmol/L | 1 | 137 | Risk Ratio (M-H, Fixed, 95% CI) | 1.15 [0.63, 2.11] |
| 22 Asphyxia | 1 | 137 | Risk Ratio (M-H, Fixed, 95% CI) | 1.01 [0.58, 1.78] |
| 22.1 FBG target < 4.44 v < 5.55 mmol/L | 1 | 137 | Risk Ratio (M-H, Fixed, 95% CI) | 1.01 [0.58, 1.78] |
| 23 Neonatal hypocalcaemia | 1 | 137 | Risk Ratio (M-H, Fixed, 95% CI) | 0.55 [0.30, 1.03] |
| 23.1 FBG target < 4.44 v < 5.55 mmol/L | 1 | 137 | Risk Ratio (M-H, Fixed, 95% CI) | 0.55 [0.30, 1.03] |
| 24 Neonatal hypomagnesaemia | 1 | 127 | Risk Ratio (M-H, Fixed, 95% CI) | 0.65 [0.25, 1.68] |
| 24.1 FBG target < 4.44 v < 5.55 mmol/L | 1 | 127 | Risk Ratio (M-H, Fixed, 95% CI) | 0.65 [0.25, 1.68] |
Comparison 2.
Tight versus moderate glycaemic control
| Outcome or subgroup title | No. of studies | No. of participants | Statistical method | Effect size |
|---|---|---|---|---|
| 1 Perinatal mortality | 1 | 45 | Risk Ratio (M-H, Fixed, 95% CI) | 0.0 [0.0, 0.0] |
| 1.1 FBG target ≤ 5.6 v 5.6 to 6.7 mmol/L | 1 | 45 | Risk Ratio (M-H, Fixed, 95% CI) | 0.0 [0.0, 0.0] |
| 2 Pre-eclampsia | 1 | 45 | Risk Ratio (M-H, Fixed, 95% CI) | 5.29 [0.23, 122.91] |
| 2.1 FBG target ≤ 5.6 mmol/L v 5.6 to 6.7 mmol/L | 1 | 45 | Risk Ratio (M-H, Fixed, 95% CI) | 5.29 [0.23, 122.91] |
| 3 Caesarean section | 1 | 45 | Risk Ratio (M-H, Fixed, 95% CI) | 1.21 [0.22, 6.50] |
| 3.1 FBG target ≤ 5.6 v 5.6 to 6.7 mmol/L | 1 | 45 | Risk Ratio (M-H, Fixed, 95% CI) | 1.21 [0.22, 6.50] |
| 4 Maternal hypoglycaemia in first half of pregnancy | 1 | 45 | Risk Ratio (M-H, Fixed, 95% CI) | 26.47 [1.61, 435.38] |
| 4.1 FBG target ≤ 5.6 v 5.6 to 6.7 mmol/L | 1 | 45 | Risk Ratio (M-H, Fixed, 95% CI) | 26.47 [1.61, 435.38] |
| 5 Transient maternal hypertension | 1 | 45 | Risk Ratio (M-H, Fixed, 95% CI) | 0.59 [0.03, 13.66] |
| 5.1 FBG target ≤ 5.6 v 5.6 to 6.7 mmol/L | 1 | 45 | Risk Ratio (M-H, Fixed, 95% CI) | 0.59 [0.03, 13.66] |
| 6 Respiratory distress syndrome | 1 | 45 | Risk Ratio (M-H, Fixed, 95% CI) | 0.91 [0.09, 9.24] |
| 6.1 FBG target ≤ 5.6 v 5.6 to 6.7 mmol/L | 1 | 45 | Risk Ratio (M-H, Fixed, 95% CI) | 0.91 [0.09, 9.24] |
| 7 Birthweight > 90th centile | 1 | 45 | Risk Ratio (M-H, Fixed, 95% CI) | 0.0 [0.0, 0.0] |
| 7.1 FBG target ≤ 5.6 v 5.6 to 6.7 mmol/L | 1 | 45 | Risk Ratio (M-H, Fixed, 95% CI) | 0.0 [0.0, 0.0] |
Comparison 3.
Tight-moderate versus loose glycaemic control
| Outcome or subgroup title | No. of studies | No. of participants | Statistical method | Effect size |
|---|---|---|---|---|
| 1 Perinatal mortality | 1 | 60 | Risk Ratio (M-H, Fixed, 95% CI) | 0.07 [0.00, 1.37] |
| 1.1 FBG target ≤ 6.7 v 6.7 to 8.9 mmol/L | 1 | 60 | Risk Ratio (M-H, Fixed, 95% CI) | 0.07 [0.00, 1.37] |
| 2 Pre-eclampsia | 1 | 60 | Risk Ratio (M-H, Fixed, 95% CI) | 0.11 [0.01, 0.99] |
| 2.1 FBG ≤ 6.7 mmol/L v 6.7 to 8.9 mmol/L | 1 | 60 | Risk Ratio (M-H, Fixed, 95% CI) | 0.11 [0.01, 0.99] |
| 3 Caesarean section | 1 | 60 | Risk Ratio (M-H, Fixed, 95% CI) | 0.28 [0.10, 0.78] |
| 3.1 FBG target ≤ 6.7 v 6.7 to 8.9 mmol/L | 1 | 60 | Risk Ratio (M-H, Fixed, 95% CI) | 0.28 [0.10, 0.78] |
| 4 Maternal hypoglycaemia in first half of pregnancy | 1 | 60 | Risk Ratio (M-H, Fixed, 95% CI) | 5.22 [0.32, 86.28] |
| 4.1 FBG target ≤ 6.7 v 6.7 to 8.9 mmol/L | 1 | 60 | Risk Ratio (M-H, Fixed, 95% CI) | 5.22 [0.32, 86.28] |
| 5 Transient maternal hypertension | 1 | 45 | Risk Ratio (M-H, Fixed, 95% CI) | 1.81 [0.12, 27.07] |
| 5.1 FBG target ≤ 6.7 v 6.7 to 8.9 mmol/L | 1 | 45 | Risk Ratio (M-H, Fixed, 95% CI) | 1.81 [0.12, 27.07] |
| 6 Respiratory distress syndrome | 1 | 60 | Risk Ratio (M-H, Fixed, 95% CI) | 0.17 [0.05, 0.59] |
| 6.1 FBG target ≤ 6.7 v 6.7 to 8.9 mmol/L | 1 | 60 | Risk Ratio (M-H, Fixed, 95% CI) | 0.17 [0.05, 0.59] |
| 7 Birthweight > 90th centile | 1 | 60 | Risk Ratio (M-H, Fixed, 95% CI) | 0.01 [8.11, 0.20] |
| 7.1 FBG target ≤ 6.7 v 6.7 to 8.9 mmol/L | 1 | 60 | Risk Ratio (M-H, Fixed, 95% CI) | 0.01 [8.11, 0.20] |
Analysis 1.1. Comparison 1 Very tight versus tight-moderate glycaemic control, Outcome 1 Perinatal mortality
Review: Different intensities of glycaemic control for pregnant women with pre-existing diabetes
Comparison: 1 Very tight versus tight-moderate glycaemic control
Outcome: 1 Perinatal mortality
 |
Analysis 1.2. Comparison 1 Very tight versus tight-moderate glycaemic control, Outcome 2 Serious perinatal morbidity
Review: Different intensities of glycaemic control for pregnant women with pre-existing diabetes
Comparison: 1 Very tight versus tight-moderate glycaemic control
Outcome: 2 Serious perinatal morbidity
 |
Analysis 1.3. Comparison 1 Very tight versus tight-moderate glycaemic control, Outcome 3 Birth defects
Review: Different intensities of glycaemic control for pregnant women with pre-existing diabetes
Comparison: 1 Very tight versus tight-moderate glycaemic control
Outcome: 3 Birth defects
 |
Analysis 1.4. Comparison 1 Very tight versus tight-moderate glycaemic control, Outcome 4 Caesarean
Review: Different intensities of glycaemic control for pregnant women with pre-existing diabetes
Comparison: 1 Very tight versus tight-moderate glycaemic control
Outcome: 4 Caesarean
 |
Analysis 1.5. Comparison 1 Very tight versus tight-moderate glycaemic control, Outcome 5 Pregnancy-induced hypertension
Review: Different intensities of glycaemic control for pregnant women with pre-existing diabetes
Comparison: 1 Very tight versus tight-moderate glycaemic control
Outcome: 5 Pregnancy-induced hypertension
 |
Analysis 1.6. Comparison 1 Very tight versus tight-moderate glycaemic control, Outcome 6 Chronic hypertension
Review: Different intensities of glycaemic control for pregnant women with pre-existing diabetes
Comparison: 1 Very tight versus tight-moderate glycaemic control
Outcome: 6 Chronic hypertension
 |
Analysis 1.7. Comparison 1 Very tight versus tight-moderate glycaemic control, Outcome 7 blood glucose (mean, mmol/L)
Review: Different intensities of glycaemic control for pregnant women with pre-existing diabetes
Comparison: 1 Very tight versus tight-moderate glycaemic control
Outcome: 7 Self-monitored blood glucose (mean, mmol/L)
 |
Analysis 1.8. Comparison 1 Very tight versus tight-moderate glycaemic control, Outcome 8 Self-monitored blood glucose tests/day
Review: Different intensities of glycaemic control for pregnant women with pre-existing diabetes
Comparison: 1 Very tight versus tight-moderate glycaemic control
Outcome: 8 Self-monitored blood glucose tests/day
 |
Analysis 1.9. Comparison 1 Very tight versus tight-moderate glycaemic control, Outcome 9 HbA1c (%): first trimester
Review: Different intensities of glycaemic control for pregnant women with pre-existing diabetes
Comparison: 1 Very tight versus tight-moderate glycaemic control
Outcome: 9 HbA1c (%): first trimester
 |
Analysis 1.10. Comparison 1 Very tight versus tight-moderate glycaemic control, Outcome 10 HbA1c (%): second trimester
Review: Different intensities of glycaemic control for pregnant women with pre-existing diabetes
Comparison: 1 Very tight versus tight-moderate glycaemic control
Outcome: 10 HbA1c (%): second trimester
 |
Analysis 1.11. Comparison 1 Very tight versus tight-moderate glycaemic control, Outcome 11 HbA1c (%): third trimester
Review: Different intensities of glycaemic control for pregnant women with pre-existing diabetes
Comparison: 1 Very tight versus tight-moderate glycaemic control
Outcome: 11 HbA1c (%): third trimester
 |
Analysis 1.12. Comparison 1 Very tight versus tight-moderate glycaemic control, Outcome 12 Mean preprandial glucose (mmol/L)
Review: Different intensities of glycaemic control for pregnant women with pre-existing diabetes
Comparison: 1 Very tight versus tight-moderate glycaemic control
Outcome: 12 Mean preprandial glucose (mmol/L)
 |
Analysis 1.13. Comparison 1 Very tight versus tight-moderate glycaemic control, Outcome 13 Mean postprandial glucose (mmol/L)
Review: Different intensities of glycaemic control for pregnant women with pre-existing diabetes
Comparison: 1 Very tight versus tight-moderate glycaemic control
Outcome: 13 Mean postprandial glucose (mmol/L)
 |
Analysis 1.14. Comparison 1 Very tight versus tight-moderate glycaemic control, Outcome 14 Percent days below FBG threshold of 1 result less than:
Review: Different intensities of glycaemic control for pregnant women with pre-existing diabetes
Comparison: 1 Very tight versus tight-moderate glycaemic control
Outcome: 14 Percent days below FBG threshold of 1 result less than:
 |
Analysis 1.15. Comparison 1 Very tight versus tight-moderate glycaemic control, Outcome 15 More than 1 subjective hypoglycaemic episode (% of days)
Review: Different intensities of glycaemic control for pregnant women with pre-existing diabetes
Comparison: 1 Very tight versus tight-moderate glycaemic control
Outcome: 15 More than 1 subjective hypoglycaemic episode (% of days)
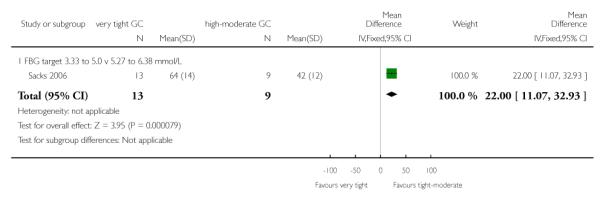 |
Analysis 1.16. Comparison 1 Very tight versus tight-moderate glycaemic control, Outcome 16 Maternal weight gain during pregnancy (kg/week)
Review: Different intensities of glycaemic control for pregnant women with pre-existing diabetes
Comparison: 1 Very tight versus tight-moderate glycaemic control
Outcome: 16 Maternal weight gain during pregnancy (kg/week)
 |
Analysis 1.17. Comparison 1 Very tight versus tight-moderate glycaemic control, Outcome 17 Maternal hospitalisation (days)
Review: Different intensities of glycaemic control for pregnant women with pre-existing diabetes
Comparison: 1 Very tight versus tight-moderate glycaemic control
Outcome: 17 Maternal hospitalisation (days)
 |
Analysis 1.18. Comparison 1 Very tight versus tight-moderate glycaemic control, Outcome 18 Gestational age (weeks)
Review: Different intensities of glycaemic control for pregnant women with pre-existing diabetes
Comparison: 1 Very tight versus tight-moderate glycaemic control
Outcome: 18 Gestational age (weeks)
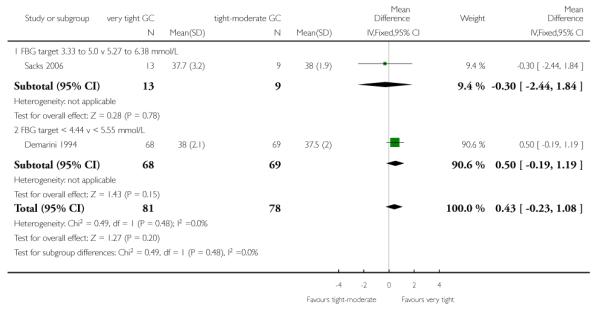 |
Analysis 1.19. Comparison 1 Very tight versus tight-moderate glycaemic control, Outcome 19 Birthweight (g)
Review: Different intensities of glycaemic control for pregnant women with pre-existing diabetes
Comparison: 1 Very tight versus tight-moderate glycaemic control
Outcome: 19 Birthweight (g)
 |
Analysis 1.20. Comparison 1 Very tight versus tight-moderate glycaemic control, Outcome 20 Apgar score
Review: Different intensities of glycaemic control for pregnant women with pre-existing diabetes
Comparison: 1 Very tight versus tight-moderate glycaemic control
Outcome: 20 Apgar score
 |
Analysis 1.21. Comparison 1 Very tight versus tight-moderate glycaemic control, Outcome 21 Fetal distress
Review: Different intensities of glycaemic control for pregnant women with pre-existing diabetes
Comparison: 1 Very tight versus tight-moderate glycaemic control
Outcome: 21 Fetal distress
 |
Analysis 1.22. Comparison 1 Very tight versus tight-moderate glycaemic control, Outcome 22 Asphyxia
Review: Different intensities of glycaemic control for pregnant women with pre-existing diabetes
Comparison: 1 Very tight versus tight-moderate glycaemic control
Outcome: 22 Asphyxia
 |
Analysis 1.23. Comparison 1 Very tight versus tight-moderate glycaemic control, Outcome 23 Neonatal hypocalcaemia
Review: Different intensities of glycaemic control for pregnant women with pre-existing diabetes
Comparison: 1 Very tight versus tight-moderate glycaemic control
Outcome: 23 Neonatal hypocalcaemia
 |
Analysis 1.24. Comparison 1 Very tight versus tight-moderate glycaemic control, Outcome 24 Neonatal hypomagnesaemia
Review: Different intensities of glycaemic control for pregnant women with pre-existing diabetes
Comparison: 1 Very tight versus tight-moderate glycaemic control
Outcome: 24 Neonatal hypomagnesaemia
 |
Analysis 2.1. Comparison 2 Tight versus moderate glycaemic control, Outcome 1 Perinatal mortality
Review: Different intensities of glycaemic control for pregnant women with pre-existing diabetes
Comparison: 2 Tight versus moderate glycaemic control
Outcome: 1 Perinatal mortality
 |
Analysis 2.2. Comparison 2 Tight versus moderate glycaemic control, Outcome 2 Pre-eclampsia
Review: Different intensities of glycaemic control for pregnant women with pre-existing diabetes
Comparison: 2 Tight versus moderate glycaemic control
Outcome: 2 Pre-eclampsia
 |
Analysis 2.3. Comparison 2 Tight versus moderate glycaemic control, Outcome 3 Caesarean section
Review: Different intensities of glycaemic control for pregnant women with pre-existing diabetes
Comparison: 2 Tight versus moderate glycaemic control
Outcome: 3 Caesarean section
 |
Analysis 2.4. Comparison 2 Tight versus moderate glycaemic control, Outcome 4 Maternal hypoglycaemia in first half of pregnancy
Review: Different intensities of glycaemic control for pregnant women with pre-existing diabetes
Comparison: 2 Tight versus moderate glycaemic control
Outcome: 4 Maternal hypoglycaemia in first half of pregnancy
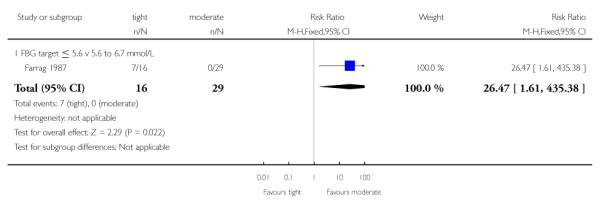 |
Analysis 2.5. Comparison 2 Tight versus moderate glycaemic control, Outcome 5 Transient maternal hypertension
Review: Different intensities of glycaemic control for pregnant women with pre-existing diabetes
Comparison: 2 Tight versus moderate glycaemic control
Outcome: 5 Transient maternal hypertension
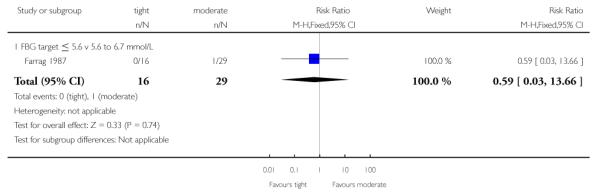 |
Analysis 2.6. Comparison 2 Tight versus moderate glycaemic control, Outcome 6 Respiratory distress syndrome
Review: Different intensities of glycaemic control for pregnant women with pre-existing diabetes
Comparison: 2 Tight versus moderate glycaemic control
Outcome: 6 Respiratory distress syndrome
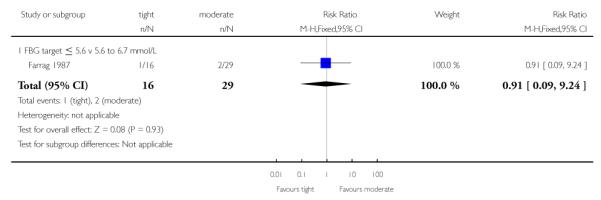 |
Analysis 2.7. Comparison 2 Tight versus moderate glycaemic control, Outcome 7 Birthweight > 90th centile
Review: Different intensities of glycaemic control for pregnant women with pre-existing diabetes
Comparison: 2 Tight versus moderate glycaemic control
Outcome: 7 Birthweight > 90th centile
 |
Analysis 3.1. Comparison 3 Tight-moderate versus loose glycaemic control, Outcome 1 Perinatal mortality
Review: Different intensities of glycaemic control for pregnant women with pre-existing diabetes
Comparison: 3 Tight-moderate versus loose glycaemic control
Outcome: 1 Perinatal mortality
 |
Analysis 3.2. Comparison 3 Tight-moderate versus loose glycaemic control, Outcome 2 Pre-eclampsia
Review: Different intensities of glycaemic control for pregnant women with pre-existing diabetes
Comparison: 3 Tight-moderate versus loose glycaemic control
Outcome: 2 Pre-eclampsia
 |
Analysis 3.3. Comparison 3 Tight-moderate versus loose glycaemic control, Outcome 3 Caesarean section
Review: Different intensities of glycaemic control for pregnant women with pre-existing diabetes
Comparison: 3 Tight-moderate versus loose glycaemic control
Outcome: 3 Caesarean section
 |
Analysis 3.4. Comparison 3 Tight-moderate versus loose glycaemic control, Outcome 4 Maternal hypoglycaemia in first half of pregnancy
Review: Different intensities of glycaemic control for pregnant women with pre-existing diabetes
Comparison: 3 Tight-moderate versus loose glycaemic control
Outcome: 4 Maternal hypoglycaemia in first half of pregnancy
 |
Analysis 3.5. Comparison 3 Tight-moderate versus loose glycaemic control, Outcome 5 Transient maternal hypertension
Review: Different intensities of glycaemic control for pregnant women with pre-existing diabetes
Comparison: 3 Tight-moderate versus loose glycaemic control
Outcome: 5 Transient maternal hypertension
 |
Analysis 3.6. Comparison 3 Tight-moderate versus loose glycaemic control, Outcome 6 Respiratory distress syndrome
Review: Different intensities of glycaemic control for pregnant women with pre-existing diabetes
Comparison: 3 Tight-moderate versus loose glycaemic control
Outcome: 6 Respiratory distress syndrome
 |
Analysis 3.7. Comparison 3 Tight-moderate versus loose glycaemic control, Outcome 7 Birthweight > 90th centile
Review: Different intensities of glycaemic control for pregnant women with pre-existing diabetes
Comparison: 3 Tight-moderate versus loose glycaemic control
Outcome: 7 Birthweight > 90th centile
 |
HISTORY
Protocol first published: Issue 6, 2010
Review first published: Issue 9, 2010
DIFFERENCES BETWEEN PROTOCOL AND REVIEW
The scope of the review has been expanded to include moderate and loose glycaemic control as well as tight and very tight control, resulting in a title change and changes to the objectives.
Footnotes
WHAT’S NEW Last assessed as up-to-date: 24 May 2012.
| Date | Event | Description |
|---|---|---|
| 23 May 2012 | New citation required but conclusions have not changed | No additional studies identified from most recent search, so conclusions not changed |
| 30 April 2012 | New search has been performed | New search identified no additional studies. Background and discussion updated |
DECLARATIONS OF INTEREST None known.
References to studies included in this review
- Demarini 1994 {published data only} .Demarini S, Mimouni F, Tsang RC, Khoury J, Hertzberg V. Impact of metabolic control of diabetes during pregnancy on neonatal hypocalcemia: a randomized study. Obstetrics and Gynecology. 1994;83(6):918–22. doi: 10.1097/00006250-199406000-00003. [DOI] [PubMed] [Google Scholar]; Mimouni F, Miodovnik M, Whitsett JA, Holyroyde JC, Siddiqi TA, Tsang RC. Respiratory distress syndrome in infants of diabetic mothers in the 1980s: no direct adverse effect of maternal diabetes with modern management. Obstetrics and Gynecology. 1987;69:191–5. [PubMed] [Google Scholar]
- Farrag 1987 {published data only} .Farrag OAM. Prospective study of 3 metabolic regimens in pregnant diabetes. Australian and New Zealand Journal of Obstetrics and Gynaecology. 1987;27:6–9. doi: 10.1111/j.1479-828x.1987.tb00921.x. [DOI] [PubMed] [Google Scholar]
- Sacks 2006 {published data only} .Sacks DA, Feig DS, Liu Ai-L, Wolde-Tsadik G. Managing type 1 diabetes in pregnancy: how near normal is necessary? Journal of Perinatology. 2006;26:458–62. doi: 10.1038/sj.jp.7211546. [DOI] [PubMed] [Google Scholar]
References to studies excluded from this review
- DCCT 1996a {published data only} .The Diabetes Control and Complications Trial Research Group Effect of pregnancy on microvascular complications in the Diabetes Control and Complications Trial. Diabetes Care. 2000;23(8):1084–91. doi: 10.2337/diacare.23.8.1084. [DOI] [PMC free article] [PubMed] [Google Scholar]; The Diabetes Control and Complications Trial Research Group Pregnancy outcomes in the Diabetes Control and Complications Trial. American Journal of Obstetrics and Gynecology. 1996;174(4):1343–53. doi: 10.1016/s0002-9378(96)70683-x. [DOI] [PubMed] [Google Scholar]
Additional references
- ACOG 2005 .ACOG Pregestational diabetes mellitus: ACOG Practice Bulletin Number 60. Obstetrics & Gynecology. 2005;105(3):675–85. doi: 10.1097/00006250-200503000-00049. [DOI] [PubMed] [Google Scholar]
- ADIPS 2005 . [accessed 2009];The Australasian Diabetes in Pregnancy Society consensus guidelines for the management of patients with type 1 and type 2 diabetes in relation to pregnancy. 2005 www.adips.org/content/ADIPS.PreGDM.Guidelines.pdf. [PubMed]
- Albrecht 2010 .Albrecht SS, Kuklina EV, Bansil P, Jamieson DJ, Whiteman MK, Kourtis AP, et al. Diabetes trends among delivery hospitalizations in the U.S., 1994-2004. Diabetes Care. 2010;33:768–73. doi: 10.2337/dc09-1801. [DOI] [PMC free article] [PubMed] [Google Scholar]
- Balsells 2009 .Balsells M, Garcia-Patterson A, Gich I, Corcoy R. Maternal and fetal outcome in women with type 2 versus type 1 diabetes: a systematic review and metaanalysis. Journal of Clinical Endocrinology and Metabolism. 2009;94(11):4284–91. doi: 10.1210/jc.2009-1231. [DOI] [PubMed] [Google Scholar]
- Bell 2008 .Bell R, Bailey K, Cresswell T, Hawthorne G, Critchley J, Lewis-Barned N, on behalf of the Northern Diabetic Pregnancy Survey Steering Group Trends in prevalence and outcomes of pregnancy in women with pre-existing type I and type II diabetes. BJOG: an international journal of obstetrics and gynaecology. 2008;115(4):445–52. doi: 10.1111/j.1471-0528.2007.01644.x. [DOI] [PubMed] [Google Scholar]
- Casele 1998 .Casele HD, Laifer SA. Factors influencing preconception control of glycemia in diabetic women. Archives of Internal Medicine. 1998;158(12):1321–4. doi: 10.1001/archinte.158.12.1321. [DOI] [PubMed] [Google Scholar]
- CEMACH 2007 .Modder J, Fleming K, Acolet D. [accessed 2009];Diabetes in pregnancy: are we providing the best possible care? Findings of a NationalEnquiry. 2007 http://www.cmace.org.uk/getdoc/f4ec2aca-963b-4997-be80-ac17a4492ea4/Diabetes-in-Pregnancy.aspx.
- Colman 1997 .Colman PG, Goodall IG, Garcia-Webb P, Williams PF, Dunlop ME. Glycohaemoglobin: a crucial measurement in modern diabetes management. Progress towards standardization and improved precision of measurement. Medical Journal of Australia. 1997;167(2):96–8. doi: 10.5694/j.1326-5377.1997.tb138790.x. [DOI] [PubMed] [Google Scholar]
- Dabelea 2000 .Dabelea D, Knowler WC, Pettitt DJ. Effect of diabetes in pregnancy on offspring: follow-up research in the Pima Indians. Journal of Maternal-Fetal Medicine. 2000;9(1):83–8. doi: 10.1002/(SICI)1520-6661(200001/02)9:1<83::AID-MFM17>3.0.CO;2-O. [DOI] [PubMed] [Google Scholar]
- DCCT 1993 .Diabetes Control and Complications Trial (DCCT) Research Group The effect of intensive treatment of diabetes on the development and progression of long-term complications in insulin-dependent diabetes. New England Journal of Medicine. 1993;329(14):977–86. doi: 10.1056/NEJM199309303291401. [DOI] [PubMed] [Google Scholar]
- DCCT 1996b .The Diabetes Control and Complications Trial Research Group Pregnancy outcomes in the Diabetes Control and Complications Trial. American Journal of Obstetrics and Gynecology. 1996;174(4):1343–53. doi: 10.1016/s0002-9378(96)70683-x. [DOI] [PubMed] [Google Scholar]
- De Veciana 1995 .De Veciana M, Major CA, Morgan MA, Asrat T, Toohey JS, Lien JM, et al. Postprandial versus preprandial blood glucose monitoring in women with gestational diabetes mellitus requiring insulin therapy. New England Journal of Medicine. 1995;333(19):1237–41. doi: 10.1056/NEJM199511093331901. [DOI] [PubMed] [Google Scholar]
- Dunne 2005 .Dunne F. Type 2 diabetes and pregnancy. Seminars in Fetal and Neonatal Medicine. 2005;10(4):333–9. doi: 10.1016/j.siny.2005.04.007. [DOI] [PubMed] [Google Scholar]
- Farrar 2007 .Farrar D, Tuffnell DJ, West J. Continuous subcutaneous insulin infusion versus multiple daily injections of insulin for pregnant women with diabetes. Cochrane Database of Systematic Reviews. 2007;(Issue 3) doi: 10.1002/14651858.CD005542.pub2. [DOI: 10.1002/14651858.CD005542.pub2] [DOI] [PubMed] [Google Scholar]
- Galerneau 2004 .Galerneau F, Inzucchi SE. Diabetes mellitus in pregnancy. Obstetrics and Gynecology Clinics of North America. 2004;31(4):907–33. doi: 10.1016/j.ogc.2004.09.002. [DOI] [PubMed] [Google Scholar]
- Griffith 2004 .Griffith J, Conway DL. Care of diabetes in pregnancy. Obstetrics and Gynecology Clinics of North America. 2004;31(2):243–56. doi: 10.1016/j.ogc.2004.03.002. [DOI] [PubMed] [Google Scholar]
- Hemmingsen 2011 .Hemmingsen B, Lund SS, Gluud C, Vaag A, Almdal T, Hemmingsen C, et al. Targeting intensive glycaemic control versus targeting conventional glycaemic control for type 2 diabetes mellitus. Cochrane Database of Systematic Reviews. 2011;(Issue 6) doi: 10.1002/14651858.CD008143.pub2. [DOI: 10.1002/14651858.CD008143.pub2] [DOI] [PubMed] [Google Scholar]
- Higgins 2011 .Higgins JPT, Green S, editors. Cochrane Handbook for Systematic Reviews of Interventions. Version 5.1.0. The Cochrane Collaboration; [updated March 2011]. 2011. Available from www.cochrane-handbook.org. [Google Scholar]
- Home 2008 .Home P. Safety of very tight blood glucose control in type 2 diabetes. BMJ. 2008;336(7642):458–9. doi: 10.1136/bmj.39499.514410.80. [DOI] [PMC free article] [PubMed] [Google Scholar]
- Inkster 2006 .Inkster ME, Fahey TP, Donnan PT, Leese GP, Mires GJ, Murphy DJ. Poor glycated haemoglobin control and adverse pregnancy outcomes in type 1 and type 2 diabetes mellitus: systematic review of observational studies. BMC Pregnancy and Childbirth. 2006;6:30. doi: 10.1186/1471-2393-6-30. [DOI] [PMC free article] [PubMed] [Google Scholar]
- Jensen 2004 .Jensen DM, Dam P, Moelsted-Pedersen L, Ovesen P, Westergaard JG, Moeller M, et al. Outcomes in type 1 diabetic pregnancies. Diabetes Care. 2004;27(12):2819–23. doi: 10.2337/diacare.27.12.2819. [DOI] [PubMed] [Google Scholar]
- Jones 2011 .Jones G, Barker G, Goodall I, Schneider HG, Shephard M, Twigg S. Change of HbA1C reporting to the new SI units. Medical Journal of Australia. 2011;195(1):45–6. doi: 10.5694/j.1326-5377.2011.tb03190.x. [DOI] [PubMed] [Google Scholar]
- Kelly 2009 .Kelly TN, Bazzano LA, Fonseca VA, Thethi TK, Reynolds K, He J. Systematic review: glucose control and cardiovascular disease in type 2 diabetes. Annals of Internal Medicine. 2009;151:394–403. doi: 10.7326/0003-4819-151-6-200909150-00137. [DOI] [PubMed] [Google Scholar]
- King 2009 .King R, Wellard S. Juggling type 1 diabetes and pregnancy in rural Australia. Midwifery. 2009;25(2):126–33. doi: 10.1016/j.midw.2007.01.016. [DOI] [PubMed] [Google Scholar]
- Kinsley 2007 .Kinsley B. Achieving better outcomes in pregnancies complicated by type 1 and type 2 diabetes mellitus. Clinical Therapeutics. 2007;29(Suppl D):S153–S160. doi: 10.1016/j.clinthera.2007.12.015. [DOI] [PubMed] [Google Scholar]
- Langer 1994 .Langer O, Rodriguez DA, Xenakis EM, McFarland MB, Berkus MD, Arrendondo F. Intensified versus conventional management of gestational diabetes. American Journal of Obstetrics and Gynecology. 1994;172(5):1642–3. doi: 10.1016/s0002-9378(94)70097-4. [DOI] [PubMed] [Google Scholar]
- Langer 2008 .Langer O. Type 2 diabetes in pregnancy: exposing deceptive appearances. Journal of Maternal-Fetal Medicine. 2008;21(3):181–9. doi: 10.1080/14767050801929497. [DOI] [PubMed] [Google Scholar]
- Macintosh 2006 .Macintosh MC, Fleming KM, Bailey JA, Doyle P, Modder J, Acolet D, et al. Perinatal mortality and congenital anomalies in babies of women with type 1 and type 2 diabetes in England, Wales and Northern Ireland: population based study. BMJ. 2006;333(7560):177. doi: 10.1136/bmj.38856.692986.AE. [DOI] [PMC free article] [PubMed] [Google Scholar]
- Manderson 2003 .Manderson JG, Patterson CC, Hadden DR, Traub AI, Ennis C, McCance DR. Preprandial versus postprandial blood glucose monitoring in type 1 diabetic pregnancy: a randomized controlled clinical trial. American Journal of Obstetrics and Gynecology. 2003;189:507–12. doi: 10.1067/s0002-9378(03)00497-6. [DOI] [PubMed] [Google Scholar]
- McElduff 2005a .McElduff A, Cheung NW, McIntyre HD, Lagström JA, Oats JJN, Ross GP, et al. The Australasian Diabetes in Pregnancy Society consensus guidelines for the management of type 1 and type 2 diabetes in relation to pregnancy. Medical Journal of Australia. 2005;183(7):373–7. [PubMed] [Google Scholar]
- McElduff 2005b .McElduff A, Ross GP, Lagström JA, Champion B, Flack JR, Lau SM, et al. Pregestational diabetes and pregnancy: an Australian experience. Diabetes Care. 2005;28(5):1261–2. doi: 10.2337/diacare.28.5.1260. [DOI] [PubMed] [Google Scholar]
- Modder 2008 .Modder J. Diabetes in pregnancy: can we make a difference? BJOG: an international journal of obstetrics and gynaecology. 2008;115(4):419–20. doi: 10.1111/j.1471-0528.2007.01643.x. [DOI] [PubMed] [Google Scholar]
- Montori 2009 .Montori VM, Fernández-Balsells M. Glycemic control in type 2 diabetes: time for an evidence-based about-face? Annals of Internal Medicine. 2009;150(11):803–8. doi: 10.7326/0003-4819-150-11-200906020-00008. [DOI] [PubMed] [Google Scholar]
- Murphy 2008 .Murphy HR, Rayman G, Lewis K, Kelly S, Johal B, Duffield K, et al. Effectiveness of continuous glucose monitoring in pregnant women with diabetes: randomised clinical trial. BMJ. 2008;337:a1680. doi: 10.1136/bmj.a1680. [DOI] [PMC free article] [PubMed] [Google Scholar]
- Murphy 2009 .Murphy HR. Integrating educational and technological interventions to improve pregnancy outcomes in women with diabetes. Diabetes, Obesity and Metabolism. 2009;12(2):97–104. doi: 10.1111/j.1463-1326.2009.01145.x. [DOI] [PubMed] [Google Scholar]
- NICE 2008 .National Institute for Health and Clinical Excellence . Diabetes in pregnancy: management of diabetes and its complications from preconception to the postnatal period. NICE; London: 2008. [PubMed] [Google Scholar]
- Pelaez-Crisologo 2009 .Pelaez-Crisologo MCG, Castillo-Torralba MGAGN, Festin MR. Different techniques of blood glucose monitoring in women with gestational diabetes for improving maternal and infant health. Cochrane Database of Systematic Reviews. 2009;(Issue 2) [DOI: 10.1002/14651858.CD007790] [Google Scholar]
- Platt 2002 .Platt MJ, Stanisstreet M, Casson IF, Howard CV, Walkinshaw S, Pennycook S, et al. St Vincent’s Declaration 10 years on: outcomes of diabetic pregnancies. Diabetic Medicine. 2002;19(3):216–20. doi: 10.1046/j.1464-5491.2002.00665.x. [DOI] [PubMed] [Google Scholar]
- Ray 2001 .Ray JG, Vermeulen MJ, Shapiro JL, Kenshole AB. Maternal and neonatal outcomes in pregestational and gestational diabetes mellitus, and the influence of maternal obesity and weight gain: the DEPOSIT study. QJM: an international journal of medicine. 2001;94(7):347–56. doi: 10.1093/qjmed/94.7.347. [DOI] [PubMed] [Google Scholar]
- RevMan 2011 .The Nordic Cochrane Centre. The Cochrane Collaboration . Review Manager (RevMan). 5.1. The Nordic Cochrane Centre, The Cochrane Collaboration; Copenhagen: 2011. [Google Scholar]
- Sacks 1997 .Sacks DA, Chen W, Greenspoon JS, Wolde-Tsadik G. Should the same glucose values be targeted for type 1 as for type 2 diabetics in pregnancy? American Journal of Obstetrics and Gynecology. 1997;177:1113–9. doi: 10.1016/s0002-9378(97)70025-5. [DOI] [PubMed] [Google Scholar]
- Schneider 2007 .Schneider HG, Goodall I, Colman PG, McLean M, Barker G, for the Australian Working Party for HbA1c standardization New haemoglobin A1c: the way it is reported is about to change…. Internal Medicine Journal. 2007;37(4):213–5. doi: 10.1111/j.1445-5994.2006.01302.x. [DOI] [PubMed] [Google Scholar]
- Steel 1990 .Steel JM, Johnstone FD, Hepburn DA, Smith AF. Can prepregnancy care of diabetic women reduce the risk of abnormal babies? BMJ. 1990;301(6760):1070–4. doi: 10.1136/bmj.301.6760.1070. [DOI] [PMC free article] [PubMed] [Google Scholar]
- Tieu 2010 .Tieu J, Coat S, Hague W, Middleton P. Oral anti-diabetic agents for women with pre-existing diabetes mellitus/ impaired glucose tolerance or previous gestational diabetes mellitus. Cochrane Database of Systematic Reviews. 2010;(Issue 10) doi: 10.1002/14651858.CD007724.pub2. [DOI: 10.1002/14651858.CD007724.pub2] [DOI] [PMC free article] [PubMed] [Google Scholar]
- Walkinshaw 2005 .Walkinshaw SA. Pregnancy in women with pre-existing diabetes: management issues. Seminars in Fetal & Neonatal Medicine. 2005;10(4):307–15. doi: 10.1016/j.siny.2005.04.004. [DOI] [PubMed] [Google Scholar]
- Weintrob 1996 .Weintrob N, Karp M, Hod M. Short- and long-range complications in offspring of diabetic mothers. Journal of Diabetes and its Complications. 1996;10(5):294–301. doi: 10.1016/1056-8727(95)00080-1. [DOI] [PubMed] [Google Scholar]
- WHO 2006 .World Health Organization . Definition and diagnosis of diabetes mellitus and intermediate hyperglycemia: report of WHO/IDF consultation. WHO; Geneva: 2006. [Google Scholar]
- Willhoite 2007 .Willhoite MB, Bennert HW, Palomaki GE, Zaremba MM, Herman WH, Williams JR, et al. The impact of preconception counselling on pregnancy outcomes. The experience of the Maine Diabetes in Pregnancy Program. Diabetes Care. 1993;16(2):450–5. doi: 10.2337/diacare.16.2.450. [DOI] [PubMed] [Google Scholar]
References to other published versions of this review
- Middleton 2010 .Middleton P, Crowther CA, Simmonds L, Muller P. Different intensities of glycaemic control for pregnant women with pre-existing diabetes. Cochrane Database of Systematic Reviews. 2010;(Issue 9) doi: 10.1002/14651858.CD008540.pub2. [DOI: 10.1002/ 14651858.CD008540.pub2] [DOI] [PubMed] [Google Scholar]
- * Indicates the major publication for the study