

Abstract
The extent and role of aberrant DNA methylation in promoter CpG islands (CGIs) have been extensively studied in leukemia and other malignancies. Still, CGIs represent only a small fraction of the methylome. We aimed to characterize genome-wide differential methylation of cytogenetically normal AML (CN-AML) cells compared with normal CD34+ bone marrow cells using the Illumina® 450K methylation array. Differential methylation in CN-AML was most prominent in genomic areas far from CGIs, in so called open sea regions. Furthermore, differential methylation was specifically found in genes encoding transcription factors (TFs), with WT1 being the most differentially methylated TF. Among genetic mutations in AML, DNMT3A mutations showed the most prominent association with the DNA methylation pattern, characterized by hypomethylation of CGIs (as compared with DNMT3A wild type cases). The differential methylation in DNMT3A mutant cells vs. wild type cells was predominantly found in HOX genes, which were hypomethylated. These results were confirmed and validated in an independent CN-AML cohort. In conclusion, we show that, in CN-AML, the most pronounced changes in DNA methylation occur in non-CGI regions and that DNMT3A mutations confer a pattern of global hypomethylation that specifically targets HOX genes.
Keywords: acute myeloid leukemia, DNA methylation, non-CGI region, DNMT3A, Homeobox gene family
Introduction
Cytogenetically normal AML (CN-AML) constitutes between 40 to 50% of all AML cases.1 With the recent development in sequencing techniques, an increasing number of genetic mutations have been discovered in CN-AML. These include mutations in genes such as CEBPA, FLT3 and NPM1 that are now analyzed in clinical routine to better define the prognosis in CN-AML patients.2-4 In addition, frequent mutations in epigenetic regulators have been reported in AML, such as in TET2, MLL, IDH1, IDH2, ASXL1, and DNMT3A, and their presence is preferentially associated to unfavorable clinical outcomes.5,6
Epigenetic modifications are involved in the regulation of normal hematopoietic development.7,8 Cytogenetic and mutational status of AML patients have been shown to correlate to global methylation patterns but methylation patterns without common genetic features have also been reported.9 There are now an increasing number of studies reporting aberrant DNA methylation in various types of malignancies, including AML.9-13 New methods detecting DNA methylation on a genome-wide level have significantly widened our knowledge about aberrant methylation patterns in cancer. From a previous focus on CGIs located in the promoter of genes, changes can be found also in regions outside of CGIs, such as in CGIs shores, where methylation has been shown to be tissue- and cancer-specific.14 In total, the common occurrence of mutations in epigenetically modifying genes, as well as the recurrent and widespread epigenetic alterations in AML, suggest a pathogenic role for a dysregulated epigenetic machinery in AML. However, aberrant methylation patterns in AML have to be more thoroughly defined, especially outside of CGIs.
DNA methylation is catalyzed by a family of DNA methyltransferases (DNMTs) displaying varying substrate specificity. DNMT3A constitutes one of the enzymes mainly responsible for de novo methylation.15 DNMT3A is essential for normal hematopoietic cell differentiation and defects in DNMT3A and DNMT3B lead to impaired self-renewal capacity in mouse hematopoietic stem cell (HSC).16,17 DNMT3A mutations are among the most common mutations in AML18 and their presence have been linked to decreased methylation levels of some genes.19,20
In this study, we characterized DNA methylation alterations in CN-AML using the Illumina® HumanMethylation450K BeadChip Array.21 This array covers CGIs as well as regions increasingly far form CGIs, such as in CGI shores (up to 2 kb from CGIs), shelves (2–4 kb from CGIs) and in open sea (>4 kb from CGIs). Methylation patterns in AML were studied in relation to normal hematopoiesis, the mutational status of the leukemic, and gene expression patterns. We were able to demonstrate that genomic regions with the most prominent differential methylation in CN-AML are located outside CGIs; however, hypermethylation enrichment is only represented in CGIs. TFs such as WT1 and RUNX1 are highly differentially methylated in CN-AML patients. We show that the DNMT3A mutation has a dominant effect in determining the methylome in CN-AML, which results in a genome-wide hypomethylated phenotype.
Results
Characterization of the patient cohort
A total of 62 CN-AML patients were included in the primary study. The mean age at diagnosis was 52 y; 36 (58%) patients were male. Fifty-one patients with available survival data (91%) achieved a complete remission (CR) after one or two induction treatments. Median overall survival of the studied cohort was 828 d. The characteristics and mutational status of the patients are shown in Table 1. Among the 62 patients, 28 (48%) carried a DNMT3A mutation, 13 (21%) an IDH1 and/or IDH2 mutation, 30 (49%) a NPM1 mutation, and 23 (37%) a FLT3-ITD or FLT3-TKD mutation.
Table 1. Patient Characteristics of primary study cohort.
| Patient Characteristics | Class | Value |
|---|---|---|
| Gender | Total (male/female) | 62 (26/36) |
| Age at Diagnosis (yrs) | Average (range) | 52 (26.7–76.5) |
| CR After 1st or 2nd Induction | Achieved (total/percentage) | 51 (56/91%) |
| Overall survival | median in days (range) | 828 (36–3180) |
| Mutations | ||
| DNMT3A mutation | n (percentage) | 28 (48%) |
| IDH1/2 mutation | n (percentage) | 13 (22%) |
| IDH1 mutation | n (percentage) | 3 (5.0%) |
| IDH2 mutation | n (percentage) | 11 (18%) |
| NPM1 mutation | n (percentage) | 30 (49%) |
| FLT3 any | n (percentage) | 23 (37%) |
| FLT3-ITD | n (percentage) | 22 (36%) |
| FLT3 TKD-KTD | n (percentage) | 2 (3.3%) |
Aberrant DNA methylation in CN-AML depends on distance to CpG Islands
In order to characterize DNA methylation alterations in CN-AML, we compared methylation patterns in AML cases to normal CD34+ cells using the Illumina® 450K methylation array. Methylation at each CpG site was scored as a β-value ranging from 0 to 1. Average X chromosome methylation showed the expected pattern in female patients (Figure S1). DNA methylation was analyzed at 337721 autosomal CpG residues. Using a detected p-value threshold of 0.01 across all analyzed samples, a total of 12159 differentially methylated CpG sites (DMC) were identified by comparing CN-AML cells to normal CD34+ bone marrow cells, as described in Methods. Principal Component Analysis (PCA) on the DMC showed a pronounced heterogeneity among CN-AML samples compared with normal CD34+ controls (Fig. 1A). The methylation pattern of DMC showed a binormal distribution in the normal CD34+ cells, whereas they attained intermediate methylation levels in CN-AML, displaying a loss of the normal binormal methylation pattern (Fig. 1B). Studies of cancer-specific methylation aberrations have previously been focused on CGIs in promoter regions implicated in silencing of gene expression. However, differential methylation in non-CGIs, such as in CGI shores—spanning up to 2 kb distal to CGI—have been suggested to be the most deregulated regions in colorectal cancer.14 In order to elucidate what type of genomic regions (in relation to CGIs) were differentially methylated, we performed an enrichment analysis using Chi-square test (Fig. 1C). This analysis showed that the most enriched location of DMC was the open sea, with 35.6% of the DMCs (χ2, P value < 10e−5), compared with 29.5% content of open seas on the whole array. CGI shelves were the second most enriched location for DMC. In contrast, both CGIs and shore regions were underrepresented for DMC. These results suggest that methylation changes in CGI constitute a relatively small proportion of the aberrant DNA methylation in CN-AML. On the contrary, in CN-AML cells, aberrant DNA methylation is predominant in non-CGI regions.
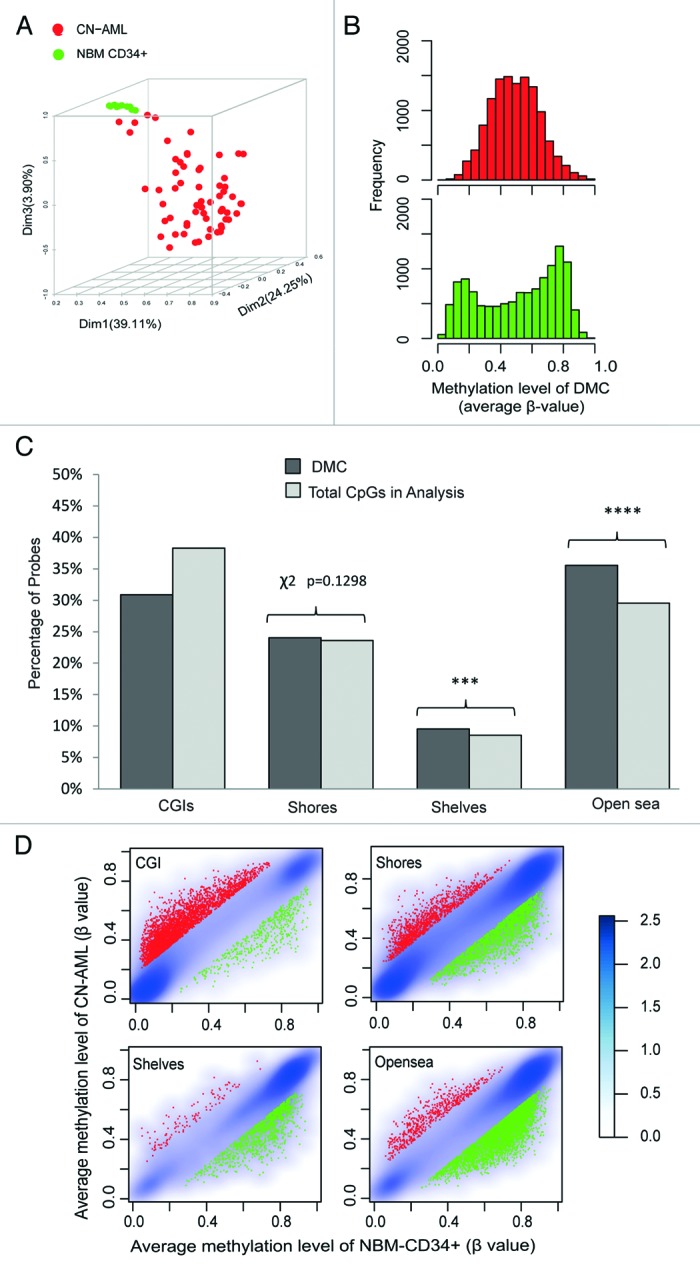
Figure 1. Differentially methylated CpG sites (DMC) between CN-AML and normal bone marrow CD34+ cells. DMC was defined by moderated Student’s T-test combined with ∆β-value between the two groups (FDR < 0.05 and ∆β > 0.17). (A) Principal component analysis (PCA) of DMC. (B) Density plots of DMC in CN-AML (upper panel in red) and NBM CD34+ (lower panel in green). (C) Distribution of DMC in different CpG regions compared with the proportions of all analyzed CpG sites on the platform. Enrichment analysis was performed by Chi-square test (χ2). D. Smoothed density scatter plot of average methylation levels in different CpG regions. Smoothed CpG densities show in gradient blue. Hypermethylated DMC is marked in red and hypomethylated DMC in green.
Hypermethylation was enriched in CGIs whereas hypomethylation was increased with increasing distance to CGIs (Fig. 1D; Fig. S2). However, the average level of changes in DNA methylation shows no difference among different CpG regions. A total of 87.6% of DMC in CGI showed hypermethylation, which represents a significant enrichment. Contrarily, DMC in non-CGI regions, including shores, shelves and open sea, were enriched for hypomethylation. Validation of the methylation results from the 450K array on individual gene level was performed by pyrosequencing (Fig. S3), indicating reliable array results. Further biological validation is described below.
DNMT3A mutation is a main genetic contributer to the global methylation pattern
The mutational status of genes such as IDH and NPM1 has previously been associated to globally aberrant DNA methylation patterns in AML.22 Mutations in the DNMT3A gene occur frequently in AML. Such mutations have been shown to interrupt the catalytic activity of DNMT3A in mouse embryonic stem cells in a dominant negative fashion.23,24 However, so far, the effects of DNMT3A mutations have not been shown to translate into globally aberrant DNA methylation patterns in AML in a consistent manner. In order to characterize the relation between any gene mutation and potential corresponding DNA methylation patterns, we selected the most variably methylated (MVM) CpG sites among 62 CN-AML patients by overall standard deviation of β-values > 0.15. A total of 41723 CpG sites (11.6%) were defined as MVM sites. Of these, 35.8% were located in CGIs, 32.3% in shores, 6.5% in shelves and 25.5% in open sea. Average methylation levels in the CN-AML cohort with different mutations were compared with their wild type counterpart. Samples with DNMT3A mutations showed pronounced decrease in average methylation of MVM sites (Wilcoxon Rank Sum, P < 10−3, Fig. 2A). Unsupervised consensus cluster by ward method with over 100 resampling was applied to MVM sites in order to define patient clusters. Patients were segregated into 2 to 6 clusters (K2 to K6) (Fig. 2B; Fig. S4). The most prominent association with methylation patterns was found for DNMT3A mutations, followed by NPM1 mutations. At level K2, the two clusters were mainly characterized by methylation-dependent distribution of patients with DNMT3A mutations, whereas at the K4 level, NPM1-mutated patients were further added as being significantly clustered according to methylation patterns. A further sub-clustering of the patients into six groups (K6), revealed a stable methylation pattern for DNMT3A mutated samples in two clusters inherited from the K4 level. The remaining 4 clusters showed a more instable pattern with a variable distribution of IDH and FLT3 mutations. Our results suggest a scenario where DNMT3A status is the genetic event that primarily defines the DNA methylation pattern in CN-AML patients, and where NPM1 adds impact in both DNMT3A mutated and wild type patients. The impact of other gene mutations, such as IDH and FLT3 mutations, on DNA methylation patterns is mainly seen in CN-AML patients without DNMT3A mutation. Our previous studies have shown, using an Illumina methylation array with lesser coverage, DNA methylation patterns that correlate with clinical outcome. Therefore, we also performed a survival analysis based on the K2 clustering. This analysis revealed a significantly enhanced survival for patients in Group 1 compared with Group 2 (Average methylation Wilcoxon Sum Rank P < 10−3, survival difference log-rank test P = 0.0286, Fig. 2C). The two groups differ mainly in that Group 1 has higher methylation levels than Group 2, which is consistent with our previous findings that show that higher DNA methylation levels are associated to better survival.13 As DNMT3A mutations were the only gene mutations that were unevenly distributed between Groups 1 and 2, we performed a separate survival analysis based on DNMT3A mutations. This showed no statistically significant prognostic impact of DNMT3A mutations (data not shown), suggesting that the difference in survival between Group 1 and 2 was not due to unequal distribution of DNMT3A mutations.

Figure 2. Association profile between global methylation patterns and mutational status of CN-AML cases. In total, the 41723 most variably methylated CpG (MVM) sites were selected by choosing sites with a standard deviation of β-values higher than 0.15 across all 62 patient samples. (A) Smoothed scatter plots and boxplots of general methylation levels according to gene mutational status (mutated vs. wild type) on MVM sites. CN-AML patients were divided according to each gene mutational status and average methylation levels of mutated vs. wild type cases were plotted in parallel to scatterplot and boxplots (DNMT3A mutated vs. wild type, Wilcoxon Sum rank P < 10−3) (B) Unsupervised consensus cluster plot showing the correlation of global methylation patterns of 62 CN-AML patients. Patients were sequentially segregated into 2 to 6 clusters (K2 to K6) according to the correlation of methylation patterns (Fig. S4). K2, K4 and K6 clusters are shown in the plot with a color code. The mutational statuses of the corresponding patients are marked (mutated cases in black, not known in gray). Statistical analysis was performed validating the distribution of indicated gene mutations among patient groups in K2 to K6 clusters by Fisher’s exact test. (C) Average methylation levels of patients according to K2 cluster are shown in the left panel (Wilcoxon sum rank test, P < 10−4) and a Kaplan-Meier diagram shows the prognostic difference of patients divided according to K2 cluster (log-rank test, P = 0.0296)
DNMT3A mutations are associated with global hypomethylation that preferentially targets homeobox genes
As the cluster dominated by patients with DNMT3A mutations showed globally decreased methylation, we undertook a two-group comparison between DNMT3A mutated and wild type patients using the same definition of DMC (DNMT3A-DMC) as above. This analysis revealed hypomethylation in DNMT3A mutated samples, where 5073 out of 5074 DNMT3A-DMC were hypomethylated whereas only 1 site was hypermethylated (Fig. 3A). There was no evidence that methylation changes were due to differences in bone marrow blast counts (P = 0.3929, data not shown). More than half (56.1%) of hypomethylated CpGs were found in CGIs, 28.6% in shores and only 15.3% in distant regions, including shelves and open sea regions (Fig. 3B). In order to define what genes were affected by the differential methylation between DNMT3A mutated vs. wild type, differentially methylated genes were analyzed according to their protein family classification. Among a total of 1936 genes annotated to the DNMT3A-DMC, the only protein family that showed statistically significant differential methylation was the HOX gene family (FDR > 10−11), including genes such as, HOXA5, HOXA9 and PAX. (Fig. 3C; Table 2; Table S1). A GO analysis further defined the genes to be involved in multiple developmental processes and morphogenesis (data not shown). The enrichment of differential methylation of the HOX gene family is highly interesting as HOX genes are crucial during embryogenesis and hematopoietic development as well as implicated in leukemogenesis (reviewed by Morgan25).

Figure 3. Hypomethylation in DNMT3A mutated patients. Patients were separated according to DNMT3A mutational status and, in total, 5074 DNM3A-DMC were defined by FDR < 0.05 and |∆β| > 0.17. (A) Volcano plot shows methylation differences of DMC between DNMT3A mutated vs. wild type CN-AML cases (DNMT3A-DMC; FDR < 0.05, |∆β| > 0.17). DMCs are marked with red circles. X-axis shows the FDR odd ratios (-log10 FDR) and Y-axis shows the average difference between mutated and wild type cells. (B) Heatmap of DNMT3A-DMC. The mutational status is color-coded in the column index, mutated is shown in red and wild type is shown in blue. The CpG regions of DNMT3A-DMC are presented in rows (CGI in red, shores in yellow, shelves in green and open sea in blue). (C) Hypomethylation of HOXA5 and PAX7 in DNMT3A mutated CN-AML. DNMT3A-DMC of HOXA5 and PAX7 are shown in the diagram. Methylation levels are plotted according to chromosomal positions (β-value, scale 0 to 1.0). Patients are color-coded according to DNMT3A mutational status (mutated in red and wild type in blue). Schematic graphs and annotated CpG islands (CGIs in light blue) were obtained from USCS Genome browser.
Table 2. Family Classification of Hypomethylated Genes in DNMT3A mutated CN-AML.
| PANTHER TERM PROTEIN FAMILY | Count | P value | FDR | Genes | |
|---|---|---|---|---|---|
| PTHR19418 | HOMEOBOX PROTEIN | 26 | 7.90E-15 | 1.00E-11 | EVX1, EVX2, HOXD12, PAX6, HOXA5, PAX7, HOXC4, HOXA6, PAX8, GBX2, ALX4, TLX3, ALX3, DBX1, PITX1, PHOX2A, NKX2–6, EN1,VAX2,VAX1, VSX2, MIXL1, HOXD9, MSX1, DLX4, LBX2 |
| PTHR18973 | LIM DOMAIN CONTAINING PROTEIN | 6 | 1.10E-02 | 1.30E+01 | LMX1B, CRIP3, LPP, LHX1, PDLIM4, LMX1A |
| PTHR16675 | MHC CLASS I-RELATED | 4 | 2.10E-02 | 2.40E+01 | HLA-H,HLA-J, HLA-E, HLA-F |
| PTHR11336 | PHEROMONE AND ODORANT RECEPTOR | 3 | 4.60E-02 | 4.60E+01 | CASR, GRM2, GRM1 |
In order to validate the robustness of our findings, we repeated the analyses using 50 CN-AML cases analyzed by the 450K array within The Cancer Genome Atlas project (TCGA) (Table S2).26 Hierarchical clustering of MVM sites and two group comparisons based on mutational status of DNMT3A were performed according to the same statistic analysis used in our primary study cohort. The analyses confirmed the prominent finding of global hypomethylation in AML with mutant DNMT3A (Fig. S5). As TET2 mutations were not analyzed in the first cohort and could potentially interfere with our observations, we used TCGA data to examine the effects of TET2 mutations. We found 703 DMC between wild type and mutated TET2 cases, but no clear difference between hypermethylation and hypomethylation (data not shown).
AML specific aberrant methylation targets transcription factors
TFs play a crucial role during normal myeloid differentiation and mutations in TFs that are important for normal hematopoietic development are common events in AML.8,27 We hypothesized that differentially methylated TFs in CN-AML could potentially play a role in AML pathogenesis. Methylation changes in 1620 TFs were analyzed and an enrichment analysis by Fisher’s exact test was performed. Twenty-seven percent of the TFs (439) showed differential DNA methylation on at least one annotated CpG residue. To exclude random methylation changes in single CpG residues, TFs with significant methylation changes were defined by containing at least 3 DMCs combined with enrichment of DMC by Fisher’s exact test at FDR < 0. By this definition, 67 (4.11%) TFs were found to show significantly enriched differential methylation, which was twice as high as the methylation level found globally (P < 10−5, Fig. 4A; Table S3). TFs known to be involved in normal and malignant hematopoiesis, such as WT1, PRDM family, SOX1, RUNX3 and RUNX1, were identified among the most differentially methylated TFs (Table 3; Fig. S6). WT1 was by far the most aberrantly methylated TF. Methylation changes of WT1 were concentrated in the intragenic CGI regions, whereas no differential methylation was found in the main promoter region. The results were validated and confirmed by pyrosequencing, showing that CGIs located between the first intron and the second exon displayed significantly increased methylation (Student t test, P < 0.0001, Fig. 4B).
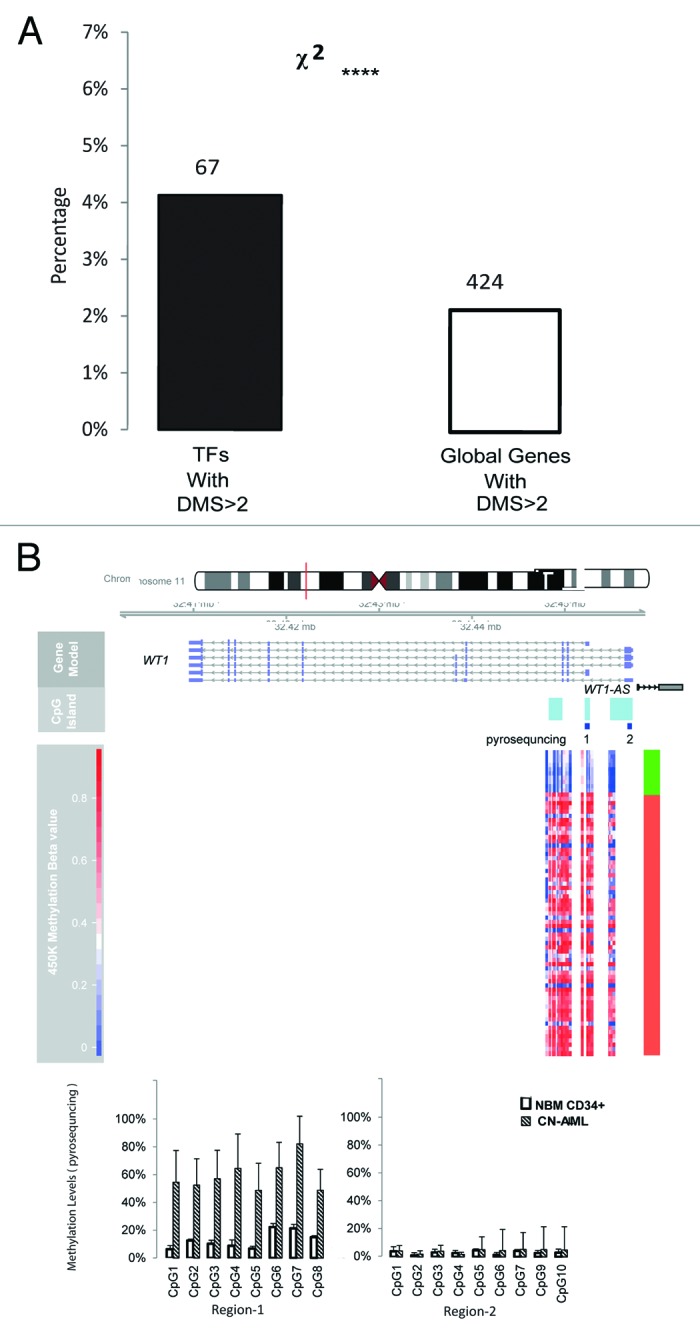
Figure 4. DMCs are enriched in transcription factor genes. The group of 1620 TF was compared with the total number of analyzed genes. The proportion of DMCs for each gene was tested by Fisher’s exact test vs. the proportion of total number of genes with annotated DMC. An FDR lower than 0.01 combined with a minimum of 3 DMCs per gene was used to eliminate genes with possible random methylation change. (A) Number of TF genes enriched for DMC compared with all genes with DMC (χ2, P < 10−4). (B) Differential methylation of WT1 validated by pyrosequencing. DMCs in WT1 are shown in a heatmap for the corresponding genomic locations. Genomic features are presented using the same annotation as in Figure 3C. Green indicates normal control samples and red CN-AML samples. Pyrosequencing targets are marked with dark blue blocks. Region 1 represents the intragenic region and Region 2 is in the core promoter region of WT1.
Table 3. Top 20 Differential Methylation Enriched Transcription Factors.
| Gene Symbol | DMC (n) |
Annotated CpG (N) |
Promoter Methylation Change | CpG regions (Promoter) | Gene Body Methylation Change | Enrichment Analysis (FDR) |
|---|---|---|---|---|---|---|
| WT1 | 24 | 46 | + | 2.27E-25 | ||
| ZNF454 | 9 | 13 | + | CGI | 1.00E-11 | |
| ZIC4 | 15 | 50 | + | Non-CGI | 2.04E-11 | |
| ZNF300 | 7 | 8 | + | CGI | 5.47E-11 | |
| SIM1 | 13 | 49 | + | CGI | + | 3.32E-09 |
| ZIC1 | 10 | 27 | + | CGI | + | 6.03E-09 |
| ZFP2 | 7 | 11 | + | CGI | 6.03E-09 | |
| ZNF876P | 6 | 10 | + | Non-CGI | + | 1.56E-07 |
| OTX2 | 8 | 23 | + | CGI | 4.70E-07 | |
| FOXG1 | 7 | 20 | + | CGI | 2.72E-06 | |
| PRDM8 | 9 | 37 | + | CGI | 3.22E-06 | |
| ZFP42 | 6 | 15 | + | CGI | 5.44E-06 | |
| ZBTB12 | 11 | 61 | - | Non-CGI | - | 5.69E-06 |
| SOX1 | 7 | 22 | + | CGI | 5.86E-06 | |
| ZNF19 | 5 | 10 | - | Non-CGI | 7.29E-06 | |
| PRDM16 | 37 | 566 | GCI /Non-CGI | +/− | 1.19E-05 | |
| ZNF577 | 5 | 11 | + | CGI | + | 1.42E-05 |
| ZSCAN1 | 7 | 26 | + | CGI | 2.11E-05 | |
| MEF2D | 7 | 27 | - | Non-CGI | 2.68E-05 | |
| TLX3 | 6 | 19 | + | CGI | 2.81E-05 |
TFs has been selected based on DMC > = 3 per gene with enrichment analysis FDR < 0.01; + Hypermethylated; - Hypomethylated
Correlation between methylation changes and gene expression
We then aimed to address the relation between DNA methylation and gene expression. For this, results from global gene expression profiling (GEP) on Affymetrix platform on 29 CN-AML samples were compared with the 450K data on both average level and single sample level. A total 236 930 CpG residues in 16033 genes were represented on both platforms. The average methylation level of CpG regions in promoters (upstream TSS1500 to 1st exon) and gene bodies was correlated with GEP results. After analyzing all CpGs and their annotated genes, we found a statistically significant inverse correlation between methylation in promoter regions associated to CGI, shores and open sea to gene expression, and a tendency to an inverse correlation in shores (Fig. 5A; Fig. S7). Average methylation in CGIs in promoter regions showed the strongest inverse correlation (rho = -0.3451 correlation coefficient on average methylation to gene expression, P < 0.0001) whereas, methylation of intragenic regions showed a more diverse pattern with an inverse correlation of CGI and shores but a modest positive correlation in shelves and open sea. Moreover, samples without DNMT3A mutation showed a stronger inverse correlation to gene expression at promoter CGI and nearby shores but not at distal regions (shelves and open sea).

Figure 5. Correlation between DNA methylation and gene expression. (A) Correlation between average DNA methylation and average gene expression of all genes represented on both methylation and expression arrays. Promoter and gene body methylation was summarized for each type of CpG region (in relation to CGI). Correlation coefficient was tested by Spearman’s correlation test. (B) Association between differentially methylated and differentially expressed genes within the CGI and open sea-associated promoters, respectively. All genes with significant differential methylation were plotted in the figure. In the left panel, the X-axis shows methylation difference in average β-value (∆β-value) between CN-AML and CD34+ controls; Y-axis shows changes in expression as log 2-transformed fold change. Differentially expressed genes are marked in red circles. Proportional Venn diagrams (right panel) show the differential expression corresponding to methylation changes in different CpG regions (tested by Fisher’s exact test).
Previous studies have suggested that the most dynamic changes in gene expression occur in genes regulated by non-CGI promoters during normal cell differentiation.28 In order to address this question for differentially methylated genes in CN-AML, we studied the overlap between differentially methylated and differentially expressed genes in relation to the CpG content of promoters (Fig. 5B). In a total of 2093 genes that were differentially methylated in promoter regions, 304 genes were found to be differentially expressed according to criteria described in methods (220 upregulated and 84 downregulated, Table S4). Interestingly, a modest statistically significant association between differential DNA methylation and gene expression changes was found in promoter regions with intermediate CpG densities for both up and downregulated genes (Fisher’s exact test, P = 0.026 of upregulated genes, P = 0.019 of downregulated genes). However, the most prominent association between differentially expressed genes and genes with altered methylation were found in low content CG promoter regions defined as within open sea. Differential methylation dominated by hypomethylation in these regions was significantly associated to upregulation of the corresponding genes (Fisher’s exact test, P < 10−4).
Discussion
Hypermethylation of CGI promoter regions in genes has been extensively reported in AML.10,11,29,30 However, the human genome contains approximately 28 million CpG dinucleotides31 and only 2% of them are associated to promoter regions with high CpG content. The biological role of vast non-CGI methylation and methylation outside of promoters remains unclear. Illumina® HumanMethylation 450K arrays constitutes a new tool to study the global methylation covering both CGIs as well as shores, shelves and open sea.21 In our study, methylome profiles of CN-AML patients were analyzed and correlated with the gene mutational status and gene expression profiles, as well as compared with normal CD34+ bone marrow cells. The study revealed loss of the normal DNA methylation homeostasis in differentially methylated genes in CN-AML. An increase in methylation in CGI was observed, although this type of differential methylation was underrepresented when compared with other genomic regions. Instead, enrichment of differential methylation was found in genomic regions far from CGIs, such as in open sea, displaying mainly hypomethylation. With increasing number of genome-wide methylation studies in cancer, this type of hypomethylation of large genomic areas seems to be a general feature of malignant cells, first reported in colon cancer.32 Among other hematologic malignancies, methylation alterations in CLL were mainly found in non-CGI regions.33 In addition, enrichment of DMC in non-CGI regions was recently reported during neutrophil34 and B-cell differentiation.35 However, the changes in DNA methylation of non-CGI regions are very subtle during normal hematopoiesis compared with the aberrant pattern in AML.
Some recurrent mutations in AML have previously been shown to correlate with DNA methylation patterns, such as is the case with NPM1 and IDH mutations.9,13,36 Surprisingly, it has been more difficult to associate mutations in DNMT3A to a specific methylation pattern.18 DNMT3A is one of the crucial methyltransferases responsible for de novo methylation. Knocking out DNMT3A in ex vivo models results in impairment of cell-renewal capacity in HSC as well as impaired cell differentiation.16,17 Moreover, substantial CGI hypermethylation has been reported in DNMT3A-null HSC in animal models.17 In AML, DNMT3A mutations have been associated to hypomethylation in small set of genes20 and a dominant negative effect of DNMT3A mutation has been recently reported in murine ES cells24 By unsupervised clustering of the MVM CpG sites across all CN-AML samples, consensus clustering showed segregation of patient samples, based primarily on DNMT3A mutational status followed by the presence of NPM1 mutations. In contrast to previous studies, including our own, mutations in the IDH genes were not found to be associated with any specific DNA methylation pattern in this study. This difference is probably due to a different coverage of the CpGs as well as other technical differences between the current and the previous studies, performed by other techniques or other platforms.13,37 The fact that our current results could be reproduced and confirmed in a completely independent cohort of CN-AML patients strengthens the reliability of the findings. Furthermore, mutations in DNMT3A was recently reported to cause impaired catalytic activity, which theoretically could lead to decreased global methylation levels.23 By further pairwise comparison between DNMT3A mutated and wild type cases, the hypomethylated phenotype of DNMT3A mutations became even more evident. In this two-group comparison, decreased methylation was found mainly in CGIs, and also, but to a lesser degree, in non-CGI regions. Among genes hypomethylated in DNMT3A mutated vs. wild type, the HOX gene family was the only protein family that showed significant hypomethylation. HOX genes are crucial genes involved in embryogenesis and hematopoietic development (reviewed by Morgan25). Overexpression of HOX genes, such as HOXA5 and HOXC4, leads to proliferation of hematopoietic progenitors and affects myeloid commitment.38,39 Interestingly, Jeong et al. recently report that HOX genes are differentially expressed between DNMT3A wild type vs. mutant AML.40 The obvious targeting of the HOX family for hypomethylation in DNMT3A mutated CN-AML suggests a pathogenic relevance that needs further investigation.
As TFs play an important role during myeloid differentiation and for AML development, we studied DNA methylation of known TFs and found a significant enrichment of differential DNA methylation in TFs. Thus, these methylation changes in TF genes may represent another level of interference. On the top list of differentially methylated TFs were genes such as RUNX1, WT1, RUNX3, PITX2, and TAL1. Interestingly, WT1 was by far the most differentially methylated of all TFs. The differential hypermethylation in WT1 was found only in the gene body and not in the promoter. Hypermethylation of WT1 has been reported in leukemic cell lines41 and it could potentially regulate not only WT1 transcripts but also antisense WT1 (WT1-AS).42 Previous studies suggested a CTCF binding region called WT1-ARR within the first intron. Hypermethylation of this insulator-binding region in AML could result in the upregulation of neighborhood genes, e.g., WT1 and WT1-AS.43
The inverse correlation between promoter CGI methylation and silencing of gene expression is well documented. More recently, DNA methylation changes in regions adjacent to CGIs—CGI shores—were correlated with gene expression in colon cancer.14 In order to address the relation between DNA methylation and gene expression, we first correlated methylation of all CpGs annotated to a gene on the array to the expression of that gene by global gene expression profiling. This analysis confirmed an inverse correlation between promoter methylation and gene expression. This correlation was statistically significant to all types of promoters, regardless of CpG content, although promoters with CGI showed the clearest inverse correlation. Gene body methylation displayed a slightly different correlation pattern with CGIs and CGI shores showing inverse correlation, and CGI shelves and open sea showing a positive correlation. The biological relevance of gene body methylation remains unclear; however, a positive correlation between methylation and gene expression have previously been reported.44 Even though the function of intragenic CGI is unclear, a potential role in the regulation of alternative TSS and isoform expression has been suggested. Moreover, we found an inverse correlation in DNMT3A wild type cases in promoter CGI and shores, but not in more distal regions. Mutations of DNMT3A impairs tetramer formation and the methylating activity of its substrates.23 This impairment may have more impact on high CpG density regions compared with CpG sparse regions. This result is consistent with our finding that DNA hypomethylation dominated by mutation in DNMT3A is profound in CGI. We furthermore analyzed the association between gene expression changes in CN-AML vs. normal bone marrow CD34+ with methylation changes in promoter regions. Interestingly, upregulated genes in CN-AML are more commonly seen in genes without CGI in promoter regions. For the genes downregulated in AML, a significant association was found in promoters distant from CGI regions (shores and shelves). Previous studies have suggested a stronger correlation of DNA methylation in shores to gene expression changes in colorectal cancer.14,36 Moreover, recently published data has showed that, during normal B cell differentiation, the strongest correlation between gene expression and DNA methylation was found in a group of genes with promoters without CGIs.35 The role of promoter classes according to CpG content still remains unclear. Our results, together with previous data, appear to suggest a distinctive regulation for genes with CGI promoters compared with low CpG density promoters.
In conclusion, using genome-wide DNA methylation analysis, we show that global methylation changes in CN-AML are dominated by hypomethylation of non-CGI regions with methylation alternation enrichment in TFs. Furthermore, we show DNMT3A mutations confer a globally hypomethylated phenotype targeting specifically the HOX gene family (differing from wild type cases that show DNA methylation changes mainly in CGIs).
Materials and Methods
Leukemic samples and normal controls
Bone marrow from 62 CN-AML patients and 10 healthy volunteers was obtained at diagnosis after informed consents and in accordance to the declaration of Helsinki. Patients from Karolinska University Hospital, Huddinge, Uppsala University Hospital, Örebro University Hospital and Ulm University Hospital were enrolled in the study. All patients were treated by standard intensive induction treatment according to national treatment protocols. Mononuclear cells were isolated by LymphoprepTM (AXIS-SHIELD PoC, Norway). The mutational status for DNMT3A, NPM1, IDH1 and IDH2, FLT3-ITD and FLT3-TKD was analyzed as previously described.4,45,46 DNA and RNA were extracted from separate patients’ mononuclear cells for further analyses, as described below. For normal bone marrow samples, mononuclear cells were first isolated by LymphoprepTM and CD34+ cells were then isolated using CD34 Microbead Kit (MACS®, Germany), according to the manufacturer’s instructions.
Infinium Methylation Assay and Data Processing
DNA and RNA were extracted by TRIzol® (Invitrogen) or AllPrep (QIAGEN) following manufacturer’s recommendations. Genome-wide methylation assays were performed by Illumina® Human Methylation 450K BeadChip array (Illumina®). The quality of DNA samples was tested by Genomic DNA ScreenTape® and no degradation was found. For each sample, 500 ng genomic DNA was bisulfite treated using EZ DNA Methylation Kit (Zymo research) and analysis was performed in accordance to Illumina’s instructions. GenomeStudio® (Illumina®) was used as data processing software. The β value (β-value) was used as readout. The β-value ranges from 0 to 1, where 0 represents a non-methylated CpG site and 1 a fully methylated CpG site. In order to eliminate potential technical biases, probes with detection p-value higher than 0.01 in any of the tested samples were excluded from further analysis. To exclude bias of gender specific methylation, CpG sites in sex chromosomes were only used for array quality control. A total of 337721 CpG probes were selected for the further analysis. Differentially methylated CpG sites (DMC) were defined through pairwise comparisons between CN-AML patients (n = 62) and CD34+ controls (n = 10), using Moderated Student t test, selecting sites with Benjamini and Hochberg adjusted P values lower than 0.05 (FDR < 0.05) and with an absolute difference in average β-value higher than 0.17 (|∆β| > 0.17) on all autosome-aligned CpG residues. Principal component analysis (PCA) and histograms of CN-AML and NBM CD34+ were performed on those DMC. The distribution of DMC in different CpG regions (CGI, shores, shelves, and open sea) vs. the general proportion of CpGs on the array and the enrichment of hyper- and hypo-methylated DMC in different CpG regions were tested against the proportion of total DMC using Chi-square test. A list of TFs was obtained from the Fantom Project47 and genes containing DMC were compared, using Fisher’s exact test, against global genes. Genes were considered to have significant methylation changes when containing 3 of more DMCs (FDR of Fisher’s exact test < 0.01). We compared the proportion of DMCs in TF genes to that of any gene showing DMCs.
To study the correlation between mutational status and global DNA methylation patterns, the most variably methylated CpG sites (MVM) were selected (standard deviation of a β-value [SD β-value] > 0.15) across all 62 patient samples. Average methylation levels between the different mutational groups were tested against their wild type counterpart by Wilcoxon sum rank test. Unsupervised Consensus Cluster was performed on the MVM sites with Euclidean distance and average linkage over 100 resampling by the ward method. Statistical analysis was performed on the distributions of the indicated gene mutations among any sample clusters by Fisher’s exact test. Wilcoxon sum rank test was selected to test the methylation difference between two patient groups (Group-1 vs. Group-2) at K2 level. Survival data of these two groups were tested using log-rank test and presented with Kaplan-Meier curve.
CN-AML samples were separated by DNMT3A mutational status. DMCs of the DNMT3A mutated group vs. the wild type group (DNMT3A-DMC) were defined by using the same cutoff as previous DMC (FDR < 0.05 and |∆β| > 0.17). Genes were classified as significantly hypomethylated if showing more than 3 DMC. Functional classification and GO analysis were tested on this group of genes. (http://david.abcc.ncifcrf.gov/).
The validation CN-AML sample cohort was obtained by data mining from the recent publication by the Cancer Genome Atlas Research Network (https://tcga-data.nci.nih.gov/docs/publications/laml_2012/). Patients’ cytogenetic classification was obtained from the displayed clinical characteristics of patients. Mutational statuses of patients were obtained by combining clinical information with exon sequencing results. The analysis included all patients with comprehensively described cytogenetic and genetic features (a total of 50 CN-AML patients). The Level-3 Illumina methylation arrays’ data for these 50 patients were downloaded and used for further analysis. In order to validate the global hypomethylation found in DNMT3A mutated patients, the DMCs defined according to DNMT3A status were defined according to the same cutoff as in the primary cohort. The statistical analysis of genes with hypomethylated DMC was performed as in the test cohort. The genome-wide methylation array data in this paper is published on NCBI Gene Expression Omnibus (GEO series number xxxxxx, http://www.ncbi.nlm.nih.gov/geo).
Gene Expression Analyses
Gene expression analyses were performed on RNA from 29 of the total AML patient samples analyzed by the methylation array. These were performed at Ulm University by GeneChip® Human Genome U133 Plus 2.0 Array (Affymetrix®, USA), according to manufacturer’s instruction. Gene expression profiles of normal bone marrow CD34+ cells from 16 healthy individuals were obtained through data mining of GEO data series GSE19429. Experiential raw CEL files were downloaded and processed together, using a robust multichip average (RMA) algorithm by Rstudio software (http://www.rstudio.com/), with custom CDF file. Differentially expressed genes in CN-AML vs. normal CD34+ samples were filtered by FDR lower than 0.01 of moderate Student t test with 100 times permutation and FC > 1.5. Correlating gene expression to methylation patterns, EntrezID were used to annotate genes. Correlations between gene expression and average methylation levels were tested by Spearman’s rank correlation coefficient. Statistically significant overlaps between differentially methylated proximal promoters on different CpG groups with expression changes of annotated genes were tested by Fisher’s exact test.
Pyrosequencing
A total of 500 ng genomic DNA from each sample were bisulfite treated as described above and analyzed by pyrosequencing on a PyroMark Q24 Pyrosequencer (Qiagen, Sollentuna, Sweden) for the CDKN2B and WT1 genes, according to manufacturer’s instructions. PCR primer sets and sequencing primers were designed using PyroMARK Design software (Table S5).
Statistical analyses
Statistical analyses on methylation and gene expression data were performed as described above. Student’s T-test was used for statistical analysis of pyrosequencing results. All p-values are two-sided. All statistical analysis were performed in Rstudio software using limma, stats, RMA, sva,48 gplots, FactorMineR and ConsensusClusterPlus,49 Gviz packages (http://www.r-project.org/). Family classification and GO analysis were tested by David Bioinformatics Tools v6.7 (http://david.abcc.ncifcrf.gov/).
Supplementary Material
Disclosure of Potential Conflicts of Interest
No potential conflicts of interest were disclosed.
Acknowledgments
The authors thank Bertil Uggla and Ulf Tidefelt for providing CN-AML patient materials, David Brodin and Fredrik Fagerstrom-Billai for performing the Illumina 450K array and David Gomez-Cabrero for bioinformatics help. This work was supported by the Swedish Cancer Foundation, the Swedish Research Council, the Stockholm County Council and the Wallenberg Foundation. Lars Bullinger was supported by the Deutsche Forschungsgemeinschaft (Heisenberg-Stipendium BU 1339/3-1).
Authorship
Contributions: Y.Q., A.L. and S.L., designed the study; Y.Q., A.L., V.I.G., S.D., M.K., and S.B., performed the research; V.I.G., S.D., M.H. and L.B., collected materials and clinical data from AML patients; Y.Q., A.L., S.D., analyzed the data; V.I.G., L.B., K.D., performed mutational characterization of patients and provided microarray expression data; Y.Q., A.L. and S.L interpreted the data; and Y.Q. and S.L. wrote the manuscript with contributions from all co-authors.
Glossary
- List of Abbreviations: CGI
CpG islands
- CN-AML
Cytogenetically normal acute myeloid leukemia
- TF
Transcription factor
- WT1
Wilm's tumor 1
- CEBPA
CCAAT/enhancer binding protein, alpha
- FLT3
Fms-related tyrosine kinase 3
- NPM1
Nucleophosmin 1
- TET2
Tet methylcytosine dioxygenase 2
- MLL
Mixed lineage leukemia
- IDH 1 and 2
Isocitrate dehydrogenase 1 and 2
- ASXL1
Additional sex combs like 1
- DNMT3A and 3B
DNA methyltransferase 3A and 3B
- HSC
Hematopoietic stem cell
- RUNX1 and 3
Runt-related transcription factor 1 and 3
- DMC
Differential methylated CpG sites
- MVM
Most variably methylated CpG sites
- HOX
Homeobox gene
- PAX
Paired box gene
References
- 1.Vardiman JW, Thiele J, Arber DA, Brunning RD, Borowitz MJ, Porwit A, Harris NL, Le Beau MM, Hellström-Lindberg E, Tefferi A, et al. The 2008 revision of the World Health Organization (WHO) classification of myeloid neoplasms and acute leukemia: rationale and important changes. Blood. 2009;114:937–51. doi: 10.1182/blood-2009-03-209262. [DOI] [PubMed] [Google Scholar]
- 2.Preudhomme C, Sagot C, Boissel N, Cayuela JM, Tigaud I, de Botton S, Thomas X, Raffoux E, Lamandin C, Castaigne S, et al. ALFA Group Favorable prognostic significance of CEBPA mutations in patients with de novo acute myeloid leukemia: a study from the Acute Leukemia French Association (ALFA) Blood. 2002;100:2717–23. doi: 10.1182/blood-2002-03-0990. [DOI] [PubMed] [Google Scholar]
- 3.Schnittger S, Schoch C, Kern W, Mecucci C, Tschulik C, Martelli MF, Haferlach T, Hiddemann W, Falini B. Nucleophosmin gene mutations are predictors of favorable prognosis in acute myelogenous leukemia with a normal karyotype. Blood. 2005;106:3733–9. doi: 10.1182/blood-2005-06-2248. [DOI] [PubMed] [Google Scholar]
- 4.Schlenk RF, Döhner K, Krauter J, Fröhling S, Corbacioglu A, Bullinger L, Habdank M, Späth D, Morgan M, Benner A, et al. German-Austrian Acute Myeloid Leukemia Study Group Mutations and treatment outcome in cytogenetically normal acute myeloid leukemia. N Engl J Med. 2008;358:1909–18. doi: 10.1056/NEJMoa074306. [DOI] [PubMed] [Google Scholar]
- 5.Chou WC, Huang HH, Hou HA, Chen CY, Tang JL, Yao M, Tsay W, Ko BS, Wu SJ, Huang SY, et al. Distinct clinical and biological features of de novo acute myeloid leukemia with additional sex comb-like 1 (ASXL1) mutations. Blood. 2010;116:4086–94. doi: 10.1182/blood-2010-05-283291. [DOI] [PubMed] [Google Scholar]
- 6.Patel JPGM, Gönen M, Figueroa ME, Fernandez H, Sun Z, Racevskis J, Van Vlierberghe P, Dolgalev I, Thomas S, Aminova O, et al. Prognostic relevance of integrated genetic profiling in acute myeloid leukemia. N Engl J Med. 2012;366:1079–89. doi: 10.1056/NEJMoa1112304. [DOI] [PMC free article] [PubMed] [Google Scholar]
- 7.Bock C, Beerman I, Lien WH, Smith ZD, Gu H, Boyle P, Gnirke A, Fuchs E, Rossi DJ, Meissner A. DNA methylation dynamics during in vivo differentiation of blood and skin stem cells. Mol Cell. 2012;47:633–47. doi: 10.1016/j.molcel.2012.06.019. [DOI] [PMC free article] [PubMed] [Google Scholar]
- 8.Ji H, Ehrlich LI, Seita J, Murakami P, Doi A, Lindau P, Lee H, Aryee MJ, Irizarry RA, Kim K, et al. Comprehensive methylome map of lineage commitment from haematopoietic progenitors. Nature. 2010;467:338–42. doi: 10.1038/nature09367. [DOI] [PMC free article] [PubMed] [Google Scholar]
- 9.Figueroa ME, Lugthart S, Li Y, Erpelinck-Verschueren C, Deng X, Christos PJ, Schifano E, Booth J, van Putten W, Skrabanek L, et al. DNA methylation signatures identify biologically distinct subtypes in acute myeloid leukemia. Cancer Cell. 2010;17:13–27. doi: 10.1016/j.ccr.2009.11.020. [DOI] [PMC free article] [PubMed] [Google Scholar]
- 10.Deneberg S, Grövdal M, Karimi M, Jansson M, Nahi H, Corbacioglu A, Gaidzik V, Döhner K, Paul C, Ekström TJ, et al. Gene-specific and global methylation patterns predict outcome in patients with acute myeloid leukemia. Leukemia. 2010;24:932–41. doi: 10.1038/leu.2010.41. [DOI] [PubMed] [Google Scholar]
- 11.Yalcin A, Kreutz C, Pfeifer D, Abdelkarim M, Klaus G, Timmer J, Lübbert M, Hackanson B. MeDIP coupled with a promoter tiling array as a platform to investigate global DNA methylation patterns in AML cells. Leuk Res. 2013;37:102–11. doi: 10.1016/j.leukres.2012.09.014. [DOI] [PubMed] [Google Scholar]
- 12.Bullinger L, Ehrich M, Döhner K, Schlenk RF, Döhner H, Nelson MR, van den Boom D. Quantitative DNA methylation predicts survival in adult acute myeloid leukemia. Blood. 2010;115:636–42. doi: 10.1182/blood-2009-03-211003. [DOI] [PubMed] [Google Scholar]
- 13.Deneberg S, Guardiola P, Lennartsson A, Qu Y, Gaidzik V, Blanchet O, Karimi M, Bengtzén S, Nahi H, Uggla B, et al. Prognostic DNA methylation patterns in cytogenetically normal acute myeloid leukemia are predefined by stem cell chromatin marks. Blood. 2011;118:5573–82. doi: 10.1182/blood-2011-01-332353. [DOI] [PubMed] [Google Scholar]
- 14.Irizarry RA, Ladd-Acosta C, Wen B, Wu Z, Montano C, Onyango P, Cui H, Gabo K, Rongione M, Webster M, et al. The human colon cancer methylome shows similar hypo- and hypermethylation at conserved tissue-specific CpG island shores. Nat Genet. 2009;41:178–86. doi: 10.1038/ng.298. [DOI] [PMC free article] [PubMed] [Google Scholar]
- 15.Okano M, Bell DW, Haber DA, Li E. DNA methyltransferases Dnmt3a and Dnmt3b are essential for de novo methylation and mammalian development. Cell. 1999;99:247–57. doi: 10.1016/S0092-8674(00)81656-6. [DOI] [PubMed] [Google Scholar]
- 16.Tadokoro Y, Ema H, Okano M, Li E, Nakauchi H. De novo DNA methyltransferase is essential for self-renewal, but not for differentiation, in hematopoietic stem cells. J Exp Med. 2007;204:715–22. doi: 10.1084/jem.20060750. [DOI] [PMC free article] [PubMed] [Google Scholar]
- 17.Challen GA, Sun D, Jeong M, Luo M, Jelinek J, Berg JS, Bock C, Vasanthakumar A, Gu H, Xi Y, et al. Dnmt3a is essential for hematopoietic stem cell differentiation. Nat Genet. 2012;44:23–31. doi: 10.1038/ng.1009. [DOI] [PMC free article] [PubMed] [Google Scholar]
- 18.Ley TJ, Ding L, Walter MJ, McLellan MD, Lamprecht T, Larson DE, Kandoth C, Payton JE, Baty J, Welch J, et al. DNMT3A mutations in acute myeloid leukemia. N Engl J Med. 2010;363:2424–33. doi: 10.1056/NEJMoa1005143. [DOI] [PMC free article] [PubMed] [Google Scholar]
- 19.Yan XJ, Xu J, Gu ZH, Pan CM, Lu G, Shen Y, Shi JY, Zhu YM, Tang L, Zhang XW, et al. Exome sequencing identifies somatic mutations of DNA methyltransferase gene DNMT3A in acute monocytic leukemia. Nat Genet. 2011;43:309–15. doi: 10.1038/ng.788. [DOI] [PubMed] [Google Scholar]
- 20.Hájková H, Marková J, Haškovec C, Sárová I, Fuchs O, Kostečka A, Cetkovský P, Michalová K, Schwarz J. Decreased DNA methylation in acute myeloid leukemia patients with DNMT3A mutations and prognostic implications of DNA methylation. Leuk Res. 2012;36:1128–33. doi: 10.1016/j.leukres.2012.05.012. [DOI] [PubMed] [Google Scholar]
- 21.Dedeurwaerder S, Defrance M, Calonne E, Denis H, Sotiriou C, Fuks F. Evaluation of the infinium methylation 450k technology. Epigenomics. 2011;3:771–84. doi: 10.2217/epi.11.105. [DOI] [PubMed] [Google Scholar]
- 22.Lu C, Ward PS, Kapoor GS, Rohle D, Turcan S, Abdel-Wahab O, Edwards CR, Khanin R, Figueroa ME, Melnick A, et al. IDH mutation impairs histone demethylation and results in a block to cell differentiation. Nature. 2012;483:474–8. doi: 10.1038/nature10860. [DOI] [PMC free article] [PubMed] [Google Scholar]
- 23.Holz-Schietinger C, Matje DM, Reich NO. Mutations in DNA methyltransferase (DNMT3A) observed in acute myeloid leukemia patients disrupt processive methylation. J Biol Chem. 2012;287:30941–51. doi: 10.1074/jbc.M112.366625. [DOI] [PMC free article] [PubMed] [Google Scholar]
- 24.Kim SJ, Zhao H, Hardikar S, Singh AK, Goodell MA, Chen T. A DNMT3A mutation common in AML exhibits dominant-negative effects in murine ES cells. Blood. 2013;122:4086–9. doi: 10.1182/blood-2013-02-483487. [DOI] [PMC free article] [PubMed] [Google Scholar]
- 25.Alharbi RA, Pettengell R, Pandha HS, Morgan R. The role of HOX genes in normal hematopoiesis and acute leukemia. Leukemia. 2013;27:1000–8. doi: 10.1038/leu.2012.356. [DOI] [PubMed] [Google Scholar]
- 26.Network TCG A R, Cancer Genome Atlas Research Network Genomic and epigenomic landscapes of adult de novo acute myeloid leukemia. N Engl J Med. 2013;368:2059–74. doi: 10.1056/NEJMoa1301689. [DOI] [PMC free article] [PubMed] [Google Scholar]
- 27.Shen Y, Zhu YM, Fan X, Shi JY, Wang QR, Yan XJ, Gu ZH, Wang YY, Chen B, Jiang CL, et al. Gene mutation patterns and their prognostic impact in a cohort of 1185 patients with acute myeloid leukemia. Blood. 2011;118:5593–603. doi: 10.1182/blood-2011-03-343988. [DOI] [PubMed] [Google Scholar]
- 28.Carninci P, Sandelin A, Lenhard B, Katayama S, Shimokawa K, Ponjavic J, Semple CA, Taylor MS, Engström PG, Frith MC, et al. Genome-wide analysis of mammalian promoter architecture and evolution. Nat Genet. 2006;38:626–35. doi: 10.1038/ng1789. [DOI] [PubMed] [Google Scholar]
- 29.Aggerholm A, Holm MS, Guldberg P, Olesen LH, Hokland P. Promoter hypermethylation of p15INK4B, HIC1, CDH1, and ER is frequent in myelodysplastic syndrome and predicts poor prognosis in early-stage patients. Eur J Haematol. 2006;76:23–32. doi: 10.1111/j.1600-0609.2005.00559.x. [DOI] [PubMed] [Google Scholar]
- 30.Paul TA, Bies J, Small D, Wolff L. Signatures of polycomb repression and reduced H3K4 trimethylation are associated with p15INK4b DNA methylation in AML. Blood. 2010;115:3098–108. doi: 10.1182/blood-2009-07-233858. [DOI] [PMC free article] [PubMed] [Google Scholar]
- 31.Suzuki MM, Bird A. DNA methylation landscapes: provocative insights from epigenomics. Nat Rev Genet. 2008;9:465–76. doi: 10.1038/nrg2341. [DOI] [PubMed] [Google Scholar]
- 32.SE Goelz B V Hamilton SR, AP Feinberg, Hypomethylation of DNA from benign and malignant human colon neoplasms. Science. 1985;228:4. doi: 10.1126/science.2579435. [DOI] [PubMed] [Google Scholar]
- 33.Cahill N, Bergh AC, Kanduri M, Göransson-Kultima H, Mansouri L, Isaksson A, Ryan F, Smedby KE, Juliusson G, Sundström C, et al. 450K-array analysis of chronic lymphocytic leukemia cells reveals global DNA methylation to be relatively stable over time and similar in resting and proliferative compartments. Leukemia. 2013;27:150–8. doi: 10.1038/leu.2012.245. [DOI] [PubMed] [Google Scholar]
- 34.Rönnerblad M, Andersson R, Olofsson T, Douagi I, Karimi M, Lehmann S, Hoof I, de Hoon M, Itoh M, Nagao-Sato S, et al. FANTOM consortium Analysis of the DNA methylome and transcriptome in granulopoiesis reveals timed changes and dynamic enhancer methylation. Blood. 2014;123:e79–89. doi: 10.1182/blood-2013-02-482893. [DOI] [PubMed] [Google Scholar]
- 35.Lee ST, Xiao Y, Muench MO, Xiao J, Fomin ME, Wiencke JK, Zheng S, Dou X, de Smith A, Chokkalingam A, et al. A global DNA methylation and gene expression analysis of early human B-cell development reveals a demethylation signature and transcription factor network. Nucleic Acids Res. 2012;40:11339–51. doi: 10.1093/nar/gks957. [DOI] [PMC free article] [PubMed] [Google Scholar]
- 36.Akalin A, Garrett-Bakelman FE, Kormaksson M, Busuttil J, Zhang L, Khrebtukova I, Milne TA, Huang Y, Biswas D, Hess JL, et al. Base-pair resolution DNA methylation sequencing reveals profoundly divergent epigenetic landscapes in acute myeloid leukemia. PLoS Genet. 2012;8:e1002781. doi: 10.1371/journal.pgen.1002781. [DOI] [PMC free article] [PubMed] [Google Scholar]
- 37.Figueroa ME, Abdel-Wahab O, Lu C, Ward PS, Patel J, Shih A, Li Y, Bhagwat N, Vasanthakumar A, Fernandez HF, et al. Leukemic IDH1 and IDH2 mutations result in a hypermethylation phenotype, disrupt TET2 function, and impair hematopoietic differentiation. Cancer Cell. 2010;18:553–67. doi: 10.1016/j.ccr.2010.11.015. [DOI] [PMC free article] [PubMed] [Google Scholar]
- 38.John F, Fuller JM. Yifah Yaron, Mark Sakaguchi, John K. Fraser, and Judith C. Gasson, Characterization of hox gene expression during myelopoiesis: Role of hox a5 in lineage commitment and maturation. Blood. 1999;93:10. [PubMed] [Google Scholar]
- 39.Daga A, Podesta M, Capra MC, Piaggio G, Frassoni F, Corte G. The retroviral transduction of HOXC4 into human CD34(+) cells induces an in vitro expansion of clonogenic and early progenitors. Exp Hematol. 2000;28:569–74. doi: 10.1016/S0301-472X(00)00135-1. [DOI] [PubMed] [Google Scholar]
- 40.Jeong M, Sun D, Luo M, Huang Y, Challen GA, Rodriguez B, Zhang X, Chavez L, Wang H, Hannah R, et al. Large conserved domains of low DNA methylation maintained by Dnmt3a. Nat Genet. 2014;46:17–23. doi: 10.1038/ng.2836. [DOI] [PMC free article] [PubMed] [Google Scholar]
- 41.Vidovic K, Svensson E, Nilsson B, Thuresson B, Olofsson T, Lennartsson A, Gullberg U. Wilms’ tumor gene 1 protein represses the expression of the tumor suppressor interferon regulatory factor 8 in human hematopoietic progenitors and in leukemic cells. Leukemia. 2010;24:992–1000. doi: 10.1038/leu.2010.33. [DOI] [PubMed] [Google Scholar]
- 42.Kaneuchi M, Sasaki M, Tanaka Y, Shiina H, Yamada H, Yamamoto R, Sakuragi N, Enokida H, Verma M, Dahiya R. WT1 and WT1-AS genes are inactivated by promoter methylation in ovarian clear cell adenocarcinoma. Cancer. 2005;104:1924–30. doi: 10.1002/cncr.21397. [DOI] [PubMed] [Google Scholar]
- 43.Hancock AL, Brown KW, Moorwood K, Moon H, Holmgren C, Mardikar SH, Dallosso AR, Klenova E, Loukinov D, Ohlsson R, et al. A CTCF-binding silencer regulates the imprinted genes AWT1 and WT1-AS and exhibits sequential epigenetic defects during Wilms’ tumourigenesis. Hum Mol Genet. 2007;16:343–54. doi: 10.1093/hmg/ddl478. [DOI] [PubMed] [Google Scholar]
- 44.Maunakea AK, Nagarajan RP, Bilenky M, Ballinger TJ, D’Souza C, Fouse SD, Johnson BE, Hong C, Nielsen C, Zhao Y, et al. Conserved role of intragenic DNA methylation in regulating alternative promoters. Nature. 2010;466:253–7. doi: 10.1038/nature09165. [DOI] [PMC free article] [PubMed] [Google Scholar]
- 45.Paschka P, Schlenk RF, Gaidzik VI, Habdank M, Krönke J, Bullinger L, Späth D, Kayser S, Zucknick M, Götze K, et al. IDH1 and IDH2 mutations are frequent genetic alterations in acute myeloid leukemia and confer adverse prognosis in cytogenetically normal acute myeloid leukemia with NPM1 mutation without FLT3 internal tandem duplication. J Clin Oncol. 2010;28:3636–43. doi: 10.1200/JCO.2010.28.3762. [DOI] [PubMed] [Google Scholar]
- 46.Gaidzik VI, Schlenk RF, Paschka P, Stölzle A, Späth D, Kuendgen A, von Lilienfeld-Toal M, Brugger W, Derigs HG, Kremers S, et al. Clinical impact of DNMT3A mutations in younger adult patients with acute myeloid leukemia: results of the AML Study Group (AMLSG) Blood. 2013;121:4769–77. doi: 10.1182/blood-2012-10-461624. [DOI] [PubMed] [Google Scholar]
- 47.FANTOM Consortium and the RIKEN PMI and CLST (DGT) A promoter-level mammalian expression atlas. Nature. 2014;507:462–70. doi: 10.1038/nature13182. [DOI] [PMC free article] [PubMed] [Google Scholar]
- 48.Leek JT, Johnson WE, Parker HS, Jaffe AE, Storey JD. The sva package for removing batch effects and other unwanted variation in high-throughput experiments. Bioinformatics. 2012;28:882–3. doi: 10.1093/bioinformatics/bts034. [DOI] [PMC free article] [PubMed] [Google Scholar]
- 49.Wilkerson MD, Hayes DN. ConsensusClusterPlus: a class discovery tool with confidence assessments and item tracking. Bioinformatics. 2010;26:1572–3. doi: 10.1093/bioinformatics/btq170. [DOI] [PMC free article] [PubMed] [Google Scholar]
Associated Data
This section collects any data citations, data availability statements, or supplementary materials included in this article.