

Abstract
Compared to DBA/2J (D2), C57BL/6J (B6) inbred mice exhibit strong morphine preference when tested using a two-bottle choice drinking paradigm. A morphine preference quantitative trait locus (QTL), Mop2, was originally mapped to proximal chromosome 10 using a B6xD2 F2 intercross population, confirmed with reciprocal congenic strains and fine mapped with recombinant congenic strains. These efforts identified a ~10 Mbp interval, underlying Mop2, containing 35 genes. To further reduce the interval, mice from the D2.B6-Mop2-P1 congenic strain were backcrossed to parental D2 mice and two new recombinant strains of interest were generated: D2.B6-Mop2-P1.pD.dB and D2.B6-Mop2-P1.pD.dD. Results obtained from testing these strains in the two-bottle choice drinking paradigm suggest that the gene(s) responsible for the Mop2 QTL is one or more of 22 remaining within the newly defined interval (~7.6 Mbp) which includes Oprm1 and several other genes related to opioid pharmacology. Real-time qRTPCR analysis of Oprm1 and opioid-related genes Rgs17, Ppp1r14c, Vip, and Iyd revealed both between-strain and within-strain expression differences in comparisons of saline- and morphine-treated B6 and D2 mice. Analysis of Rgs17 protein levels also revealed both between-strain and within-strain differences in comparisons of saline- and morphine-treated B6 and D2 mice. Results suggest that the Mop2 QTL represents the combined influence of multiple genetic variants on morphine preference in these two strains. Relative contributions of each variant remain to be determined.
Keywords: μ-opioid receptor, two-bottle choice, Rgs17, Ppp1r14c, Iyd, Vip
1.1 Introduction
For over 30 years, the C57BL/6J (B6) and DBA/2J (D2) inbred mouse strains have been studied as a model system for substance abuse, exhibiting robust differences in responses observed following voluntary morphine intake (by liquid, food, or operant intravenous self administration), with B6 mice consistently showing increased preference and willingness to work for opioids (Belknap et al., 1993; Horowitz et al., 1977; Suzuki et al., 1991; Elmer et al., 2010). In addition, B6 and D2 mice exhibit differences in the development of tolerance (Frigeni et al., 1981) and dependence, (Belknap, 1990; Suzuki et al., 1991) withdrawal symptoms (Kest et al., 2002; Suzuki et al., 1991), analgesia (anti-nociception) (Belknap et al., 1995; Bergeson et al., 2001), Straub tail (Belknap, 1990), hypothermia (Muraki and Kato, 1987) and reward as determined by conditioned place preference (Cunningham et al., 1992; Orsini et al., 2005).
The dramatic contrast between B6 and D2 mice in morphine preference behavior was first studied using a two-bottle choice paradigm (Horowitz et al., 1977) and was confirmed in a subsequent study using a slightly modified testing protocol (Belknap et al., 1993). A genetic basis for these differential responses was documented in a quantitative trait loci (QTL) mapping study in which three QTL were detected that together explained over 85% of the observed genetic variance – two major QTL on chromosomes (Chr) 10 and 6, and a suggestive QTL on Chr 1 (Berrettini et al., 1994b). Our studies with double congenic mice (Doyle et al, 2008) indicated that the Chr 6 QTL (Berrettini et al, 1994b) could be explained by strain polymorphisms at the qui locus which maps to Chr 6 (Blizzard et al, 1999; Nelson et al, 2005) and produces taste aversion to quinine (used in the control bottle versus morphine) in B6 mice (Lush, 1984). Fine-mapping with congenic strains narrowed the Chr 10 QTL critical interval to ~4.5 cM containing 35 genes (Doyle et al., 2008; Ferraro et al., 2005) including Oprm1 which encodes the μ-opioid receptor (MOR), the main receptor for morphine in the central nervous system (Pan, 2005; Pasternak, 2001). The role of the MOR in mediating the effects of morphine, including analgesia, tolerance, dependence and withdrawal, respiratory depression and hypothermia, has been confirmed in various MOR knockout (MuKO) mouse lines (Loh et al., 1998; Matthes et al., 1996; Schuller et al., 1999; Sora et al., 1997; Tian et al., 1997). Thus, an obvious candidate gene for controlling differences in morphine consumption and preference between B6 and D2 mice located near the peak of the initial Chr 10 QTL linkage map and within the critical genomic region introgressed in congenic strains is Oprm1. However, in addition to Oprm1, the Mop2 critical interval harbors several other genes that have been documented to be involved in the actions or effects of opioids. The present work analyzes 5 candidate genes; [.proportional]-opioid receptor (Oprm1; GRCm38/mm10 build genomic base pair position 10:6,788,570-7,038,209), iodotyrosine deiodinase (Iyd; a.k.a. Dehal1, 10:3,540,279-3,554,877), vasoactive intestinal polypeptide (Vip, 10:5,639,218-5,647,614), regulator of G-protein signaling 17 (Rgs17; a.k.a. RgsZ2, 10:5,825,664-5,922,400) and protein phosphatase 1 (PP1) regulatory (inhibitor) subunit 14c (Ppp1r14c; a.k.a. KEPI, 10:3,366,150-3,464,975), defined by the congenic strain approach, that could explain, at least in part, the morphine preference QTL (Mop2), as well as other morphine-based quantitative traits that map to the proximal region of mouse Chr 10 (Belknap et al, 1995; Bergeson et al, 2001).
2.1 Experimental Procedures
2.1.1 Animals
The animals used in these studies were derived from B6 and D2 mice originally purchased from the Jackson Laboratory (Bar Harbor, ME) and propagated at our animal colony at the Veterans Affairs Medical Center, Coatesville, PA. Genetic drift in the colony is minimized by supplementing breeders with additional animals purchased from the Jackson Laboratory several times per year. Mice are weaned at 3-4 weeks of age and group-housed by sex until used for experimentation. They are kept on a light/dark cycle of 14 h on (lights on at 0700 h) and 10 h off and have free access to food. Water is ad libitum except during the two-bottle choice paradigm described below. All studies were approved by the Institutional Animal Care and Use Committees governing the participating laboratories.
The congenic mice used in these studies (see Figure 1) were created in our laboratory with a marker-assisted breeding strategy as described (Doyle et al., 2008; Ferraro et al., 2005). The D2.B6-Mop2-P1.pD.dB subcongenic strain was derived by backcrossing heterozygous D2.B6-Mop2-P1 congenic mice (Doyle et al., 2008) to parental D2 mice and tracking recombination by marker analysis within the original introgressed region. To propagate mice for the two-bottle choice experiments, the D2.B6-Mop2-P1-pD.dB strain was made heterozygous across the introgressed region by backcrossing to D2 mice. Heterozygous D2.B6-Mop2-P1-pD.dB mice were mated together to create homozygous D2.B6-Mop2-P1-pD.dB or D2.B6-Mop2-P1.pD.dD congenic mice for use in these studies. Thus, D2.B6-Mop2-P1.pD.dD congenic mice are the “control” littermates of crosses of the heterozygous D2.B6-Mop2-P1-pD.dB mice, and are essentially genetic equivalents of the D2 strain, residual components of B6 genome from congenic strain production notwithstanding.
Figure 1. Schematic of Chr 10 in congenic strains tested in the two-bottle choice paradigm.
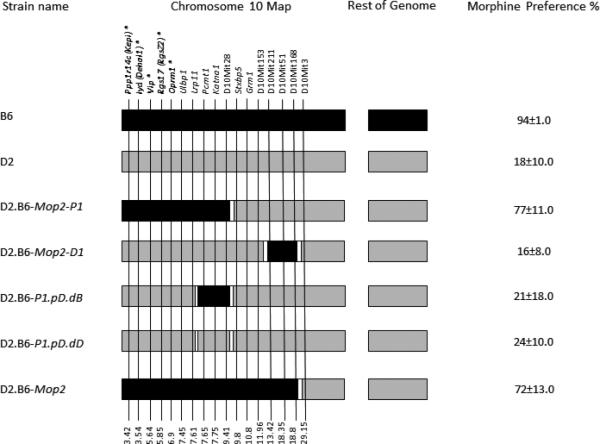
The mouse strains presented in this report is shown. Genes and DNA microsatellite markers that were genotyped for these studies are given above the Chr. Their relative positions (in Mbp from the acromere) on the physical map (genome.ucsc.edu; GRCm38/mm10) are given below the Chr (see also Figure 4). Black reflects regions contributed by the B6 parental strain whereas grey regions reflect contributions from the D2 parental strain. White regions indicate regions of undetermined origin. Genes targeted for expression analysis are highlighted in bold and indicated with an asterisk. Note that strain D2.B6-P1.pD.dD (littermate controls) mice are essentially genetically identical to parental D2 mice. The two-bottle choice morphine preference scores for the various strains tested are indicated to the right of the figure.
2.1.2 Genotyping
Analysis of DNA markers D10Mit166 and D10Mit28 was performed by PCR amplification followed by electrophoresis of products on polyacrylamide gels as described previously (Berrettini et al., 1994b). A single nucleotide polymorphism (SNP) between B6 and D2 mice in exon 10 of Oprm1 that creates a DdeI restriction site was used to genotype congenic mice at this genetic locus as described previously (Ferraro et al., 2005). Primer sequences, PCR parameters and RFLP digestion protocols for genotyping of SNPs within Ppp1r14c (a.k.a. KEPI), Ulbp1 (a.k.a. 9230019H11Rik), Lrp11, Pcmt1 and Katna1 are available upon request.
2.1.3 Two-bottle Choice Test for Morphine Preference
Eight to ten week old male mice were housed individually for the duration of the 12-day two-bottle choice drinking test. Mice had free access to food throughout the experiment. The morphine/quinine two-bottle choice test was performed as described previously (Doyle et al., 2008). Morphine consumption and preference scores were calculated as described previously (Berrettini et al., 1994b; Ferraro et al., 2005).
2.1.4 Gene Expression
Several genes within the introgressed critical region have a biological relationship to opioid pharmacology and were selected for expression analysis. Selection was based on PubMed literature searches that included the search terms “opioid”, “opiate” or “morphine” in combination with names or symbols of each of the 22 genes remaining within the critical interval. Brain tissue was obtained from parental B6 or D2 mice that were experimentally naïve or that were 5-days post-surgery for implantation of sham (placebo control) or morphine (25 mg) pellets. Total RNA was prepared from whole brain or specific brain regions using the Trizol® reagent method as recommended by the manufacturer (Life Technologies, Grand Island, NY USA). RNA was quantified by UV spectraphotometry. Integrity of RNA was assessed by visualization of 28S and 18S rRNA bands under ultraviolet illumination after denaturing formaldehyde gel electrophoresis in the presence of ethidium bromide. Prior to reverse transcription, equivalent amounts of total RNA (typically 2 μg) were treated with RNAse-free DNAse I (Sigma-Aldrich, Saint Louis, MO USA) at 25°C for 15 minutes and EDTA stop solution added to chelate Mg2+ ions before heat-inactivation of DNAse I at 70°C for 10 minutes. For whole brain samples, total RNA was reverse transcribed into cDNA with random hexamers for gene expression assays. For discrete brain region gene expression analysis, the polyadenylated mRNA portion of total RNA was reverse transcribed with oligomer(dT)18 using the Superscript II® first strand cDNA synthesis kit under conditions recommended by the manufacturer (Life Technologies). Steady-state mRNA levels were determined in triplicate by real-time qRT-PCR in a 7900HT instrument using the following TaqMan® gene expression assays: Oprm1 exon 2-3 (Mm01188089_m1), Oprm1 exon 3-4 (Mm00565144_m1), Oprm1 custom-designed MOR-1 long 3’UTR (Mm_Mu3’UTR), Rgs17 (Mm00490876_m1), Ppp1r14c (Mm00652462_m1), Iyd (Mm00503564_m1), Vip (Mm00660234_m1) and Actb endogenous control (4352341E; used to normalize). With the exception of the custom-designed Oprm1 MOR-1 long 3’UTR assay, all assays were designed to cross an exon-exon junction and were determined to have a PCR efficiency within 10% of 100% established by the manufacturer. Replicate determinations for each assay were done in 384 well plates in a total reaction volume of 20 μl which was composed of 10 μl 2X TaqMan® gene expression master mix, 1 μl 20X gene expression assay mix, 4 μl cDNA (~1 ng converted mRNA input) and 5 μl water. Reactions were cycled under standard PCR conditions and fluorescence readings taken in real-time on a 384-well block-equipped 7900HT as recommended by the manufacturer (Life Technologies). The baseline and threshold for each assay were determined automatically with automatic removal of technical replicate outliers in a relative quantification study using the SDS 2.2.2 software (Life Technologies). Replicate cycle thresholds (CT) were averaged for the target and endogenous control genes and ΔCT determined for each biological sample. The ΔCT values were averaged prior to calculation of the ΔΔCT for use in fold-difference determination by the 2−(ΔΔCT) method (Livak and Schmittgen, 2001). Lower and upper ranges were calculated using the formula 2−(ΔΔCT+SD) and 2−(ΔΔCT-SD), respectively, where SD is the standard deviation of the ΔΔCT determination.
2.1.5 Rgs17 Protein Expression analysis
Brain tissue was obtained from parental B6 or D2 mice that were 5-days post-surgery for implantation of sham (placebo control) or morphine (25 mg) pellets (N=3 for each group). Brain regions were dissected and homogenized in ice cold protein extraction buffer (100 mM Tris-HCl; pH 7.4, 150mM NaCl, 15% glycerol, 2% Triton X-100, 1 mM DTT, 0.5 mM PMSF and 1X Complete mini protease inhibitors (Roche)), and the extract spun at 21,000g for 10 min at 4°C to pellet nuclei, mitochondria and insoluble proteins. The supernatant containing the soluble proteins was taken as brain region extracts. Total protein concentrations for each extract were determined by the bichinchonic acid (BCA) protein assay (Thermo-Scientific, Rockford, IL, USA). For immunoblot analysis, 50 μg of total protein extract from each brain region was separated on a 4-12% Bis-Tris NuPage gel in 1X MOPS buffer. The gels were transferred to nitrocellulose using an iBlot (Thermo-Scientific, Rockford, IL, USA) semi-dry blotter, blots were stained with Ponceau S and then blocked in 10% non-fat dry milk in 1X Tris-buffered saline containing 0.1% Tween-20 (TBST). Blots were incubated with a 1:5000 dilution of mouse anti-[.beta]-actin antibody (MAB1501, Millipore, Temecula, CA, USA) for 1 hr at room temperature in TBST containing 5% non-fat dry milk. Blots were incubated overnight at 4°C in 1X Odyssey blocking reagent (Li-Cor, Lincoln, NE, USA) containing a 1:1000 dilution of chicken anti-Rgs17 (GTX14260, GeneTex, Irvine, CA, USA). Blots were then washed in 1X phosphate-buffered saline containing 0.1% Tween-20 (PBST), then incubated in 1:10,000 dilution of donkey anti-chicken IRDye-680LT (Li-Cor) and donkey anti-mouse IRDye-800RW (Li-Cor) secondary antibodies in 1X Odyssey block reagent at room temperature for 1 hr. Blots were washed in PBST and then rinsed in PBS before scanning on an Odyssey infra-red scanner at settings of 169 micron resolution, quality set to high, 700 nm intensity of 5 and 800 nm intensity of 7. Multi-color images were exported in .tif format in separate grayscale images. 700 nm grayscale (Rgs17) and 800 nm grayscale (β-actin) bands were quantified using ImageJ software (National Institutes of Health, Bethesda, MD, USA) software. Band intensities were measured and the ratio of Rgs17/β-actin taken for each lane. The ratio averages and standard deviations were taken for each group (N=3) and the results graphed using Excel 2007 (Microsoft, Redmond, WA, USA).
2.1.6 Statistical analysis
Graphs were made using either Microsoft Office Excel 2007 (Redmond, WA, USA) or GraphPad Prism software version 4.0 (San Diego, CA USA). Statistical analyses were performed using JMP 8.0 (SAS Institute, Inc., Cary, NC USA) or GraphPad Prism 4.0 software. Two-bottle choice drinking data were compared by ANOVA with Tukey-Kramer Honestly Significant Difference (HSD) post-hoc analysis with alpha set to 0.05. Grubb's test (http://www.graphpad.com/quickcalcs/grubbs1/) was used to determine ΔCt value outliers among biological replicates prior to final analysis by Wilcoxon rank sum test. The Wilcoxon rank sum test was used to determine statistical significance of gene expression data by comparisons of the average replicate ΔCt values (Gene - β-actin) between strains (sham- versus sham-pellet implanted) or within each strain (sham- versus morphine-pellet implanted). Rgs17/β-actin protein ratio averages were compared by one-way ANOVA and statistical significance (p<0.05) was determined by non-parametric Wilcoxon rank sum test.
3.1 Results
3.1.1 Two-bottle choice experiments
Since the time of the initial report on the presence of a QTL on proximal Chr 10 for voluntary morphine consumption and preference (Berrettini et al., 1994b), we have continued to backcross the D2.B6-Mop2 mice (Ferraro et al., 2005) to their background parental strain (D2) to generate subcongenic lines for refined QTL mapping (Doyle et al., 2008). Thus, we created the D2.B6-Mop2-P1 and D2.B6-Mop2-D1 subcongenic strains. Further backcrossing of the D2.B6-Mop2-P1 subcongenic strain recently led to a new Chr 10 recombinant, namely D2.B6-P1.pD.dB and its littermate control, namely D2.B6-P1.pD.dD (see Figure 1 for map).
We tested these new congenic strains (Figure 1, strains D2.B6-P1-pD.dB and D2.B6-P1-pD.dD) for morphine consumption and preference in a two-bottle choice paradigm as described (Berrettini et al., 1994b; Ferraro et al., 2005; Doyle et al., 2008). Figures 2 and 3 show the results of these experiments. Levels of morphine consumption were significantly different among strains (ANOVA with Tukey-Kramer HSD post-hoc: F(6,49)=33.82; p<0.0001) with B6 different from all other strains (p<0.0001), D2.B6-Mop2 and D2.B6-Mop2-P1 statistically equivalent to each other (p=0.999), but different from D2, D2.B6-Mop2-D1, D2.B6-P1-pD.dB and D2.B6-P1-pD.dD (p<0.05 to p<0.01; Figure 2). Levels of quinine consumption were statistically different among strains (ANOVA with Tukey-Kramer HSD post-hoc: F(6,49)=29.13; p<0.0001) with D2, D2.B6-Mop2-D1, D2.B6-P1-pD.dB and D2.B6-P1-pD.dD statistically equivalent to each other (p=0.92-1.00) and B6, D2.B6-Mop2 and D2.B6-Mop2-P1 statistically equivalent to each other (p=0.31-0.99) but with the strains in one group all being statistically different from strains in the other group (p<0.0001 for all comparisons except D2.B6-Mop2 versus D2.B6-P1-pD.dD where p=0.001) (Figure 2). There was also a statistically significant strain effect for total fluid intake (ANOVA with Tukey-Kramer HSD post-hoc: F(6,49)=20.70; p<0.0001) where B6 was significantly different (p<0.0001) from all other strains, but no other strains were statistically different from each other (p=0.35-1.00) (Figure 3). There was a statistically significant strain effect as well for morphine preference score (ANOVA with Tukey-Kramer HSD post-hoc: F(6,49)=88.02; p<0.0001) with B6 preference different from D2, D2.B6-Mop2-D1, D2.B6-P1-pD.dB and D2.B6-P1-pD.dD (p<0.0001 for all comparisons), from D2.B6-Mop2-P1 (p=0.013) and from D2.B6-Mop2 (p<0.01) (Figure 3). Similar to previous results (Berrettini et al, 1994a), the phenotypic measures of morphine consumption and morphine preference were marked by a strong positive correlation (Pearson r=0.9316; r2=0.8679, p<0.0001) whereas quinine consumption and morphine preference were marked by a strong negative correlation (Pearson's r=-0.9493; r2=0.9011, p<0.0001).
Figure 2. Morphine and quinine consumption by Chr 10 congenic mice.

Mouse strains (see Fig 1 for key) were tested in the two-bottle choice paradigm with saccharin plus morphine or quinine as described in section 2.1.3. The mean (+SEM) consumption over days 9-12 is shown. ANOVA with Tukey's HSD post-hoc: * P<0.0001 vs. all other strains; # p<0.01 vs. strains D2, D2.B6-D1, P1-pD.dB and P1-pD.dD; @ p<0.05 vs. strains D2, D2.B6-D1, P1-pD.dB and P1-pD.dD for morphine consumption. & P<0.0001 vs. strains D2, D2.B6-D1, P1-pD.dB and P1-pD.dD; $ p=0.001 vs. strain P1-pD.dD for quinine consumption. Note that strain P1-pD.dD (littermate controls) mice are essentially genetically identical to parental D2 mice. Data for strains B6, D2, D2.B6-P1, D2.B6-D1 and D2.B6-Mop2 were originally published in and are reproduced from (Doyle et al., 2008).
Figure 3. Morphine preference and total fluid intake by Chr 10 congenic mice.

Mouse strains (see Fig 1 for key) were tested in the two-bottle choice paradigm with saccharin plus morphine or quinine as described in section 2.1.3. The mean (+SEM) preference scores and total fluid intake over days 9-12 is shown. ANOVA with Tukey's HSD post-hoc: * P<0.0001 vs. all other strains for total fluid intake. # P<0.0001 vs. strains D2, D2.B6-D1, P1-pD.dB and P1-pD.dD for morphine preference. @ P<0.02 vs. strains D2.B6-P1 and D2.B6-Mop2 for morphine preference. Note that strain P1-pD.dD (littermate controls) mice are essentially genetically identical to parental D2 mice. Data for strains B6, D2, D2.B6-P1, D2.B6-D1 and D2.B6-Mop2 were originally published in and are reproduced from (Doyle et al., 2008).
Overall, strains with the B6 Mop2 locus (i.e. D2.B6-Mop2 and D2.B6-Mop2-P1) exhibit drinking behavior similar to the B6 strain (Figures 2 and 3). Conversely, strains with the D2 Mop2 locus (i.e. D2.B6-P1.pD.dB, D2.B6-P1.pD.dD and D2.B6-Mop2-D1) resemble the D2 strain in drinking behavior (Figures 2 and 3). Whereas D2.B6-Mop2-D1, D2.B6-P1.pD.dB and D2.B6-P1.pD.dD strains show morphine preference scores similar to D2 (0.16±0.08 for D1; 0.21±0.18 and 0.24±0.10 for P1.pD.dB and P1.pD.dD, respectively, vs. 0.18±0.10 for D2), the D2.B6-Mop2 and D2.B6-Mop2-P1 strains exhibit significantly lower morphine preference scores than B6 (0.94±0.01 for B6 vs. 0.72±0.13 for D2.B6-Mop2 and 0.77±0.11 for D2.B6-Mop2-P1) (Figures 1 and 3). This can be explained by the use of quinine in the control bottle, because mice with a D2 genetic background exhibit much weaker aversion to quinine compared to B6 mice (Berrettini et al., 1994b; Lush, 1984). These data suggest that D2.B6-Mop2-P1 mice retain the B6 gene(s) responsible for the Chr 10 QTL, whereas D2.B6-Mop2-D1, D2.B6-P1.pD.dB and D2.B6-P1.pD.dD mice do not. This places the Mop2 QTL gene(s) within the region of Chr 10 between the acromere and the Lrp11 locus. Thus, the major genetic influence mediating the difference in morphine consumption and/or preference between B6 and D2 mice most likely arises from one or more of 22 genes within the most proximal portion of Chr 10, between the acromere and Lrp11 (Figure 4).
Figure 4. Chr 10 genes within the introgressed congenic critical interval.

UCSC genome browser (genome.ucsc.edu; GRCm38/mm10) screen shot showing the 22 candidate genes remaining within the introgressed region of D2.B6-Mop2-P1.pD.dB congenic mice. The scale and base pair position of each gene is shown along the top of the image. SNPs existing among all (i.e. not just B6 and D2) sequenced mouse strains are shown at the bottom of the image. Color coding of SNPs is by conventional (default) settings used by the UCSC genome browser.
3.1.2 Gene Expression Analysis
Real-time quantitative RT-PCR gene expression analysis was performed on genes within the introgressed Mop2 region that have a documented relation to opioid pharmacology (i.e. Oprm1, Rgs17, Vip, Iyd and Ppp1r14c) (Figures 5 and 6). Neither the exon 3-4 nor the custom-designed MOR-1 3’UTR Oprm1 assays showed statistically significant differences in whole brain expression between naïve B6 and D2 mice (Figure 5A, see “cohort 3”). Similarly, neither the exon 2-3 nor the custom-designed MOR-1 3’UTR Oprm1 assays showed within-strain differences after morphine treatment in the brain regions examined (striatum, nucleus accumbens [Nacc], midbrain/brainstem [Mb/Bs] or frontal cortex [FCx]; Figure 6A and 6B). However, whereas the Oprm1 exon 2-3 assay showed no differences between strains at baseline in any brain region (Figure 5A), the custom-designed Oprm1 MOR-1 3’UTR assay revealed a statistically significant strain difference in FCx with D2 showing higher levels than B6 (Wilcoxon Rank Sum test: Z=2.259, p=0.024; Figure 5A). Ppp1r14c showed no statistically significant differences in either FCx or Mb/Bs between strains at baseline (Figure 5B) or within strains after morphine treatment (Figure 6C). In contrast, Vip showed no statistically significant difference between strains at baseline (Figure 5B), but was increased significantly in B6 FCx (Wilcoxon Rank Sum test: Z=2.647, p=0.008), decreased significantly in B6 Mb/Bs (Wilcoxon Rank Sum test: Z=-2.802, p=0.005) after morphine treatment, and unchanged in both brain regions of the D2 strain after morphine treatment (Figure 6C). Iyd levels were not significantly different in FCx between strains (Figure 5B), but were significantly lower in B6 than D2 Mb/Bs at baseline (Wilcoxon Rank Sum test: Z=2.123, p=0.034; Figure 5B). Iyd levels increased significantly in both brain regions in B6 in response to morphine treatment (Wilcoxon Rank Sum test: Z=2.482, p=0.013 in FCx; Z=2.647, p=0.008 in Mb/Bs; Figure 6C), but remained statistically unchanged following morphine treatment of D2 mice (Figure 6C). Finally, Rgs17 mRNA levels were significantly greater (~1.4X) in D2 than B6 mice at baseline in FCx, Mb/Bs and nucleus accumbens (Nacc), but not in striatum (Wilcoxon Rank Sum test: Z=2.082, p=0.037 in FCx; Z=2.327, p=0.020 in Mb/Bs; Z=2.082, p=0.037 in Nacc; Figure 5B); Rgs17 mRNA levels in FCx increased in response to morphine treatment in both strains (Wilcoxon Rank Sum test: Z=2.551, p=0.011 in B6; Z=-2.327, p=0.020 in D2; Figure 6D). Interestingly, the D2 strain showed a greater fold-increase in Rgs17 mRNA levels in response to morphine treatment than the B6 strain (Figure 6D). The effect of morphine pellet implantation on Rgs17 mRNA levels in B6 mice appears somewhat independent of the μ-opioid receptor as MuKO mice (Sora et al., 1997) bred to the B6 background showed a similar increase in Rgs17 mRNA levels as the wild-type B6 strain (Figure 6D). In striatum, there was a statistically significant decrease in Rgs17 mRNA levels in both strains after morphine treatment (Z=-2.551, p=0.011 in B6; Z=2.0821, p=0.037 in D2; Figure 6D), an effect that appears dependent on expression of the μ-opioid receptor (Z=-0.7462, p=0.456 in MuKO; Figure 6D). Finally, in the Nacc, there appears to be an effect of morphine only in the MuKO mice (Z=-2.452, p=0.014; Figure 6D), a result that is presumably independent of the μ-opioid receptor given the lack of statistically significant changes in Rgs17 levels in the Nacc of B6 or D2 mice after chronic morphine treatment (Figure 6D).
Figure 5. Baseline gene expression differences between B6 and D2 mice.


B6 gene expression levels were used as an arbitrary comparator, and were set to a value of 1.0. The relative level of target gene expression (2^−(ΔΔCt) method) is given with error bars indicating the lower (2^−(ΔΔCt+S.D.)) and upper (2^−(ΔΔCt-S.D.)) bounds calculated from the standard deviations (S.D.). The p-values were determined using the Wilcoxon Rank Sum test on the means and standard deviations of the ΔCT values. (A) Oprm1 gene expression was measured in either whole brain [Wb] of naïve mice (cohort 3) or in the brain regions indicated (striatum, nucleus accumbens [Nacc], midbrain/brainstem [Mb/Bs], frontal cortex [FCx]) of sham pellet-implanted mice (cohorts 1 and 2) using either the exon 2-3, exon 3-4 or custom MOR-1 3’UTR Taqman assay. * p≤0.05. (B) Rgs17, Vip, Iyd and Ppp1r14c gene expression was measured in the brain regions indicated of sham pellet-implanted mice (cohorts 1 and 2) using the corresponding Taqman assays. * p≤0.05. Note that Rgs17 data are from cohort 1 and Vip, Iyd and Ppp1r14c data are from cohort 2. (See Table 1 for the numbers of mice in each strain cohort.)
Figure 6. Gene expression differences between sham or morphine pellet-implanted B6 or D2 mice.


Sham pellet-implanted gene expression levels were used as an arbitrary comparator, and were set to a value of 1.0. The relative level of target gene expression (2^−(ΔΔCt) method) is given with error bars indicating the lower (2^−(ΔΔCt+S.D.)) and upper (2^−(ΔΔCt-S.D.)) bounds calculated from the standard deviations (S.D.). The p-values were determined using the Wilcoxon Rank Sum test on the means and standard deviations of the ΔCT values. Oprm1 gene expression was measured in the brain regions indicated (striatum, nucleus accumbens [Nacc], midbrain/brainstem [Mb/Bs], frontal cortex [FCx]) of sham or morphine pellet-implanted (A) B6 mice (cohorts 1 and 2) or (B) D2 mice (cohorts 1 and 2) using either the exon 2-3 or custom MOR-1 3’UTR Taqman assay. (See Table 1 for the numbers of mice in each strain cohort). (C) Vip, Iyd or Ppp1r14c gene expression was measured in the brain regions indicated (striatum, nucleus accumbens [Nacc], midbrain/brainstem [Mb/Bs], frontal cortex [FCx]) of sham or morphine pellet-implanted B6 mice (cohort 2) or D2 mice (cohort 2) using the corresponding Taqman assays. * p≤0.05, ** p≤0.01. (D) Rgs17 gene expression was measured in the brain regions indicated (striatum, nucleus accumbens [Nacc], midbrain/brainstem [Mb/Bs], frontal cortex [FCx]) of sham or morphine pellet-implanted B6 mice (cohort 2) or D2 mice (cohort 2) using the corresponding Taqman assay. * p≤0.05. (See Table 1 for the numbers of mice in each strain cohort).
3.1.3 Rgs17 Protein Expression Analysis
Because Rgs17 has the most direct relationship to morphine signaling through the μ-opioid receptor, we determined Rgs17 protein levels (Figure 7) within the various brain regions examined at the gene expression level (Figures 5 and 6). In contrast to the gene expression results for FCx and Striatum, there were no statistically significant differences in Rgs17 protein levels in these brain regions between strains after sham-pellet implantation or within-strains comparing sham- to morphine-pellet implanted groups (Figure 7). In agreement with the Rgs17 gene expression results (Figure 5B), Rgs17 protein levels were significantly higher in the Mb/Bs and Nacc of D2 sham-pellet implanted animals than in sham-pellet implanted B6 animals (Figure 7). In contrast to no differences in Rgs17 gene expression (Figure 6D), Rgs17 protein levels were significantly decreased in the Mb/Bs of D2 mice after morphine-pellet implantation. Finally, there were trends (p<0.13) toward statistically significant increased and decreased Rgs17 protein expression in the Mb/Bs and Nacc, respectively, of B6 mice after morphine-pellet implantation (Figure 7).
Figure 7. Rgs17 protein expression in various brain regions of sham- and morphine-pellet implanted B6 or D2 mice.
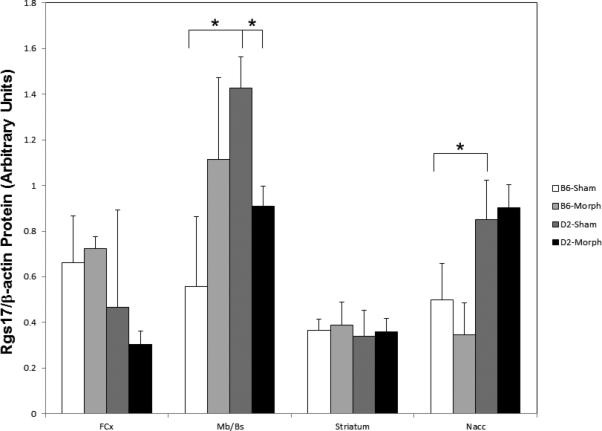
Total protein from the indicated brain regions was analyzed for Rgs17 and β-actin protein expression by infra-red fluorescent immunoblot. Band intensities were measured and the β-actin signal was used to normalize the Rgs17 signal in each lane. The averages and standard deviations for each group (N=3) are shown in arbitrary units. Statistical significance was determined by one-way ANOVA followed by the non-parametric Wilcoxon rank sum test. An asterisk (*) indicates p<0.05 for the comparisons indicated by the lines.
4.1 Discussion
4.1.1 Oprm1
Results of this study provide new information on the identity and expression of candidate ‘quantitative trait genes’ (QTG) for the Mop2 QTL. Consistent with prior studies, Oprm1 remainsa strong candidate gene involved in explaining the Mop2 QTL. In addition, our results suggest that other nearby genes likely play key roles in modulating B6-D2 strain differences in morphine-induced behavioral phenotypes. Support for Oprm1 as one candidate gene comes from several lines of investigation: 1) it is located under the original QTL peak (Berrettini et al., 1994b; Kozak et al., 1994; Giros et al., 1995), 2) its product, MOR, functions as the main receptor for morphine in the brain (Pasternak, 2001), 3) studies with the MOR-selective antagonist naltrexone suggest that MOR controls the two-bottle choice morphine preference phenotype (Berrettini et al., 1994a), 4) Oprm1 contains coding and non-coding polymorphisms between B6 and D2 mice that may have functional significance (Doyle et al., 2006). Therefore, results of studies on the D2.B6-Mop2-P1 (Doyle et al., 2008), and D2.B6-P1.pD.dB and D2.B6-P1.pD.dD congenic strains (presented here) continue to support the aforementioned hypothesis regarding Oprm1 as at least one of the causative gene(s) on Chr 10 that mediates the morphine consumption and preference (Mop2) QTL between B6 and D2 mice (Ferraro et al., 2005).
Despite compelling evidence that Oprm1 (GRCm38/mm10 build genomic base pair position 10:6,788,570-7,038,209) is the morphine preference QTG, there are at least four other genes in the group of 22 remaining within the introgressed region that have some pharmacological relationship to opioids and which therefore also represent candidates for influencing the morphine preference phenotype. Notably, two candidate genes, Rgs17 and Ppp1r14c, influence MOR signal transduction initiated upon morphine binding, whereas two others, Iyd and Vip, might modulate the effects of morphine in other ways.
4.1.2 Iyd
One of the relevant genes in the interval is lyd. Whereas iodothyronine deiodinase (Dio) enzyme isoforms are specifically regulated by the selective MOR agonist etonitazene in rats (Baumgartner et al., 1998), the relationship between iodotyrosine deiodinase (Iyd; a.k.a. Dehal1, 10:3,540,279-3,554,877) and MOR agonists such as morphine is less clear. The Iyd gene is distinct from the iodothyronine deiodinase (Dio) genes that are highly expressed in the thyroid gland and scavenge iodine (Rokita et al., 2010). The role of Iyd in the thyroid gland is to scavenge iodine from diiodotyrosine (DIT) and monoiodotyrosine (MIT); byproducts of the formation of thyroid hormone from thyroglobulin. Nonetheless, Iyd is expressed in the frontal cortex, the thalamus and the hippocampus of mouse brain (Allen Brain Atlas; Newrzella et al., 2007) as well as in brain regions of other species (Gaupale et al., 2009) where its role remains unknown. Despite the efficient nature of lysosomal uptake and recycling of MIT and DIT in the thyroid gland (Gnidehou et al., 2004; Rokita et al., 2010), it is controversial whether these halogenated tyrosine byproducts ever gain access to the general circulation from the thyroid gland, and gain access to the brain by crossing the blood-brain barrier (Weinert et al., 1967; Wellby and O'Halloran, 1969). If monoiodinated tyrosine can be transported across the blood-brain barrier, it could act as a potent inhibitor of tyrosine hydroxylase (Goodchild and Brownlee, 1969; Karobath, 1971; Wicker-Thomas and Hamann, 2008). We speculate that Iyd might relieve tyrosine hydroxylase inhibition by deiodinating monoiodotyrosines that have gained access to the brain and, thus, allow shunting of the resultant tyrosine into the dopamine synthesis pathway. We find that morphine selectively increased Iyd expression in morphine implanted B6 mice, but not D2 mice (Figure 6C). This might then lead to potentially greater levels of dopamine synthesis in B6 brain regions after morphine, which could enhance the rewarding effects of the drug.
4.1.3 Vip
Vasoactive intestinal polypeptide (Vip, 10:5,639,218-5,647,614) induces analgesia, perhaps through an interaction with the MOR, yet it reduces acute morphine analgesia (anti-nociception) and blocks the development of tolerance to the analgesic effects of morphine using the radiant heat tail flick assay (Mácsai et al., 1998; Szabó et al., 1998). We find no difference in Vip expression between sham pellet-implanted B6 and D2 mice (Figure 5B), but increased and decreased expression of Vip in FCx and Mb/Bs, respectively, of morphine pellet-implanted B6 mice compared to D2 mice (Figure 6C). Whether Vip plays any role in morphine consumption or preference remains unclear; however, given the decreased expression of Vip in the Mb/Bs in B6 mice after morphine treatment, it is possible that Vip might play some role in differential analgesic (hot plate assay) responses between the two strains (Bergeson et al., 2001).
4.1.4 Ppp1r14c
The candidates with the strongest biological support after Oprm1 are regulator of G-protein signaling 17 (Rgs17; a.k.a. RgsZ2, 10:5,825,664-5,922,400) and protein phosphatase 1 (PP1) regulatory (inhibitor) subunit 14c (Ppp1r14c; a.k.a. kinase-enhanced PP1 inhibitor (KEPI), 10:3,366,150-3,464,975). Ppp1r14c functions in the signal transduction pathway activated by the MOR and has been reported to be up-regulated mainly in hippocampus and in thalamus following acute and chronic morphine treatment, respectively, but also to a lesser extent in cortex and midbrain after chronic morphine treatment (Liu et al., 2002). In contrast, we observed no statistically significant differences when Ppp1r14c mRNA expression was compared between B6 and D2 strains after sham pellet implantation, or within strains after chronic morphine pellet implantation (Figures 5B and 6C). This discrepancy may be a reflection of differences in brain regions studied or methodologies used for measurement of mRNA (Northern blot in (Liu et al., 2002), real-time qRT-PCR used here).
Drgonova et al. (2010) reported strain background effects on morphine-related phenotypes and behaviors in Ppp1r14c (KEPI) null mutant knockout (KO) mice. Notably, their “original” KEPI KO line, on a mixed 129S6/C57BL/6 background, showed differences (between KO and littermate control mice) in the acute tail flick and hot plate tests that were not observed in a “recombinant” KEPI KO line (Drgonova et al., 2010) where the Oprm1 allele was derived from the B6 background strain. The discrepancies in their results were attributed to differences at the Oprm1 locus (129S6 versus B6 allele) rather than to a specific effect of KEPI deletion. Nonetheless, whereas the “recombinant” KEPI KO line showed no KEPI genotype-based difference in development of dependence, as measured by jumps recorded after naloxone-precipitated withdrawal, KEPI deletion resulted in faster development of tolerance to morphine measured using the chronic hot plate test, but no difference in spinal analgesia measured using the tail flick test. In addition, their “recombinant” KEPI KO line showed a rightward shift in the morphine dose response curve using a conditioned place preference paradigm (Drgonova et al., 2010). Thus, although issues of impure strain backgrounds hamper interpretation of the Drgonova et al. (2010) data, and our data indicate no between-strain or within-strain differences in Ppp1r14c (KEPI) mRNA expression after chronic sham or morphine pellet implantation, respectively (Figures 5B and 6C), Ppp1r14c (KEPI) may affect the degree of morphine preference in the two-bottle choice paradigm by virtue of effects on reward and tolerance.
4.1.5 Rgs17
Interestingly, the results of Ppp1r14c (KEPI) deletion on supraspinal nociception (hot plate assay) versus spinal analgesia (tail flick assay) were noted to be similar to effects in mice with a Gz deletion, the gene encoding the G-protein that is regulated by Rgs17 (a.k.a. RgsZ2) (Drgonova et al., 2010; Hendry et al., 2000; Yang et al., 2000; Garzón et al., 2005b). Rgs17 forms complexes with MOR after morphine treatment, and is thought to play a role in MOR desensitization (Garzón et al., 2005a, 2005b). Rgs17 mRNA levels in FCx, Mb/Bs and Nacc at baseline are significantly greater (~1.4X) in D2 compared to B6 mice (Figure 5B); however, in the FCx, a difference in baseline protein expression was not observed (Figure 7). The higher baseline expression of Rgs17 mRNA (Figure 5B) and Rgs17 protein (Figure 7) in the Nacc and Mb/Bs regions of D2 mice might result in a lower degree of reward from and craving for morphine, respectively, compared to B6 mice. Interestingly, in D2 but not B6 mice, Rgs17 protein levels showed a statistically significant decrease in the Mb/Bs after morphine-pellet implantation (Figure 7). In contrast, in both strains, there was no change in Rgs17 protein expression in the Nacc, Striatum, or FCx after morphine-pellet implantation (Figure 7). The decrease in Rgs17 protein expression in the Mb/Bs of D2 mice after morphine would presumably lead to a slower desensitization of the μ-opioid receptor in the ventral tegmental area, and, thus, subsequently lead to greater craving for morphine. Nonetheless, given the higher expression of Rgs17 protein in the Nacc (which does not change with morphine) (Figure 7), D2 mice might not succumb to cravings, by ingesting more morphine, because the subsequent reward would be diminished in this mouse strain. D2 mice also exhibit a greater relative increase in Rgs17 mRNA in FCx (Figure 6D); however, this difference was not observed at the protein level (Figure 7). This suggests differential transcriptional regulation between the strains within the FCx, as well as post-transcriptional regulation of Rgs17 expression, but further study is needed. Finally, Zhang et al., (2012) recently reported that polymorphisms within human RGS17 are associated with multiple drug abuse phenotypes including those involving opioid dependence. Of note, one of the associated polymorphisms, within the promoter region of RGS17, led to significantly lower levels of RGS17 mRNA in Yorubans, but not Caucasians (Zhang et al., 2012). Future work with post-mortem brain tissue will be needed to address whether such polymorphisms that alter Rgs17 mRNA changes result in differences in Rgs17 protein levels in various brain regions of control and opioid dependent individuals.
4.1.6 Study limitations
Several limitations of these studies should be noted. The mRNA changes delineated herein have not been extended to protein levels. Whereas we conclude that the 13 B6-derived genes remaining in the D2.B6-P1.pD.dB congenic strain are not responsible for the Mop2 QTL, this conclusion is based on a negative result with respect to morphine consumption and preference data. In the absence of another congenic strain (i.e. D2.B6-P1.pB.dD), we cannot exclude the possibility that some genes or polymorphisms within this region of Chr 10 modulate the Mop2 QTL through trans- or cis-regulatory effects, respectively. Because congenic strains were used to assess the behavioral phenotypes, but the parental strains were used in the gene expression analyses, we cannot exclude trans-effects of genetic variation within the parental genomes that do not exist within the isogenic congenic strains. Residual heterozygosity between congenic strains was not assessed, and could affect the behavioral phenotypes; however, we note that each of these strains was backcrossed to the parental inbred strain for greater than 10 generations making any residual heterozygosity, in theory, quite limited. Whereas we have not assessed directly the development of morphine dependence for each strain used in the drinking experiments, B6 mice exhibit clear signs of dependence in this test, even death by presumed overdose in 5% of B6 mice (Berrettini et al, 1994b). We are unsure of the level of dependence achieved in the D2 mice and other strains that do not consume large quantities of morphine in the drinking experiment. Nonetheless, after 5-day morphine pellet implantation, both the B6 and D2 strains exhibit clear signs of dependence as measured by withdrawal (jumping), after naloxone injection (data not shown).
The parental strains (B6 and D2) have been extensively studied with respect to various other morphine phenotypes including anti-nociception and analgesia, however, the various congenic and subcongenic strains described herein have not been assessed to the same extent (i.e. the D2.B6-Mop2-P1, D2.B6-Mop2-D1 or D2.B6-P1-pD.dB congenic strains). However, several of the strains were shared with other laboratories and some studies on these congenic strains have been reported in the literature. Particularly with respect to anti-nociception, Tapocik et al (2009) found that “B6 and B6D2 genotypes were significantly more sensitive than the D2 and D2B6 mice. The B6 and B6D2 genotypes did not differ from each other nor did the D2 and D2B6 genotypes. Therefore, baseline pain sensitivity was not affected by the introgression of the proximal region of Chr 10.” The B6D2 and D2B6 strains (strain D2.B6-Mop2 in the current manuscript) used in Tapocik et al (2009) were derived from breeders of our initial reciprocal congenic strains (B6.D2-Mop2 and D2.B6-Mop2; studied for morphine preference in Ferraro et al, 2005) that were sent from our mouse colony. Likewise, Bergeson et al (2001) found multiple QTL for anti-nociception, including one on proximal Chr 10, but state that “In the S3, the HMOR mice received half the dose of the LMOR (6 vs 12 mg/kg, respectively), yet the anti-nociception scores were closely similar (17.0 ± 8.3 vs 21.7 ± 6.7, respectively, n.s.). This shows that the S3 HMOR mice were about twice as sensitive to morphine as LMOR in terms of the equieffective dose.” Given that Bergeson et al (2001) found additional QTL affecting anti-nociception, that they bred for only 3 generations rather than making N10 generation reciprocal congenics (Ferraro et al, 2005), and that Tapocik et al (2009) found no difference between the parental and Chr10 congenic strains in anti-nociception, these data suggest modulation of the proximal Chr10 anti-nociception phenotype by other regions of the parental genome(s). Tapocik et al (2009) also studied analgesia with the reciprocal congenic strains (Ferraro et al, 2005), and found that “as was true for baseline nociception, introgression of the proximal Chr10 region did not alter acute sensitivity to the analgesic effects of morphine; the B6 and B6D2 genotypes did not differ from each other nor did the D2 and D2B6 genotypes. This was a surprising finding considering bQTL analyses have mapped the proximal chromosome region of 10 to morphine analgesia (Belknap et al., 1995) and other morphine-related behaviors (Berrettini et al., 1994b; Ferraro et al., 2005).” However, the reciprocal congenic strains (Ferraro et al, 2005) did differ in their development of tolerance to the analgesic effects of morphine (Tapocik et al, 2009). This again suggests modulation of the proximal Chr10 QTL phenotypes by other regions of the parental genome(s). In addition, it suggests differences in acute versus chronic effects of morphine in the strains.
4.1.7 Conclusions
In summary, we have narrowed a QTL, Mop2, controlling morphine consumption and preference in a two-bottle choice drinking paradigm, to a genomic interval of ~7.6 Mbp on Chr 10. The interval contains 22 genes including several notable biological candidates, including Oprm1. Given the potential for other genes in the newly refined Mop2 interval to affect the pharmacology of opioids, as well as their differential regulation by morphine, it is possible that multiple genetic variants contribute to the difference in morphine preference between B6 and D2 mice. Further refinement of the QTL interval will be required to prove definitively the identity of the QTG(s) within the Mop2 QTL.
Highlights.
Chr 10 morphine preference Mop2 QTL refined to 22 candidate genes.
Ppp1r14c mRNA does not differ among morphine treated C57BL/6 and DBA/2 mice
Differential mRNA expression of Iyd and Vip among C57BL/6 and DBA/2 mice
Morphine increases Rgs17 mRNA, but not Rgs17 protein in frontal cortex of DBA/2 and C57BL/6 mice
Rgs17 protein levels differ between C57BL/6 and DBA/2 mice in Midbrain/Brainstem and Nucleus accumbens regions
Table 1.
Gene Expression Analysis: Numbers of mice in each strain cohort
| Gene | Strain/Brain Region/Condition |
|---|---|
|
Oprm1 exon 2-3 2nd cohort |
B6 FCx Sham (n=6) B6 FCx Morphine (n=6) D2 FCx Sham (n=8) D2 FCx Morphine (n=7) B6 Mbn/Brstem Sham (n=6) B6 Mbn/Brstem Morphine (n=6) D2 Mbn/Brstem Sham (n=8) D2 Mbn/Brstem Morphine (n=7) |
|
Oprm1a exon 2-3 1st cohort |
B6 Mbn/Brstem Sham (n=4) B6 Mbn/Brstem Morphine (n=7) D2 Mbn/Brstem Sham (n=5) D2 Mbn/Brstem Morphine (n=4) B6 Striatum Sham (n=4) B6 Striatum Morphine (n=7) D2 Striatum Sham (n=5) D2 Striatum Morphine (n=3) B6 Nacc Sham (n=4) B6 Nacc Morphine (n=7) D2 Nacc Sham (n=5) D2 Nacc Morphine (n=4) |
|
Oprm1 exon 3-4 3rd cohort |
B6 Whole Brain naïve (n=3) D2 Whole Brain naïve (n=3) |
|
Oprm1 MOR-1 3′UTR 2nd cohort |
B6 FCx Sham (n=6) B6 FCx Morphine (n=6) D2 FCx Sham (n=8) D2 FCx Morphine (n=7) B6 Mbn/Brstem Sham (n=6) B6 Mbn/Brstem Morphine (n=6) D2 Mbn/Brstem Sham (n=8) D2 Mbn/Brstem Morphine (n=7) |
|
Oprm1 MOR-1 3′UTR 3rd cohort |
B6 Whole Brain naïve (n=3) D2 Whole Brain naïve (n=3) |
|
Rgs17a 1st cohort |
B6 FCx Sham (n=4) B6 FCx Morphine (n=7) D2 FCx Sham (n=5) D2 FCx Morphine (n=4) B6-MUKO FCx Sham (n=4) B6-MUKO FCx Morphine (n=6) B6 Mbn/Brstem Sham (n=4) B6 Mbn/Brstem Morphine (n=7) D2 Mbn/Brstem Sham (n=5) D2 Mbn/Brstem Morphine (n=4) B6-MUKO Mbn/Brstem Sham (n=4) B6-MUKO Mbn/Brstem Morphine (n=6) B6 Striatum Sham (n=4) B6 Striatum Morphine (n=7) D2 Striatum Sham (n=5) D2 Striatum Morphine (n=4) B6-MUKO Striatum Sham (n=4) B6-MUKO Striatum Morphine (n=6) B6 Nacc Sham (n=4) B6 Nacc Morphine (n=7) D2 Nacc Sham (n=5) D2 Nacc Morphine (n=4) B6-MUKO Nacc Sham (n=4) B6-MUKO Nacc Morphine (n=6) |
|
Vip 2nd cohort |
B6 FCx Sham (n=5)b B6 FCx Morphine (n=6) D2 FCx Sham (n=8) D2 FCx Morphine (n=7) B6 Mbn/Brstem Sham (n=6) B6 Mbn/Brstem Morphine (n=6) D2 Mbn/Brstem Sham (n=8) D2 Mbn/Brstem Morphine (n=7) |
|
lyd 2nd cohort |
B6 FCx Sham (n=6) B6 FCx Morphine (n=6) D2 FCx Sham (n=8) D2 FCx Morphine (n=7) B6 Mbn/Brstem Sham (n=5)b B6 Mbn/Brstem Morphine (n=6) D2 Mbn/Brstem Sham (n=8) D2 Mbn/Brstem Morphine (n=7) |
|
Ppp1r14c 2nd cohort |
B6 FCx Sham (n=6) B6 FCx Morphine (n=6) D2 FCx Sham (n=8) D2 FCx Morphine (n=7) B6 Mbn/Brstem Sham (n=6) B6 Mbn/Brstem Morphine (n=6) D2 Mbn/Brstem Sham (n=8) D2 Mbn/Brstem Morphine (n=7) |
Different cohorts of mice were used for Rgs17 and Oprm1 (exon 2-3) assays.
Acknowledgements
This work was supported by National Institutes of Health grants P20 DA 025995 to Wade H. Berrettini (P.I.) and P60 05186 to Charles P. O'Brien (P.I.) with WHB as co-investigator. GAD, TNF and WHB conceived and designed the experiments. GGS performed the two-bottle choice experiments under the auspices of RJB who headed the Research Services division of the DVAMC at Coatesville at the time the work was done. GAD and TNF compiled data for statistical analysis performed by GAD. CLS and SER performed the gene expression analyses. ADC, ATL, MJW, CLS and SER were instrumental in genotyping all mice used in or excluded from the experiments. We thank Emre Karatas and Matthew Hammond for doing confirmatory genotyping of mice used in the experiments, and for help with the immunoblot analysis. All authors read and approved the final version of the manuscript. The authors have no conflicts of interest to declare. This work does not represent the official views of the US government.
Abbreviations
- QTL
quantitative trait loci
- QTG
quantitative trait gene
- Mop2
morphine preference 2 QTL
- B6
C57BL/6J mouse
- D2
DBA/2J mouse
- MOR
μ-opioid receptor
- MuKO
MOR knockout mouse
- Chr
chromosome
- cM
centiMorgan
- SNP
single nucleotide polymorphism
- PCR
polymerase chain reaction
- RFLP
restriction fragment length polymorphism
- Mbp
Million base pairs
- SEM
standard error of the mean
- HSD
Honestly Significant Difference
Footnotes
Publisher's Disclaimer: This is a PDF file of an unedited manuscript that has been accepted for publication. As a service to our customers we are providing this early version of the manuscript. The manuscript will undergo copyediting, typesetting, and review of the resulting proof before it is published in its final citable form. Please note that during the production process errors may be discovered which could affect the content, and all legal disclaimers that apply to the journal pertain.
References
- Baumgartner A, Pinna G, Hiedra L, Bauer F, Wolf J, Eravci M, Prengel H, Brödel O, Schmidt G, Meinhold H. Effects of acute administration of ethanol and the mu-opiate agonist etonitazene on thyroid hormone metabolism in rat brain. Psychopharmacology (Berl) 1998;135:63–69. doi: 10.1007/s002130050486. [DOI] [PubMed] [Google Scholar]
- Belknap JK. Physical dependence induced by the voluntary consumption of morphine in inbred mice. Pharmacol. Biochem. Behav. 1990;35:311–315. doi: 10.1016/0091-3057(90)90161-a. [DOI] [PubMed] [Google Scholar]
- Belknap JK, Crabbe JC, Riggan J, O'Toole LA. Voluntary consumption of morphine in 15 inbred mouse strains. Psychopharmacology (Berl) 1993;112:352–358. doi: 10.1007/BF02244932. [DOI] [PubMed] [Google Scholar]
- Belknap JK, Mogil JS, Helms ML, Richards SP, O'Toole LA, Bergeson SE, Buck KJ. Localization to chromosome 10 of a locus influencing morphine analgesia in crosses derived from C57BL/6 and DBA/2 strains. Life Sci. 1995;57:PL117–124. doi: 10.1016/0024-3205(95)02040-p. [DOI] [PubMed] [Google Scholar]
- Bergeson SE, Helms ML, O'Toole LA, Jarvis MW, Hain HS, Mogil JS, Belknap JK. Quantitative trait loci influencing morphine antinociception in four mapping populations. Mamm. Genome. 2001;12:546–553. doi: 10.1007/s003350020022. [DOI] [PubMed] [Google Scholar]
- Berrettini WH, Alexander R, Ferraro TN, Vogel WH. A study of oral morphine preference in inbred mouse strains. Psychiatr. Genet. 1994a;4:81–86. doi: 10.1097/00041444-199422000-00003. [DOI] [PubMed] [Google Scholar]
- Berrettini WH, Ferraro TN, Alexander RC, Buchberg AM, Vogel WH. Quantitative trait loci mapping of three loci controlling morphine preference using inbred mouse strains. Nat. Genet. 1994b;7:54–58. doi: 10.1038/ng0594-54. [DOI] [PubMed] [Google Scholar]
- Blizard DA, Kotlus B, Frank ME. Quantitative trait loci associated with short-term intake of sucrose, saccharin and quinine solutions in laboratory mice. Chem Senses. 1999;24(4):373–85. doi: 10.1093/chemse/24.4.373. [DOI] [PubMed] [Google Scholar]
- Cunningham CL, Niehus DR, Malott DH, Prather LK. Genetic differences in the rewarding and activating effects of morphine and ethanol. Psychopharmacology (Berl) 1992;107:385–393. doi: 10.1007/BF02245166. [DOI] [PubMed] [Google Scholar]
- Doyle GA, Furlong PJ, Schwebel CL, Smith GG, Lohoff FW, Buono RJ, Berrettini WH, Ferraro TN. Fine mapping of a major QTL influencing morphine preference in C57BL/6 and DBA/2 mice using congenic strains. Neuropsychopharmacology. 2008;33:2801–2809. doi: 10.1038/npp.2008.14. [DOI] [PubMed] [Google Scholar]
- Doyle GA, Sheng XR, Schwebel CL, Ferraro TN, Berrettini WH, Buono RJ. Identification and functional significance of polymorphisms in the mu-opioid receptor gene (Oprm) promoter of C57BL/6 and DBA/2 mice. Neurosci. Res. 2006;55:244–254. doi: 10.1016/j.neures.2006.03.005. [DOI] [PubMed] [Google Scholar]
- Drgonova J, Zimonjic DB, Hall FS, Uhl GR. Effect of KEPI (Ppp1r14c) deletion on morphine analgesia and tolerance in mice of different genetic backgrounds: when a knockout is near a relevant quantitative trait locus. Neuroscience. 2010;165:882–895. doi: 10.1016/j.neuroscience.2009.10.007. [DOI] [PMC free article] [PubMed] [Google Scholar]
- Elmer GI, Pieper JO, Hamilton LR, Wise RA. Qualitative differences between C57BL/6J and DBA/2J mice in morphine potentiation of brain stimulation reward and intravenous self-administration. Psychopharmacology (Berl) 2010;208:309–321. doi: 10.1007/s00213-009-1732-z. [DOI] [PMC free article] [PubMed] [Google Scholar]
- Ferraro TN, Golden GT, Smith GG, Martin JF, Schwebel CL, Doyle GA, Buono RJ, Berrettini WH. Confirmation of a major QTL influencing oral morphine intake in C57 and DBA mice using reciprocal congenic strains. Neuropsychopharmacology. 2005;30:742–746. doi: 10.1038/sj.npp.1300592. [DOI] [PubMed] [Google Scholar]
- Frigeni V, Bruno F, Carenzi A, Racagni G. Difference in the development of tolerance to morphine and D-ALA2-methionine-enkephalin in C57 BL/6J and DBA/2J mice. Life Sci. 1981;28:729–736. doi: 10.1016/0024-3205(81)90154-5. [DOI] [PubMed] [Google Scholar]
- Garzón J, Rodríguez-Muñoz M, Sánchez-Blázquez P. Morphine alters the selective association between mu-opioid receptors and specific RGS proteins in mouse periaqueductal gray matter. Neuropharmacology. 2005a;48:853–868. doi: 10.1016/j.neuropharm.2005.01.004. [DOI] [PubMed] [Google Scholar]
- Garzón J, Rodríguez-Muñoz M, López-Fando A, Sánchez-Blázquez P. The RGSZ2 protein exists in a complex with mu-opioid receptors and regulates the desensitizing capacity of Gz proteins. Neuropsychopharmacology. 2005b;30:1632–1648. doi: 10.1038/sj.npp.1300726. [DOI] [PubMed] [Google Scholar]
- Gaupale TC, Mathi AA, Ravikumar A, Bhargava SY. Localization and enzyme activity of iodotyrosine dehalogenase 1 during metamorphosis of frog Microhyla ornata. Ann N Y Acad Sci. 2009;1163:402–406. doi: 10.1111/j.1749-6632.2008.03652.x. [DOI] [PubMed] [Google Scholar]
- Giros B, Pohl M, Rochelle JM, Seldin MF. Chromosomal localization of opioid peptide and receptor genes in the mouse. Life Sci. 1995;56:PL369–375. doi: 10.1016/0024-3205(95)00119-q. [DOI] [PubMed] [Google Scholar]
- Goodchild MA, Brownlee G. The effects of two inhibitors of catecholamine synthesis on the content of noradrenaline and dopamine of the rat brain. Br J Pharmacol. 1969;36:203P–204P. [PMC free article] [PubMed] [Google Scholar]
- Hendry IA, Kelleher KL, Bartlett SE, Leck KJ, Reynolds AJ, Heydon K, Mellick A, Megirian D, Matthaei KI. Hypertolerance to morphine in G(z alpha)-deficient mice. Brain Res. 2000;870:10–19. doi: 10.1016/s0006-8993(00)02387-8. [DOI] [PubMed] [Google Scholar]
- Horowitz GP, Whitney G, Smith JC, Stephan FK. Morphine ingestion: genetic control in mice. Psychopharmacology (Berl) 1977;52:119–122. doi: 10.1007/BF00439097. [DOI] [PubMed] [Google Scholar]
- Kest B, Palmese CA, Hopkins E, Adler M, Juni A, Mogil JS. Naloxone-precipitated withdrawal jumping in 11 inbred mouse strains: evidence for common genetic mechanisms in acute and chronic morphine physical dependence. Neuroscience. 2002;115:463–469. doi: 10.1016/s0306-4522(02)00458-x. [DOI] [PubMed] [Google Scholar]
- Karobath M. Catecholamines and the hydroxylation of tyrosine in synaptosomes isolated from rat brain. Proc Natl Acad Sci U S A. 1971;68:2370–2373. doi: 10.1073/pnas.68.10.2370. [DOI] [PMC free article] [PubMed] [Google Scholar]
- Kozak CA, Filie J, Adamson MC, Chen Y, Yu L. Murine chromosomal location of the mu and kappa opioid receptor genes. Genomics. 1994;21:659–661. doi: 10.1006/geno.1994.1331. [DOI] [PubMed] [Google Scholar]
- Liu QR, Zhang PW, Zhen Q, Walther D, Wang XB, Uhl GR. KEPI, a PKC-dependent protein phosphatase 1 inhibitor regulated by morphine. J. Biol. Chem. 2002;277:13312–13320. doi: 10.1074/jbc.M107558200. [DOI] [PubMed] [Google Scholar]
- Livak KJ, Schmittgen TD. Analysis of relative gene expression data using real-time quantitative PCR and the 2(-Delta Delta C(T)) Method. Methods. 2001;25:402–408. doi: 10.1006/meth.2001.1262. [DOI] [PubMed] [Google Scholar]
- Loh HH, Liu HC, Cavalli A, Yang W, Chen YF, Wei LN. mu Opioid receptor knockout in mice: effects on ligand-induced analgesia and morphine lethality. Brain Res. Mol. Brain Res. 1998;54:321–326. doi: 10.1016/s0169-328x(97)00353-7. [DOI] [PubMed] [Google Scholar]
- Lush IE. The genetics of tasting in mice. III. Quinine. Genet Res. 1984;44(2):151–60. doi: 10.1017/s0016672300026355. [DOI] [PubMed] [Google Scholar]
- Mácsai M, Szabó G, Telegdy G. Vasoactive intestinal polypeptide induces analgesia and impairs the antinociceptive effect of morphine in mice. Neuropeptides. 1998;32:557–562. doi: 10.1016/s0143-4179(98)90085-3. [DOI] [PubMed] [Google Scholar]
- Matthes HW, Maldonado R, Simonin F, Valverde O, Slowe S, Kitchen I, Befort K, Dierich A, Le Meur M, Dollé P, Tzavara E, Hanoune J, Roques BP, Kieffer BL. Loss of morphine-induced analgesia, reward effect and withdrawal symptoms in mice lacking the mu-opioid-receptor gene. Nature. 1996;383:819–823. doi: 10.1038/383819a0. [DOI] [PubMed] [Google Scholar]
- Muraki T, Kato R. Genetic analysis of hypothermia induced by morphine in two strains of inbred mice. Pharmacol Biochem. Behav. 1987;27:87–91. doi: 10.1016/0091-3057(87)90481-3. [DOI] [PubMed] [Google Scholar]
- Nelson TM, Munger SD, Boughter JD., Jr Haplotypes at the Tas2r locus on distal chromosome 6 vary with quinine taste sensitivity in inbred mice. BMC Genet. 2005;6:32–44. doi: 10.1186/1471-2156-6-32. [DOI] [PMC free article] [PubMed] [Google Scholar]
- Newrzella D, Pahlavan PS, Krüger C, Boehm C, Sorgenfrei O, Schröck H, Eisenhardt G, Bischoff N, Vogt G, Wafzig O, Rossner M, Maurer MH, Hiemisch H, Bach A, Kuschinsky W, Schneider A. The functional genome of CA1 and CA3 neurons under native conditions and in response to ischemia. BMC Genomics. 2007;8:370–387. doi: 10.1186/1471-2164-8-370. [DOI] [PMC free article] [PubMed] [Google Scholar]
- Orsini C, Bonito-Oliva A, Conversi D, Cabib S. Susceptibility to conditioned place preference induced by addictive drugs in mice of the C57BL/6 and DBA/2 inbred strains. Psychopharmacology (Berl) 2005;181:327–336. doi: 10.1007/s00213-005-2259-6. [DOI] [PubMed] [Google Scholar]
- Pan YX. Diversity and complexity of the mu opioid receptor gene: alternative pre-mRNA splicing and promoters. DNA Cell. Biol. 2005;24:736–750. doi: 10.1089/dna.2005.24.736. [DOI] [PubMed] [Google Scholar]
- Pasternak GW. The pharmacology of mu analgesics: from patients to genes. Neuroscientist. 2001;7:220–231. doi: 10.1177/107385840100700307. [DOI] [PubMed] [Google Scholar]
- Rokita SE, Adler JM, McTamney PM, Watson JA., Jr Efficient use and recycling of the micronutrient iodide in mammals. Biochimie. 2010;92:1227–1235. doi: 10.1016/j.biochi.2010.02.013. [DOI] [PMC free article] [PubMed] [Google Scholar]
- Schuller AG, King MA, Zhang J, Bolan E, Pan YX, Morgan DJ, Chang A, Czick ME, Unterwald EM, Pasternak GW, Pintar JE. Retention of heroin and morphine-6 beta-glucuronide analgesia in a new line of mice lacking exon 1 of MOR-1. Nat. Neurosci. 1999;2:151–156. doi: 10.1038/5706. [DOI] [PubMed] [Google Scholar]
- Sora I, Takahashi N, Funada M, Ujike H, Revay RS, Donovan DM, Miner LL, Uhl GR. Opiate receptor knockout mice define mu receptor roles in endogenous nociceptive responses and morphine-induced analgesia. Proc. Natl. Acad. Sci. U.S.A. 1997;94:1544–1549. doi: 10.1073/pnas.94.4.1544. [DOI] [PMC free article] [PubMed] [Google Scholar]
- Suzuki T, Otani K, Misawa M. Differential sensitivity to physical dependence on morphine and codeine in three inbred strains of mice. Jpn. J. Pharmacol. 1991;57:455–462. doi: 10.1254/jjp.57.455. [DOI] [PubMed] [Google Scholar]
- Szabó G, Mácsai M, Schek E, Telegdy G. The effect of vasoactive intestinal polypeptide and pituitary adenylate cyclase activating polypeptide on tolerance to morphine and alcohol in mice. Ann. N. Y. Acad. Sci. 1998;865:566–569. doi: 10.1111/j.1749-6632.1998.tb11238.x. [DOI] [PubMed] [Google Scholar]
- Tapocik JD, Letwin N, Mayo CL, Frank B, Luu T, Achinike O, House C, Williams R, Elmer GI, Lee NH. Identification of candidate genes and gene networks specifically associated with analgesic tolerance to morphine. J Neurosci. 2009;29:5295–5307. doi: 10.1523/JNEUROSCI.4020-08.2009. [DOI] [PMC free article] [PubMed] [Google Scholar]
- Tian M, Broxmeyer HE, Fan Y, Lai Z, Zhang S, Aronica S, Cooper S, Bigsby RM, Steinmetz R, Engle SJ, Mestek A, Pollock JD, Lehman MN, Jansen HT, Ying M, Stambrook PJ, Tischfield JA, Yu L. Altered hematopoiesis, behavior, and sexual function in mu opioid receptor-deficient mice. J. Exp. Med. 1997;185:1517–1522. doi: 10.1084/jem.185.8.1517. [DOI] [PMC free article] [PubMed] [Google Scholar]
- Weinert H, Masui H, Radichevich I, Werner SC. Materials indistinguishable from iodotyrosines in normal human serum and human serum albumin. J Clin Invest. 1967;46:1264–1274. doi: 10.1172/JCI105619. [DOI] [PMC free article] [PubMed] [Google Scholar]
- Wellby ML, O'Halloran MW. The iodotyrosine content of normal human serum. Biochem J. 1969;112:543–544. doi: 10.1042/bj1120543. [DOI] [PMC free article] [PubMed] [Google Scholar]
- Wicker-Thomas C, Hamann M. Interaction of dopamine, female pheromones, locomotion and sex behavior in Drosophila melanogaster. J Insect Physiol. 2008;54:1423–1431. doi: 10.1016/j.jinsphys.2008.08.005. [DOI] [PubMed] [Google Scholar]
- Yang J, Wu J, Kowalska MA, Dalvi A, Prevost N, O'Brien PJ, Manning D, Poncz M, Lucki I, Blendy JA, Brass LF. Loss of signaling through the G protein, Gz, results in abnormal platelet activation and altered responses to psychoactive drugs. Proc Natl Acad Sci U S A. 2000;97:9984–9989. doi: 10.1073/pnas.180194597. [DOI] [PMC free article] [PubMed] [Google Scholar]
- Zhang H, Wang F, Kranzler HR, Anton RF, Gelernter J. Variation in regulator of G-protein signaling 17 gene (RGS17) is associated with multiple substance dependence diagnoses. Behav Brain Funct. 2012;8:23–33. doi: 10.1186/1744-9081-8-23. [DOI] [PMC free article] [PubMed] [Google Scholar]