Figure 3.
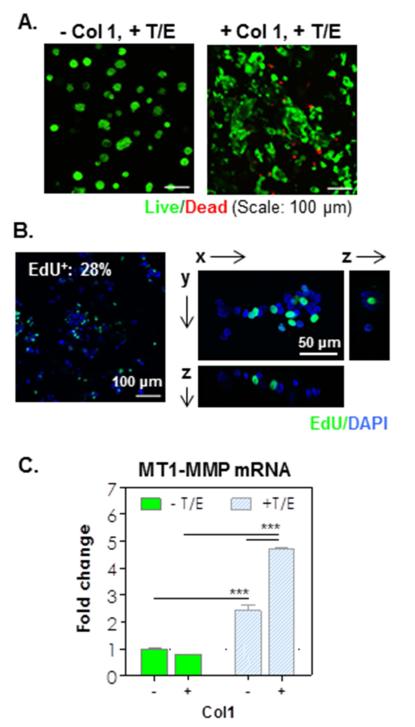
(A) Live/dead images of encapsulated cells in hydrogel formed without/with Col1 and in presence of cytokines (TGF-β1/EGF) 10-day post-encapsulation (Z-stack: 100 μm, live: green, dead: red). (B) Click-IT EdU staining images (left: Z-stack; right: single slice; EdU+: green, DAPI: blue). (C) MT1-MMP mRNA expression in the encapsulated cells (1-fold: mRNA levels in cells cultured in 2D. *** p<0.0001).

