Abstract
The frequency extent over which fine structure is coded in the auditory nerve has been physiologically characterized in laboratory animals but is unknown in humans. Knowledge of the upper frequency limit in humans would inform the debate regarding the role of fine structure in human hearing. Of the presently available techniques, only the recording of mass neural potentials offers the promise to provide a physiological estimate of neural phase locking in humans. A challenge is to disambiguate neural phase locking from the receptor potentials. We studied mass potentials recorded on the cochlea and auditory nerve of cat and used several experimental manipulations to isolate the neural contribution to these potentials. We find a surprisingly large neural contribution in the signal recorded on the cochlear round window, and this contribution is in many aspects similar to the potential measured on the auditory nerve. The results suggest that recording of mass potentials through the middle ear is a promising approach to examine neural phase locking in humans.
Keywords: phase locking, neurophonic, microphonic, auditory nerve, round window, temporal fine structure
INTRODUCTION
Stimulus-related neural synchronization is a fundamental property generated in the mammalian cochlea. It refers to the ability of neurons to represent temporal aspects of the stimulus waveform. In response to a low-frequency tone, the probability of discharge is maximal at a preferred phase angle in the cycle of the tone. This type of neural synchronization to the fine structure of the stimulus waveform is called phase locking (Galambos and Davis 1943; Tasaki 1954; Kiang et al. 1965; Rose et al. 1967) and has been proposed to be involved in, or even to be critical to, many attributes of normal and impaired auditory perception (reviewed in Moore 2008). Phase locking to tones has been most extensively studied in single neurons of peripheral neural structures in cats (e.g., Bourk 1976; Johnson 1980; Rhode and Smith 1985; Blackburn and Sachs 1989; Joris et al. 1994) and is usually quantified with the vector strength metric (Goldberg and Brown 1969). The technique used in animals to quantify phase locking in single neurons cannot be applied in humans, because it requires intracranial access and invasive penetrating microelectrodes.
Mass potentials measured with surface electrodes on the auditory nerve (AN), called the auditory nerve neurophonic (AN-NP), are thought to reflect synchronous activity of AN fibers (Snyder and Schreiner 1984b). Such potentials provide a possible means to estimate and compare phase locking across species. Measuring such potentials on human AN still requires intracranial access, but this is possible during neurosurgical procedures (Moller and Jho 1989) and such recordings therefore provides a possible avenue to study phase locking in humans. Studies in animals (Henry 1995; He et al. 2012; Lichtenhan et al. 2013) reported the presence of a phase-locked neural component in the electrical response at the cochlear round window (RW); we refer to this as the round-window neurophonic (RW-NP). It is possible to make recordings from the human RW using a minimally invasive approach through the middle ear (Eggermont 1976). Thus, if present in humans, the RW-NP would provide an alternative means to physiologically assess human neural phase locking. However, the potential at the RW is dominated by an ensemble potential that originates from hair cells, which is called the cochlear microphonic (CM). Classic studies of CM established that this receptor potential is generated by hair cell transduction currents (Dallos 1973). The extent to which AC potentials recorded at the RW reflect a contribution from the hair cells (RW-CM) or from neural phase locking (RW-NP) has not been characterized. The goal of the experiments described here was to assess the suitability of mass potentials recorded at the AN and RW for studying phase locking.
The nerve shows two properties that may allow disambiguation of its contributions, relative to the receptor potentials, to the potential measured at the RW: rectification and adaptation. Neural rectification introduces higher harmonics, which are reported to be very small in the CM at low stimulus levels. The even harmonics, dominated by the second harmonic, are easily extractable and have recently been proposed (Lichtenhan et al. 2013) as an audiological tool at low frequencies. The other property, neural adaptation, causes temporary suppression of neural activity in the presence of a sufficiently strong preceding signal, i.e., forward masking. Forward masking has been demonstrated for the auditory neurophonic at the AN (Snyder and Schreiner 1985) and for the second harmonic at the RW (Henry 1995). Cycle-to-cycle adaptation is absent in receptor potentials (Palmer and Russell 1986) but is present in AN fibers and is thought to be synaptic in origin (Eatock 2000).
Here, we develop a method, in a species for which phase locking at the level of single AN fibers is well characterized, to study neural phase locking with RW measurements. A combination of forward masking with stimulus polarity reversals was used to quantify RW-NP and RW-CM in cats. Furthermore, simultaneous recordings at the AN and administration of TTX at the RW were used to validate the method. For reasons of space, we restrict our characterization and method here to a single frequency (1 kHz) and probe level (50–55 dB SPL).
METHODS
Surgical preparation
The experiments were conducted in three adult cats. All procedures were approved by the KU Leuven Ethics Committee for Animal Experiments and were in accordance with the National Institutes of Health Guide for the Care and Use of Laboratory Animals. Animals were briefly examined for clear external and middle ears. Cats were anesthetized with a mixture of ketamine (20 mg/kg) and ace promazine (0.2 mg/kg) administered intramuscularly. A venous cannula was then placed to infuse lactated Ringer’s solution and sodium pentobarbital to maintain a deep state of anesthesia. A cannula was inserted into the trachea. During the measurements, the animals were kept warm with a homeothermic blanket (Harvard). The experiments were conducted in a double-walled soundproof and faradized room (Industrial Acoustics Company).
One of the pinnas was surgically removed, and the auditory bulla was exposed and opened. Through the opening in the bulla a silver, Teflon-insulated wire with ball electrode was inserted and placed at the RW. The electrode lead was glued to the bone, and the bulla opening was closed again with ear impression compound (Microsonic). Two silver wire electrodes were threaded through the skin: a reference electrode at the nape of the neck and a ground electrode near the contralateral bulla. The AN was exposed via a posterior fossa approach, involving the removal of a small area of the cerebellum. The AN measurements were performed with insulated platinum/iridium (90/10) ball electrodes mounted on a custom-designed electrode holder for differential nerve recordings.
In one experiment, we applied 4 μL (10 mM) tetrodotoxin (TTX; Gentaur; powder dissolved in artificial CSF with citrate buffer, pH 4.8) in the niche of the RW to block neural spiking in the cochlea. During the diffusion of TTX through the RW and cochlea, we monitored the compound action potential (CAP) responses over a long time period before starting the measurement session.
Stimulus generation
Stimuli were generated with custom software and a digital sound system (system 2, sample rate, 125 kHz/channel; Tucker-Davis Technologies) consisting of a digital-to-analog converter (PD1), a digitally controlled attenuator (PA5), a headphone driver (HB7), and an electromagnetically shielded acoustic transducer (20 Hz–50 kHz; dynamic electro-acoustic transducer, Radio Shack). The transducer was connected with plastic tubing to a custom earpiece coupler. The coupler was fit in the transversely cut ear canal. The acoustic system was calibrated in situ, through the custom coupler and within a few mm from the eardrum, with a calibrated probe-microphone (Brüel & Kjær, type 4192, 0.5-in. condenser microphone, and conditioning amplifier Nexus 2690).
Signal recording
The potentials were differentially measured with battery operated low-noise preamplifiers (Signal Recovery, Model 5115 and/or Stanford Research, SR560) located in the shielded room.
Measurements at the AN were performed with differential silver ball electrodes placed longitudinally on the nerve, with the active electrode placed closest to the internal auditory meatus. The RW measurements were performed between the active electrode at the RW and the reference electrode in the nape of the neck. The grounds of the preamplifiers were connected to the electrode at the contralateral mastoid. The signals were filtered (30 Hz–30 kHz; cutoff slopes, 12 dB/oct.) and further amplified with an external amplifier (Dagan, EX4-400) to a total gain of ×10,000. The RW mass potentials were simultaneously recorded with those at the AN. All of the relevant signals including the electrical responses, the stimulus waveform, and the synchronization pulses at the start of every probe were visualized on an oscilloscope (LeCroy, WaveSurfer 24Xs); moreover, the responses were sampled with an ADC (TDT, RX8, ~100 kHz/channel, max. SNR 96 dB) and stored on a disk for further signal processing. To increase the signal-to-noise ratio (SNR) of the response, the presentations (positive and negative polarity) were repeated at least 100 times. The responses shown in this study are all averaged.
Stimulus paradigm
The paradigm was designed with an emphasis on the quantitative extraction and verification of the neurophonic. Considerable attention was paid to the cancelation of the RW-CM and to the removal of artifacts. To achieve this goal, two specific properties were exploited: the linearity of the CM vs. the nonlinearity of the neurophonic and the temporary suppression of neural activity in nerve fibers by forward masking.
The paradigm used in this study is illustrated in Figure 1 by an example of the first half of the stimulus (Fig. 1A) with corresponding averaged electrical responses at the AN and RW (Fig. 1B, C). The second half of the stimulus is not shown: it is equal to the first half but with opposite polarity. The half stimulus shown in Figure 1 consists of three segments. The first segment (1) (1–151 ms) contains only the probe; the second segment (2) (151–403 ms) contains the masker followed by the probe; and the third segment (3) (403–707 ms) contains only the masker without the probe. The probes were pure tones of 1 kHz with durations of 100 or 150 ms, depending on the experiment. The motivation for choosing this frequency, partially based on pilot experiments, is that (1) it is below the steep decline in vector strength of single AN fibers (Johnson 1980); (2) it shows a large S/N in the neurophonic and the CM are large; and (3) the phases of neurophonic and CM clear differ at this frequency, which enhance the separating effect of masking. The maskers were pure tones with a frequency equal to the probe frequency (fP) or (as shown in Fig. 1) were fixed broadband maskers (typically 50–8,000 Hz) with a fixed duration of 100 ms. Note that the masker levels mentioned in this study are the levels over the total noise bandwidth. The interval between the masker and the probe was 1 ms and that between different stimuli at least 50 ms. Segment (3) had a larger stimulus-free period, to allow full recovery before presentation of the probe. The artifact-free and fully recovered part of this stimulus-free period was used for the determination of the noise floor (see “RESULTS,” “TTX,” “First-Harmonic Components”). To reduce the spectral splatter at the stimulus transients, the probe and masker were gated with a 1-ms raised cosine. The levels were determined in a preliminary experiment. The probe level (50 or 55 dB SPL) was chosen such that the SNR of the probe and the numbers of averages were adequate and realistic, and the masker level (70 dB SPL) was chosen such that the probe response was properly masked. Except when stated otherwise, the probe and masker levels within an experiment were kept constant.
FIG. 1.
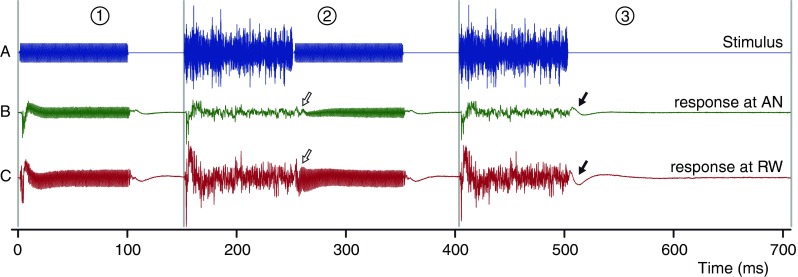
An illustration of the paradigm showing three of the six segments of the stimulus (A) with corresponding averaged responses at the AN (B) and RW (C). 1, The probe only; 2, the probe preceded by a masker; and 3, the masker only. The probe is a tone of 1 kHz, and the masker is a broadband noise. The arrows indicate the offset response to the masker. These three segments are followed by three segments (not shown) that are identical but opposite in polarity.
Analysis
The responses of the different segments were combined and processed to obtain the required signals. As can be seen in Figure 1B, C (segment 3), there is an offset response to the masker (filled arrows, 503–540 ms). This component is also present in the response to segment 2 where it combines with the response to the probe (open arrows in Fig. 1B, C). Therefore, the first operation always performed was the removal of the masker’s trailing offset response, by subtracting the response after the masker in segment 3 (503–653 ms) from the corresponding part of the response in segment 2. In the rest of our analysis, we only make use of these corrected responses and refer to these as the masked responses. The responses to the probe only (segment 1 in Fig. 1) are called the probe responses.
As mentioned, Figure 1 shows only half of the stimulus presented: three segments identical to that half but inverted in polarity immediately followed, from which again masked responses and probe responses were obtained. Thus, one stimulus sequence resulted in two pairs of responses: probe and masked responses to one polarity and probe and masked responses to the opposite polarity. These are illustrated in Figure 2A(a (a pair of probe responses to stimuli of opposite polarity), b (a pair of masked responses to stimuli of opposite polarity)). From these pairs of responses, we derived a variety of signals and magnitude envelopes. The full significance of these derived signals will become clear in the “RESULTS.” Except if mentioned otherwise, the magnitudes are presented as a peak voltage.
FIG. 2.
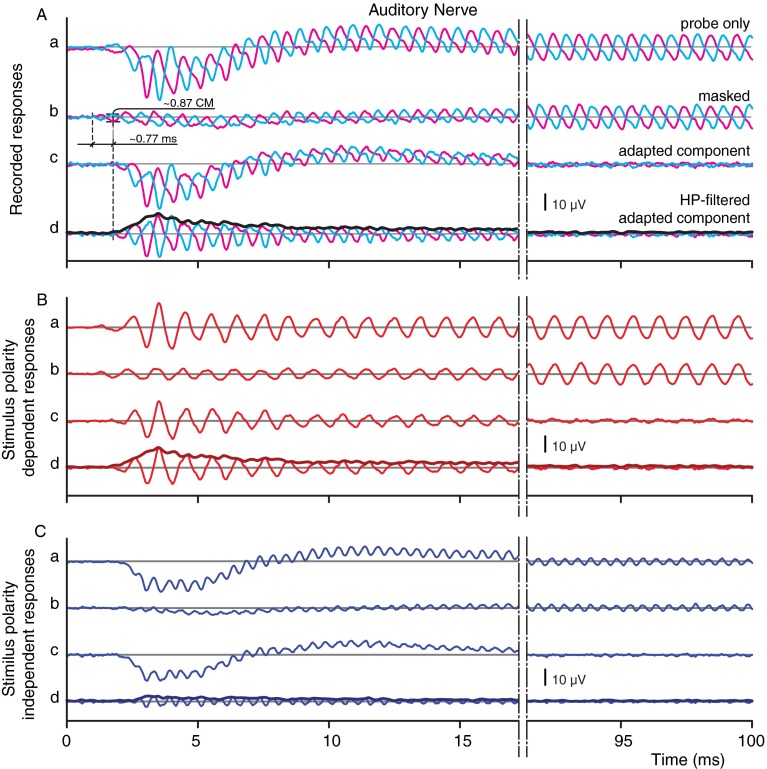
Example of stimulus-evoked response averages (n = 128) recorded on the AN. A a Pair of raw probe responses for two stimulus polarities. A b Same as (A a) but with a preceding tonal masker. A c Difference between signals A a, b The adapted component. A d Same as (A c) but with the CAP removed by high-pass filtering. B a–d Difference of the responses shown in (A). C a–d Sum of the responses shown in (A a–d). Probe parameters were level = 50 dB SPL; frequency = 1 kHz; and duration of 100 ms. Masker parameters were level = 70 dB SPL and frequency = 1 kHz. For the final trace in each panel (A d, B d, C d), the envelope is shown as the thick line.
Steady-state amplitudes
For some signals, we measured steady-state amplitudes: these were measured over the stable and transient-free period of the response (Fig. 2 to the right of the dashed–dotted line) using a fast Fourier transformation. The steady-state amplitude was determined as the amplitude corresponding to the power calculated as the sum of the spectral power within ±5 % of the probe frequency. For paired signals (Fig. 2A), the spectrum was averaged over both polarities.
Envelopes
To obtain the time course of the instantaneous magnitude of signals (i.e., decaying neurophonic, see later in “RESULTS”), we used the absolute value of the Hilbert transformation. The resulting envelopes were denoised using wavelets (MATLAB, wden, settings: soft heuristic SURE thresholding with decomposition at level 4 by symlet8 wavelet) and are shown as thick lines (e.g., Fig. 2A(d), B(d), C(d)). For paired signals of opposite stimulus polarities, the envelope was obtained from the magnitude corresponding to the average power of the envelopes of both polarities.
Gabor transform
For the extraction of the time course of the “instantaneous” magnitudes of the first- and second-harmonic components in the signals, we used a Gabor transform. The Gabor transform is a special case of a short-time Fourier transform (STFT; MATLAB, spectrogram) with a Gaussian time window. In this study, the Gaussian window was truncated at α = 2.5 and had a fixed defined window length of six cycles of the probe frequency. The STFT window was moved in steps of 100 μs with an overlap between 75 and 98 %. The size of the FFT was chosen such that the frequency spacing between the spectral components was fixed to 2.5 % of the desired frequency. For every time step, the center frequency (max. power) was searched within a spectral range of ±10 % around the desired frequency (here, 1 kHz). The magnitude as a function of time was obtained as the magnitude corresponding to the power calculated as the sum of the power of the spectral components within a range of ±20 % on the center frequency (=98.9 % spectral coverage of the desired magnitude).
Mean background noise and noise floor
To assess the time-evolving magnitudes of the different signals in the final “RESULTS,” “TTX,” two baselines were quantified. The first baseline used in this study is the “noise floor,” which is defined as the (freak-free) peak magnitude of the time-evolving background noise in the corresponding processed averaged recording. This noise floor is basically the threshold above which neurophonic is considered to be significant. The second baseline, here called the “background noise,” is calculated similarly as the noise floor, but as the mean value of the time-evolving magnitudes of the background noise. The time-evolving background noise in the averaged recording was estimated from the artifact-free part of segment 3 (e.g., Fig. 1, 540–706 ms). This calculation involved, when possible, the response combinations and operations (e.g., subtraction, STFT, etc.) that were also used to quantify the corresponding responses. In case not all operations could be performed, the noise was compensated with a factor corresponding to these operations assuming uncorrelated noise. For example, the removal of the masker’s trailing offset response (cf. arrows Fig. 1) involves a subtraction which for the noise estimate was replaced by a multiplication with √2, which is equal to the increase in magnitude after adding/subtracting two uncorrelated noises. To avoid a potential overestimation of the noise floors due to sporadic freaks in the background noise, noise floors were not simply taken as the absolute maximum magnitude of the time-evolving background noise but instead calculated as the sum of the mean value of the processed noise with the 99.75th percentiles (obtained with spline interpolation) of the noise distribution around this mean value.
RESULTS
In this study, we develop a method that measures the neural contribution to peripherally measured mass potentials and which is potentially applicable to humans. First, we illustrate the responses measured on the AN and show how we process them to yield a signal dominated by neural activity. Next, a number of candidate measures are examined and discussed. Third, the method is applied to responses measured at the RW. Fourth, the influence of masker level on masking is investigated. Finally, the method is verified using TTX.
Auditory nerve recordings
A typical result of the averaged probe responses and their processed versions at the AN for a probe frequency of 1 kHz is shown in Figure 2. The figure is divided into three panels. Figure 2A contains the paired raw signals (a, b) and some derived signals (c, d). Figure 2B, C shows transformed signals obtained by taking the difference and sum, respectively, of the pairs of responses shown in Figure 2A.
Raw responses
The paired signals in Figure 2A(a) are the (averaged) responses to probe tones (e.g., as shown in Fig. 1, segment 1). A pair consists of responses to stimuli with opposite polarity: to positive polarity in magenta color, to negative polarity in cyan. Both responses show two distinct features, a “slow-wave” and an alternating component. The slow wave, here consisting of a negative deflection followed by a shallow positive deflection, is the CAP, which is the weighted summed extracellular response of synchronized single AN fibers at the onset of the stimulus (Goldstein and Kiang 1958; Kiang et al. 1976; Antoli-Candela and Kiang 1978). The CAP shows a high degree of independence of stimulus polarity, while the other distinct feature, the alternating component, shows strong phase locking to the polarity-alternated stimuli. This difference is exploited to separate these two response components. Within a response pair, the two responses were subtracted or added. Subtraction results in stimulus polarity-dependent responses (Fig. 2B). For example, the probe response to positive stimulus polarity (Fig. 2A(a), magenta) was subtracted from the probe response to negative polarity (Fig. 2A(a), cyan), and this difference was halved (Fig. 2B(a)). Similarly, a halved difference was obtained for the masked responses (Fig. 2B(b)). Summation of the response pair results in stimulus polarity-independent responses. Thus, Figure 2C(a) shows the sum of the two probe responses, and Figure 2C(b) shows the sum of the two masked responses. Note that if signal components in the two responses of opposite polarity have a phase relationships other than 0 or 180 °, then these signal components are vectorially decomposed into two orthogonal components, which end up in the polarity-independent and polarity-dependent responses.
Similar to Figure 2A(a), the summed, polarity-independent part of the raw response (Fig. 2C(a)) shows two components. In addition to the CAP, an alternating component is present at double the frequency of the probe. It is generally thought that this component is dominated by the second harmonic of the AN-NP, caused by the rectifying effect of increased probability of firing over half of the stimulus cycle, which is not counterbalanced by an equal decrease in firing during the other half cycle. Indeed, at low levels the CM is remarkably linear without significant second or higher harmonics. The reason why the second harmonic and the other even harmonics occur in the summed, polarity-independent response is because their cycles are identical during the positive and negative half cycle of the fundamental component; therefore, these harmonics are summed while the odd harmonics are canceled. The opposite is also true; the odd harmonics are retained in the polarity-dependent response after subtraction of the paired responses (Fig. 2B(a)) while the even harmonics are canceled.
The subtracted, polarity-dependent probe response (Fig. 2B(a)) is clearly dominated by an alternating component at the fundamental frequency (first-harmonic component). The CAP and even harmonics are, as expected, not visibly present anymore, which was spectrally verified (not shown). In contrast to the polarity-independent response, the dependent response is likely not entirely of neural origin, even though the recording electrode was placed on the AN: some stray CM might be present. To verify this, a forward masker was applied.
Masked responses
The paired signals in Figure 2A(b) are the responses to probe tones preceded by a tonal masker. The corresponding polarity-dependent and polarity-independent masked responses were calculated and are shown in Figure 2B(b), C(b). The presence of a forward masker has a clear suppressing effect on the probe response: both the CAP (Fig. 2A(b), C(b)) and the alternating component (Fig. 2A(b), B(b)) are reduced. However, the reduction is temporary and the paired signals recover to their nonmasked magnitudes toward the end of the stimulus (90–100 ms). Comparison of probe and masked responses show that at least 85 % of the CAP (Fig. 2C(a vs. b)) and 75 % of the alternating component (Fig. 2B(a vs. b)) are masked. The observation that forward masking is only partial, i.e., that there is still a remaining signal even at the beginning of the response (e.g., Fig. 2B(b)), may indicate that not all neural activity is suppressed by the preceding masker or that the response contains a nonadapting non-neural component such as for instance CM.
Adapted component
Ultimately, we want to examine the part of the response that can be masked and which is taken to be purely neural. This part of the response is obtained by subtracting the masked response (Fig. 2A(b), B(b), C(b)) from the probe response (Fig. 2A(a), B(a), C(a)). The resulting signals are called adapted components (Fig. 2A(c), B(c), C(c)) and are characterized by a magnitude vanishing in time, indicating full recovery of masking. The adapted components contain besides neural phase-locked contributions (Fig. 2A(c), B(c), C(c)) also nonphase-locked neural contributions such as the CAP, which is particularly noticeable in Figure 2A(c), C(c). As we are only interested in the neural phase-locked contribution, we removed the CAP and other not relevant components with a noncausal phase preserving high-pass filter (order, >200; FIR filter: filtfilt, fir1, and Chebyshev, MATLAB). The cutoff frequency of the filter applied to the response pairs of Figure 2A(c), and their difference in Figure 2B(c) was 0.5 fP, and it was fP for their sum (Fig. 2C(c)), which has no fundamental component. The signals after filtering are shown at the bottom of each panel (Fig. 2A(d), B(d), C(d)). In the remainder of this section, we will argue that these signals represent a pure neural phase-locked contribution to the neurophonic, we refer to it as its decaying part: AN-dNP.
To trace the time course of the amplitude of the AN-dNP signals, we used the Hilbert transformation (see “METHODS”) and obtain the envelopes indicated by the thick lines (e.g., Fig. 2A(d), B(d), C(d)). These three envelopes are the signals of interest in most of the sections that follow.
The course of the AN-dNP envelopes depicts three distinct regions: a region near the onset where the envelope has a steep rising slope, followed by a region with a steep declining slope, which thereafter merges into the last region with a less steep slope. Qualitatively, the envelopes have the typical appearance of a high-pass filtered (DC-free) post-stimulus time histogram of primary AN fibers, but then with an additional exponential decay as a result of forward masking. This similarity in shape, as well as the full recovery, suggests that the adapted component is at least dominated by neural contributions.
There is strong evidence for the presence of a non neural component in the recordings at the AN. There is a time lag between the adapted component (Fig. 2A(d)) and the masked response (Fig. 2A(b)), as illustrated by the dashed lines in Figure 2A. For the example shown, the onset of the masked response is visually estimated at 1 ms and the onset of the adapted component at 1.77, giving an estimated time lag of 0.77 ms (Fig. 4 also illustrates this point at a finer timescale). This is roughly compatible with a synaptic delay combined with some additional conduction delay between the synapse and the place of recording at the AN. The most obvious explanation for the time lag and the observation that masking is only partial and not complete, is that the raw responses are contaminated by stray currents from the cochlear receptors. Taken together, these results provide strong evidence that the maskable response, i.e., the AN-dNP, only consists of phase-locked neural contributions.
FIG. 4.
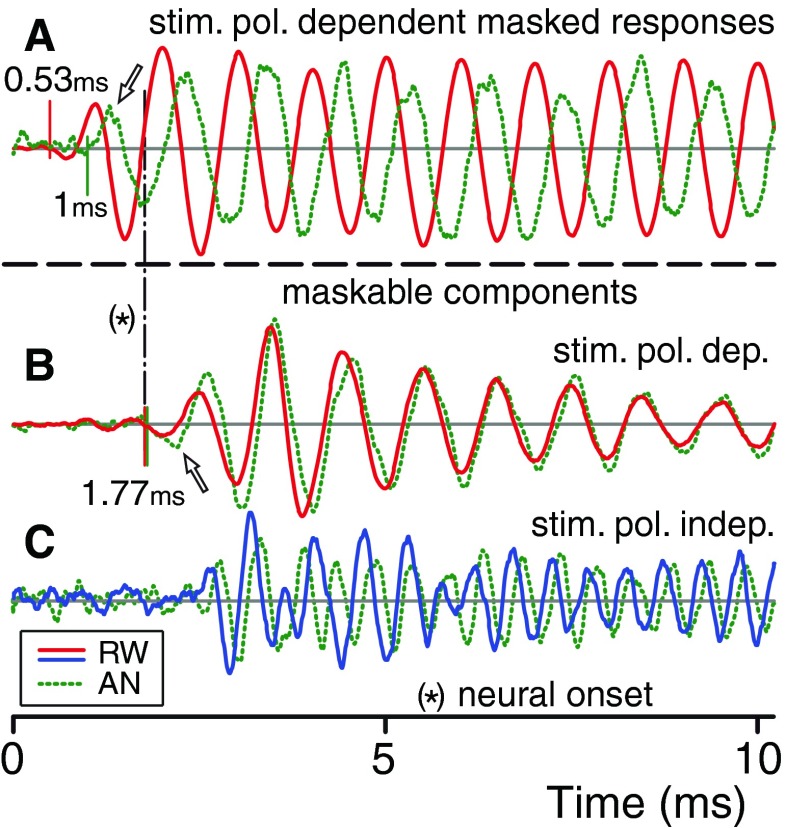
Comparison of the onset regions of responses recorded on the AN (green dotted lines) and RW (red and blue solid lines). A The stimulus polarity-dependent masked responses, which at onset reflect CM. B, C Adapted, i.e., neural, components: polarity-dependent (B) and independent (C). Corresponding onset values are indicated and accompanied by vertical lines. The amplitudes are individually and arbitrarily scaled; only the polarity-independent signals (C) have the same scale. The arrows indicate the first half cycle.
The presence of a stray current from the CM (AN-CM) in the response at the AN is not entirely unexpected. The AN in cat is relatively short and is embedded in conductive surroundings so that it is extremely difficult, if possible at all, to completely electrically isolate the AN from its surroundings. The time lag in the neural response provides a window to quantify the AN-CM. Applied to the 0.77-ms window in the example of Figure 2, the estimated AN-CM amplitude is ~2.6 μV. Further support for this interpretation is provided below (“RESULTS,” “Masker-Level Dependence,” and “TTX”).
Round-window recordings
In the previous section, we assessed the responses at the AN for a probe frequency of 1 kHz and found a suitable signal for estimating the neurophonic: the AN-dNP. As mentioned in the “INTRODUCTION,” we seek a method that is also applicable in humans, where recording from the AN is not possible except under restrictive neurosurgical conditions, but where recording from sites near the RW is possible. Therefore, we examined whether the method would be applicable to responses recorded at the RW.
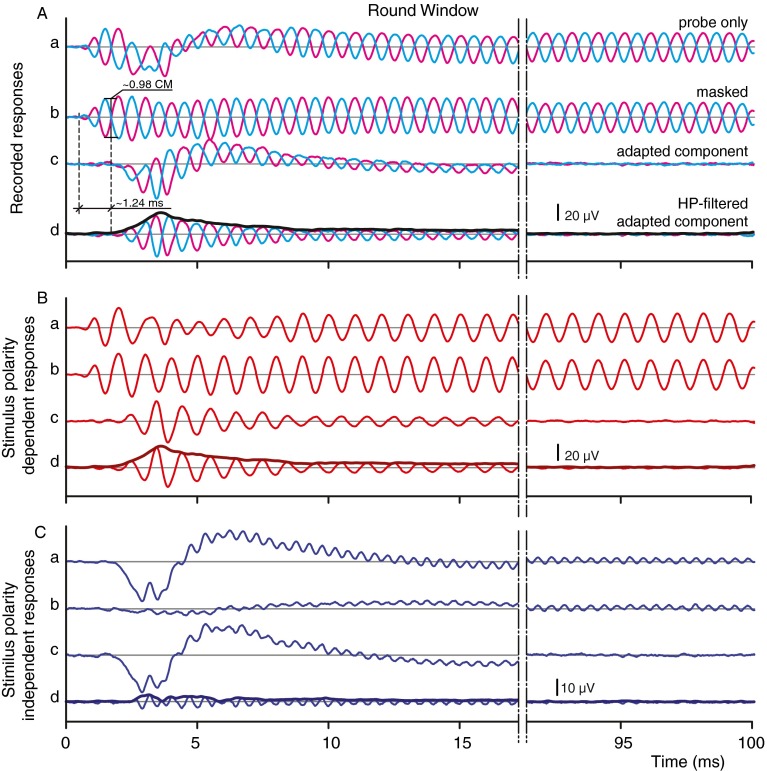
Figure 3 shows the responses at the RW recorded simultaneously to the AN responses in Figure 2 and arranged in the same format. The probe responses (Fig. 3A(a)) and their difference (polarity-dependent responses, Fig. 3B(a)) and sum (polarity-independent responses, Fig. 3C(a)) show the same basic features as for the AN. Again, an alternating component and a CAP are present, but there are some differences with the AN responses. First, the CAP (Fig. 3C(a)) is larger and shorter. Second, the alternating component has a much larger magnitude than that at the AN (Fig. 3A(a) vs. 2A(a); note that the ordinate scales are different) and has a different onset with a local depression around 5 ms, which is more pronounced in the dominant first-harmonic component in Figure 3B(a). Third, the forward-masked responses differ strikingly from those at the AN (Fig. 3A(b) vs. 2A(b)): there is no visible decaying slope and the initial response is actually larger than in the unmasked condition (Fig. 3A(a)) and decreases with time. The same is observed for the polarity-dependent responses in Figure 3B(a, b) but not for the polarity-independent responses in Figure 3C(a, b) in which masking has a strong suppressing effect on the magnitude of the CAP and the second-harmonic (Fig. 3C(b), <10 ms), similar to the AN. We attribute the apparent opposite effects of forward masking on the responses at the RW vs. at the AN, including the local depression around 5 ms in the RW probe response, to the interplay of a large nonmaskable RW-CM and the auditory round-window neurophonic (RW-NP). This is supported by the adapted component (Fig. 3A(c), B(c), C(c)) and its CAP-filtered version (Fig. 3A(d), B(d), C(d)), which reveal the true extent of the neurophonic at the RW (RW-NP). Despite the wildly differing probe and masked responses at the RW vs. AN, the CAP-filtered adapted component is surprisingly similar to the AN-dNP. In analogy with the AN-dNP, we refer to this component as the round-window decaying neurophonic (RW-dNP).
FIG. 3.
RW recordings obtained simultaneously with those of Figure 2 (same layout). Note that (A) and (B) are at a different amplitude scale than (C).
Time lag difference
Similar to the AN, there is a noticeable delay at the RW between the probe or masked responses (Fig. 3A(a, b): estimated at 0.53 ms) and the adapted component (Fig. 3A(c): estimated at 1.77 ms), giving an onset lag of 1.24 ms (between dashed vertical lines). This value is considerably larger than the 0.77 ms measured on the simultaneously obtained AN recordings (Fig. 2A(b)). The difference between these lags made us examine the onset regions more closely. Figure 4 zooms in on the initial responses: it shows 10-ms overlays of RW and AN responses of Figures 2 and 3 with, for purposes of comparison, freely scaled magnitudes. The traces in Figure 4B show the decaying neural components, i.e., the AN-dNP (green; as in Fig. 2Bd) and the RW-dNP (red; as in Fig. 3Bd). Overlay of these two traces shows their striking similarity not only in their waveform but also in their onset, which is visually estimated at 1.77 ms (Fig. 4B, vertical dashed–dotted line, note that this is the same dNP onset as indicated with the second vertical dashed lines in Figs. 2A(d) and 3A(d)). This suggests a single origin for the dNP measured at the two measurement locations. We return to this point below but first examine the receptor potential contributions.
The traces in Figure 4A are the polarity-dependent masked responses of the AN (green; same as in Fig. 2B(b)) and RW (red; same as in Fig. 3B(b)): they show the onset of the receptor potential contribution (AN-CM and RW-CM). The onset differs for the two recording locations: the RW-CM leads the AN-CM in time and in phase, which is unexpected from the view that the CM is a stationary potential. The lead in time is the difference of the visually estimated onsets shown in Figures 2A(b) (at 1 ms, first vertical dashed line) and 3A(b) (at 0.53 ms), i.e., 0.47 ms. The phase difference is close to 90 °: this corresponds to a time difference of ~0.25 ms (probe frequency of 1 kHz), i.e., the phase difference is smaller than expected from the onset time difference. We surmise that these time and phase differences, and also their discrepancy, indicate that the CM potentials at the two recording locations differently weigh the spatiotemporal distribution of the individual receptor potentials along the basilar membrane. For example, the initial and earlier transduction currents of the hair cells at the base, at the tail of the excitation pattern, may have a larger influence at the RW than at the more distal measurement location on the AN. This would cause an early onset in the RW-CM which precedes the actual onset of the dominant contribution in the RW-CM but not in the AN-CM, as we observe. A full treatment requires parametric changes along multiple stimulus dimensions (SPL and frequency) and is beyond the scope of the present study.
The AN-dNP and RW-dNP traces in Figure 4B also show a phase difference but, surprisingly, it is much smaller (~100 μs phase delay) than that between the CM traces in Figure 4A. The traces in Figure 4B are dominated by the first harmonic of the neurophonic. A similar small phase difference is also noticeable between the second harmonic of the AN-dNP and the RW-dNP, shown in Figure 4C. The fact that the phase difference of the decaying neurophonic measured at the two recording locations is so small suggests that the neurophonic is from a stationary location. The main point here is that, similar to the AN recordings, the responses recorded at the RW display two components which differ in onset delay and adaptation and which are consistent with receptors or nerve fibers as generators.
Masker-level dependence
In the previous sections, we devised a method to quantify neural phase locking measured at the AN and RW, based on neural masking. To evaluate the parameters resulting in optimal masking, we next investigate the dependence of the decaying neurophonic on masker level.
Figure 5 shows the influence of six masker levels on the time course of the magnitude of the masked responses (Fig. 5A, C; cf. Figs. 2A(b) and 3A(b)) and the corresponding decaying neurophonic (Fig. 5B, D; cf. Figs. 2A(d) and 3A(d)). The probe level and frequency for these recordings were 55 dB SPL and 1 kHz, respectively; the masker was a broadband noise (50 Hz–8 kHz). The traces shown are the time-evolving magnitudes as previously illustrated with the solid black traces in Figures 2 and 3, but to visually emphasize masking, the time scales of the panel are compressed by using a logarithmic time scale. The magnitude of the unmasked response (cf. Figs. 2A(a) and 3A(a)) of one of the six recordings (the others are similar) has been added as a visual reference in Figure 5A, C (thick blue curve).
FIG. 5.
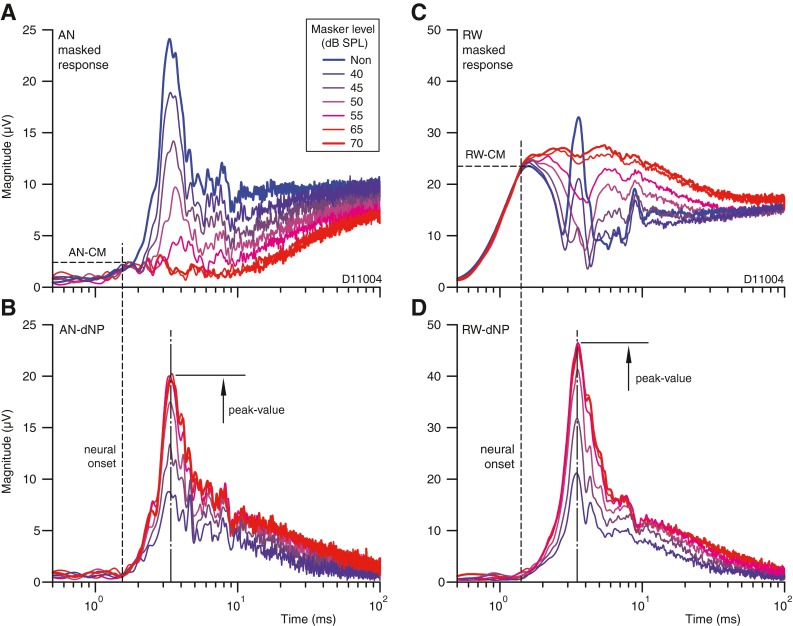
Dependence of the response magnitude and time course on masker level. A, C Masked responses at the AN and RW. The unmasked response is shown with the thick blue line. B, D Decaying auditory neurophonic calculated as the vectorial difference between masked and unmasked responses at a given masker level. The estimated neural onset is indicated by the dashed lines in (A) and (C). The peak magnitudes of the decaying auditory neurophonic are indicated by the arrows. The probe frequency and level are fixed and equal 1 kHz and 55 dB SPL; the masker was a broadband noise (50 Hz–8 kHz). These recordings are from a different experiment (animal) than those of Figures 2, 3, and 4.
In both sets of recordings, there is an early unmaskable component. This is visible in the masked responses (Fig. 5A, C) as an early stretch of time where all traces superimpose. Figure 5A shows for the AN recording that an increase of masker level increasingly reduces the response. Maximum response reduction is reached at 65 dB SPL, which is 10 dB above the probe level. This level difference (10 dB) was found to be typical over several experiments. A further increase in masker level (e.g., 70 dB SPL) does not generate additional masking. Note that at these high masker levels, there is a small remaining unmaskable residue between 1.5 and 10 ms. The magnitude of this residue is similar to the magnitude at neural onset (vertical dashed line), and is thus consistent with a (unmaskable) receptor contribution, i.e., the AN-CM. The traces in Figure 5B represent the AN-dNPs corresponding to those in Figure 5A, i.e., the vectorial differences between the unmasked (cf. thick blue line) and increasingly masked responses. The magnitude of the AN-dNP increases monotonically with masker level until it reaches a maximum at 65 dB SPL.
Figure 5C shows the corresponding traces for the RW responses that are simultaneously recorded with those in Figure 5A. Again, there is an unmaskable component before neural onset (vertical dashed line), but which is much larger magnitude than at the AN (Fig. 5A). We interpret this component to be the RW-CM. The subsequent capricious time course of the responses with time is interpreted as the result of the vectorial sum (phase and amplitude) between RW-CM and RW-NP, which gradually stabilizes with increasing masker levels to a plateau comparable to the magnitude at neural onset, i.e. at the vertical dashed line. Note that for this example the effect of increasing masking is in opposite direction to that in Figure 5A and might seem to be counterintuitive, i.e., growing response despite increasing masker level. Figure 5D shows the corresponding traces for the RW-dNP. In contrast to Figure 5C, these traces are not capricious and are strikingly similar to those of the AN-dNP (Fig. 5B), but systematically larger as indicated before (Fig. 4B, C). Thus, surprisingly, the magnitude of the neural phase-locked component is larger in our measurement at the RW than at the AN. As mentioned (“METHODS”), the AN recording is differential on the nerve while the RW recording is referenced to the neck: in subsequent experiments (not shown), we found that the magnitude of the neural phase-locked component is similar at the two locations (AN and RW) when a monopolar recording configuration is used for both.
To summarize, the example of Figure 5 illustrates several important features. It shows the tight relationship between the neurophonic measured at the RW and at the AN (Fig. 5B, D), and the ability of the method to reject the CM, independent of masker level. It also shows that masker levels of ~10 dB above the probe level (here at 65 dB SPL) are sufficient to make optimal use of forward masking towards characterization of the neurophonic.
Quantification of the neurophonic
Our main overall objective is to find a representative measure for the neurophonic, which is robust enough to study the upper frequency limit of phase locking. In addition to the decaying neurophonic described in Figures 2 and 3, we explored additional ways to measure the neurophonic, and checked the different measures for consistency. In this section we first develop a metric which uses CM estimates from the initial response to interpret the steady-state response. We then show that the neurophonic estimates based on steady-state and adapting response components can be related to each other in a manner that is coherent and consistent with known neural properties.
Steady-state estimate of the neural first-harmonic component
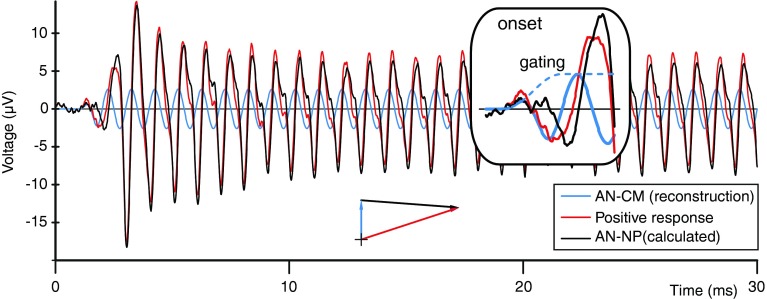
We first compare the unmasked response of the AN with its AN-CM. This is graphically illustrated in Figure 6. The red trace shows one of the averaged probe responses (magenta trace in Figure 2A(a), here CAP filtered) in the time domain and as a vector at steady state. The blue signal is the reconstructed AN-CM based on the phase and amplitude before and at neural onset (Fig. 2A(b, c), dashed lines) with superimposed signal gating. The result of the difference between the probe response (red signal) and the estimated AN-CM (blue signal) is the calculated AN-NP and is indicated in black. Its steady-state amplitude (e.g., >20 ms) can be measured from the figure or can be calculated with a vector subtraction. This is illustrated with the vector diagram in Figure 6, which gives an amplitude and phase for AN-NP of 〈 7.0 μVp, ∠-94 ° 〉 (=〈 7.3 μVp, ∠-73 ° 〉 − 〈 2.6 μVp, ∠0 ° 〉). It is important to observe that in this recording the AN-CM has almost one third of the AN-NP amplitude but is at almost right angles to the AN-NP, so that its actual size is not immediately obvious in the recording.
FIG. 6.
Alternate method for estimation of the AN-NP, by subtracting the reconstructed AN-CM from the CAP-filtered positive probe response. Detail of the onset with superimposed gaiting is shown in the insert. The vector diagram represents the vector subtraction of the steady-state amplitudes of these signals. Data are based on the same responses as in Figure 1.
The obtained phase difference of 94 ° is consistent with the time delay of 0.77 ms (Fig. 2A) between AN-CM and AN-NP, if combined with a phase reversal of one of these signals. Indeed, a phase reversal between these signals is noted at the onsets in, e.g., Figure 6 and, more clearly, in Figure 4: the arrows in Figure 4A, B show that the AN-CM (Fig. 4A) starts with a positive cycle and the AN-NP (Fig. 4B) with a negative cycle. Thus the effective phase delay for the AN-NP equals −94 °−180 °=−274 °, which is close to the −277 ° (0.77 ms × 360 °/1 kHz) predicted from the onset lag. The good agreement between these delays indicates that the steady-state phase-locked response measured on the AN can be reasonably well described as a vectorial sum of an AN-CM and AN-NP with a fairly consistent phase relationship at the onset and steady state.
Despite the method’s potential to obtain a good estimate of the time course of the AN-NP and its steady-state value, the method might be inaccurate at low and high frequencies. At low frequencies, it is difficult to reconstruct the AN-CM because of the large period relative to the time lag of the AN-NP. At high frequencies, the magnitude of the AN-NP is much lower than that of the AN-CM; this is particularly true for the RW were the contribution of the CM is much larger.
Adapted component
It was argued above that the decaying neurophonic (AN-dNP) reflects a purely neural contribution (Fig. 2A(d), B(d)). If so, then we should be able to relate that contribution to the steady-state estimate. The red trace in Figure 7A (red trace) shows the positive response of the AN-dNP in Figure 2A(d), which is here overlaid on the calculated AN-NP of Figure 6 (black trace). At response onset, these curves are in good agreement: they have the same phase, similar onset magnitude, and similar intrinsic adaptation at the onset (before 10 ms), but the AN-dNP has an additional exponential decay due to the recovery of masking. The instantaneous magnitudes of these waveforms are shown in Figure 7B by the black and red curves. The ratio between these traces (black/red) is indicated by the lower green curve and represents the instantaneous masking factor: a factor of 1 indicates 100 % masking, while 0 means full recovery or no masking. Between 10 and 30 ms, the trace has, on a log-lin scale, a linear course with time (fit by the lower green dashed line), indicating a purely exponential recovery from masking. The time constant of this slope is 23 ms. Beyond 30 ms, recovery is much slower with a much larger time constant (not determined here). The presence of two time constants is consistent with previous measurements (Chimento and Schreiner 1990) where for the rapid recovery a mean time constant of 16.2 ms was reported and for the slow recovery a time constant of 125 ms (the probe and masker frequencies were 800 Hz). Note that the slope of the rapid recovery could provide an extrapolated steady-state value for the AN-dNP at 0 ms (Fig. 7B, upper green dashed line). For this example, the extrapolated value is 6 μVp (green arrow), which is close to the 7.0 μVp of the estimated steady-state value (black arrow). This agreement is not trivial because the waveforms of Figure 7A were derived from different response components and because sufficiently strong masking is required.
FIG. 7.
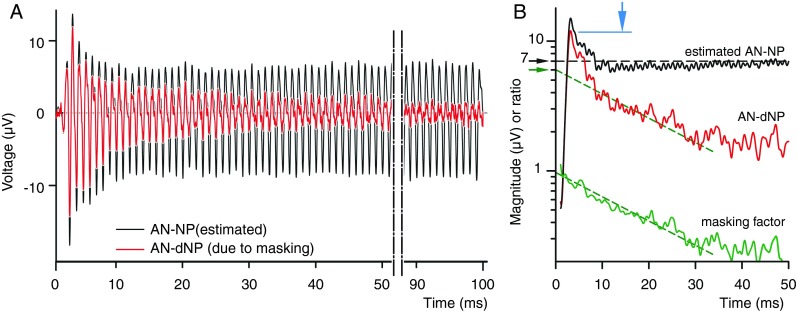
Comparison between the decaying AN-NP (red trace; only the positive polarity of the raw response is considered, same as the magenta trace in Figure 2A(d)) and the estimated AN-NP from Figure 6 (black). A Overlay in the time domain. B Magnitudes of the signals in (A) together with the masking factor of the AN-dNP induced by the exponential recovery of masking (lower green line, calculated as the ratio of the magnitudes and slightly smoothed with a noncausal moving average filter). The blue arrow is the peak-magnitude of the AN-dNP; the black arrow is the estimate of the steady-state amplitude (7 μVp); and the green arrow is the extrapolated amplitude based on the exponential recovery of masking.
The extrapolated value at 0 ms (green arrow) could be used as a metric of neural phase locking. However, it would only be available for responses with good SNR and clear masking slope (i.e., dashed green line). For example, if the upper limit of neural phase locking is searched where the SNR is intrinsically poor, another more robust measure is needed.
Another candidate metric to measure neural phase locking is the peak magnitude of the AN-dNP (blue vertical arrow in Fig. 7B): it is inherently the largest instantaneous signal (largest SNR) and is therefore easily detectable. A small disadvantage of this measure is that it overestimates the steady-state value of neural phase locking (Fig. 7, blue vs. black arrow). Another disadvantage is that it contains not only the fundamental component (which is typically used in estimates of phase locking in single fibers via vector strength), but also higher harmonics. The later disadvantage can be reduced by using only the polarity-dependent responses (cf. Fig. 2B(d)), which contains only odd-harmonic components such as the dominant first harmonic (=fundamental component). We went even further and extracted the time course of the desired harmonic components (first and second harmonics).
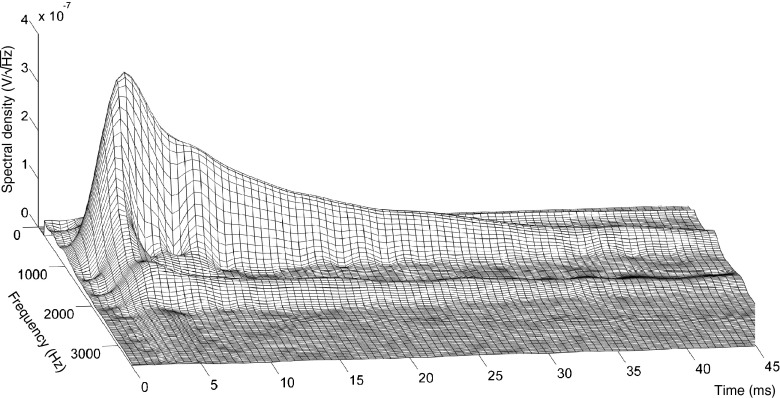
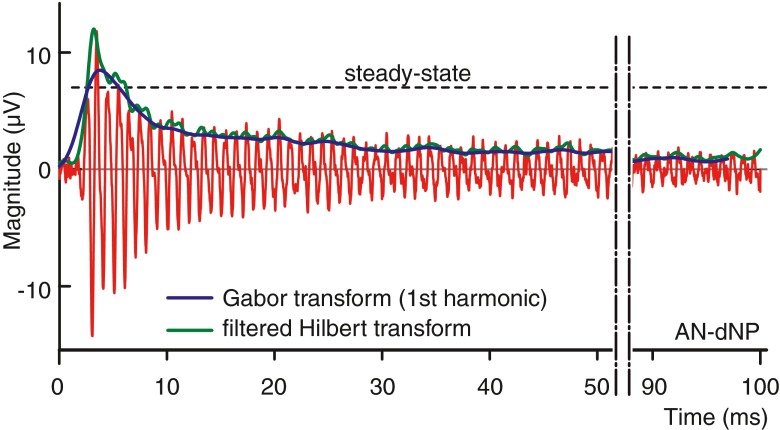
For this final method to quantify neural phase locking, we used a Gabor transform (a short-time Fourier transform with a Gaussian window) to perform a time-frequency analysis of which we extracted the time-evolving power of the desired harmonics. The Gabor transform achieves the best time-frequency product among all the possible window functions (the Gaussian window minimizes the Fourier uncertainty principle) of the linear transforms. The Gabor transform (see “METHODS”) was parametric optimized to SNR for the optimal detection of the desired harmonic component in the decaying neurophonic, and this over a wide range of probe frequencies (0.3–5 kHz). Figure 8 shows a 3D surface spectrogram of a typical RW-dNP signal (cf. Fig. 3A(d)) obtained using the Gabor transform; the spectral density is here expressed in V/√Hz. The first (1 kHz) and second (2 kHz) harmonics are clearly visible as the two peaks which decay in time as a result of the recovery of masking. Despite the fact that the Gabor has the best time-frequency product of the linear transforms, this product is still larger than zero. As a result, the spectral power of the harmonics is spread as a Gaussian function in the frequency and time domain. To obtain the time course of the magnitude of the desired harmonic, first, the power from the spectral density around the desired harmonic (see “METHODS”) was calculated for each point in time and then converted to a magnitude. Figure 9 shows such evolving magnitude (blue trace) for the fundamental in the positive AN-dNP signal of Figure 2A(d; red signal), together with the envelope obtained using a Hilbert transform (green trace). As expected, the onset time, onset slope and peak magnitude of the trace obtained using the Gabor transform show the temporal integration of the Gaussian time window (constant six cycles) relative to the trace obtained with the Hilbert transform. Conversely, the maximum magnitude is less sensitive to local variations in the signal and is closer to the steady-state value than that of the peak value of the Hilbert transform. To conclude, the maximum magnitude of the fundamental obtained with the Gabor transform is the most suitable measure of the neurophonic for use over a wide range of conditions.
FIG. 8.
Illustration of a RW-dNP 3D surface spectrogram obtained with a Gabor transformation. The probe frequency was 1 kHz; the signal at 2 kHz is the second harmonic. To mimic the amplitude envelope, the vertical axis is expressed as the square root of the power spectral density (V/√Hz).
FIG. 9.
Comparison of magnitude time courses of the AN-dNP (red) obtained using a (filtered) Hilbert transform (green; see “METHODS”) and a Gabor transform (fundamental component, blue; see “METHODS”). The dashed line is the steady-state reference amplitude of the estimated neurophonic. The example is based on the positive polarity magenta trace in Figure 2A(d).
TTX
In the previous section, we developed a technique, based on forward masking, to derive a signal and metric to quantify neural phase locking in the potential recorded at the RW: the signal is the RW-dNP; the metric is the maximum magnitude of the fundamental obtained with the Gabor transform of the RW-dNP. As an independent test of the neural basis of the components that we designate as such, we compared results obtained before and after the application of TTX. TTX blocks the firing of action potentials but does not prevent the flow of ionic transduction and synaptic currents. In this section, we repeat the analyses developed in the previous section on data from a second animal in which the recordings were obtained pre- and post-TTX. Our goal is to derive a signal, which we will refer to as the RW-ttxNP, which estimates the neural contribution at the RW (the RW-NP) without making use of forward masking.
Effect on CAP
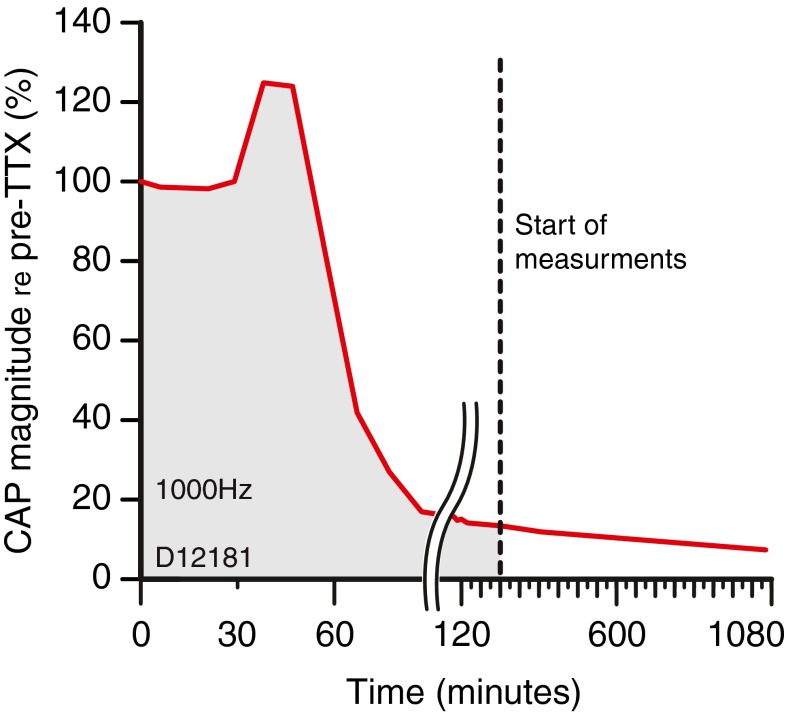
After an initial session to obtain baseline estimates of the RW-dNP, we applied 4 μL (10 mM) TTX to the RW and monitored the CAP responses to tone pips over a long time. The evolution of the magnitude of the CAP response to a probe frequency of 1 kHz is shown in Figure 10. During the first 30 min, the CAP did not change. Thereafter, a period of enhancement was observed, where the CAP became larger than its initial value. After 15 min of enhancement, the CAP declined rapidly to 14 % of its initial value after which it further decreased, but more slowly. Four hours after the application of the TTX, the CAP was reduced to 12 % of its initial value and was stable enough to start further data acquisition (dashed line). The CAP was measured again 12 h later and was still less than 12 % of its initial value. It is thought that the remaining CAP reflects excitatory post-synaptic potentials of afferent dendrites (Dolan et al. 1989).
FIG. 10.
CAP reduction at the RW as a function of time after administration of TTX at the RW. The probe frequency was 1 kHz. The dashed line indicates the beginning of the recording.
Effect on raw recordings
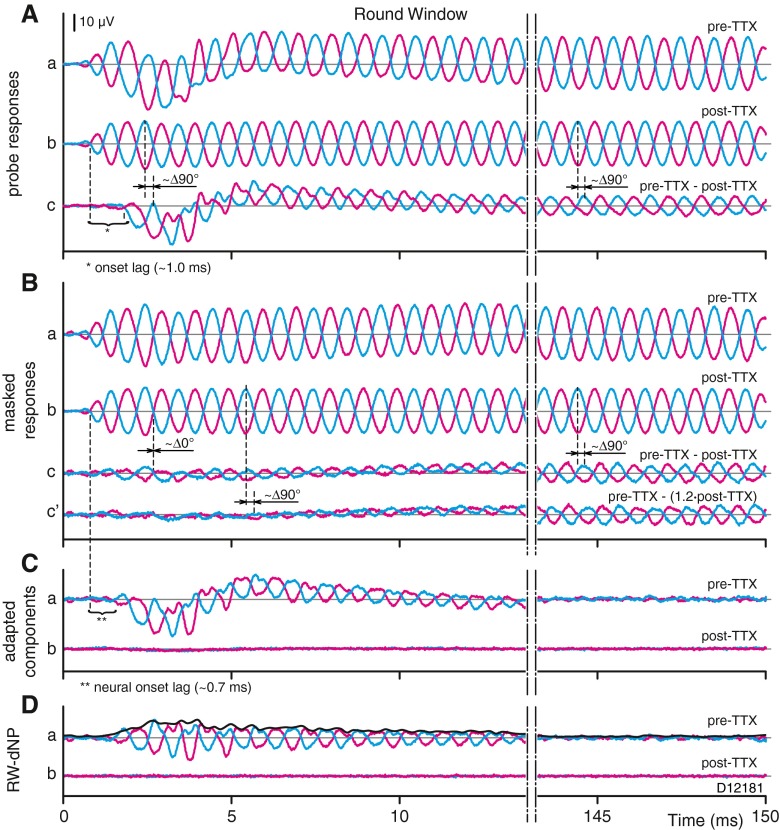
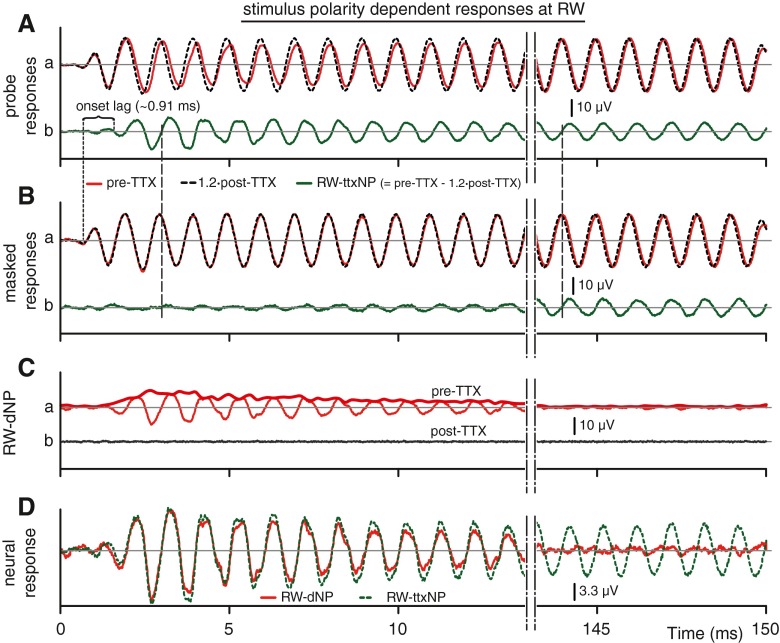
Figure 11 shows the effect of the administration of TTX on the recorded stimulus evoked averaged potentials at the RW and their derived signals. Note that the layout of this figure differs from Figures 2 and 3, with each panel (A–D) showing pre- and post-TTX comparisons. Figure 11A(a) shows the pairs of raw, unmasked responses to opposite stimulus polarity measured at the RW before the administration of TTX. Similar to the data shown in Figure 3A(a), these responses contain the typical neural features at the beginning of the alternating responses, i.e., an amplitude modulation associated with the onset of the neurophonic and a superimposed slow-wave associated with the CAP. These features have largely faded in the measurements after application of TTX (Fig. 11A(b)), which shows an alternating component which closely resembles the stimulus. Subtraction of the post-TTX from the pre-TTX responses (Fig. 11A(a, b)) should reveal the contribution of the neural response, and this difference is shown in Figure 11A(c). It reveals a slow-wave and alternating components delayed in onset (by ~1.0 ms) relative to the post-TTX response (Fig. 11A(b)), consistent with these components being of neural origin. In addition, the phase of the alternating component in the subtraction differs by about ~90 ° with the post-TTX signals in Figure 11A(b), which must be almost pure CM in view of the presence of TTX. Thus, both the delay in onset and the difference in phase are consistent with a neural rather than CM origin for the signals shown in Figure 11C.
FIG. 11.
Effect of TTX on stimulus evoked response averages recorded at the RW. A a Pair of raw probe responses for opposite stimulus polarities, pre-TTX. A b Same as (A a) but carried out 4 h after administration of TTX (post-TTX). A c Net effect of TTX on raw probe response (pairs A a, b). B a Pair of masked probe responses pre-TTX. B b Same as (B a) but post-TTX. Bc Net effect of TTX on masked probe responses (pair B a–pair B b). B c’ Same as (B c) but corrected for the post-TTX reduction in CM. C a Adapted components pre-TTX (pair A a–pair B a). C b Same as (C a) but post-TTX (pair A b–pair B b). D a, b Same as (C a, b) but without CAP (high-pass filter). The average envelope of the paired adapted components in (Da) is shown as the thick line. Probe parameters: level = 50 dB SPL; frequency = 1 kHz; and duration 150 ms. Masker parameters included the following: level = 70 dB SPL and frequency = 1 kHz. The scale bar for the traces is indicated in (A), and applies to all traces.
If TTX would not affect CM responses and completely abolish neural contributions, Figure 11A(b) would represent the pure CM and Figure 11A(c) the total contribution of the CAP and neurophonic available at the RW. The latter signal could then be used to verify our method of neurophonic estimation based on masking, discussed in previous sections. There are reasons to suspect that the actual situation is not that pure. We already pointed out (Fig. 10) that the CAP does not completely disappear after TTX, so that the post-TTX signal (Fig. 11A(b)) probably does not represent pure CM. Moreover, some change in the CM between the pre- and post-TTX measurements is likely: (a) there is a long delay (>4 h) between these two measurements, and any change in the state of the cochlea may affect the size of the CM; (b) in similar studies (Henry 1995; He et al. 2012), a small reduction in CM due to TTX was noted. We therefore first examine more closely the two assumptions of complete block of neural contributions and of absence of effect on CM.
Effect on CM
In Figure 11B, we compare the onset regions of forward-masked responses pre-TTX (Fig. 11B(a)) and post-TTX (Fig. 11B(b)): the difference between these two responses is shown in Figure 11B(c). It shows visually no onset lag and no phase shift with the CM (Fig. 11B(b)), indicating that it is a residual CM. This residue can be drastically reduced by compensating only the post-TTX response (Fig. 11A(b)) with a factor of 1.2 (−17 %), as illustrated in Figure 11B(c’). The difference signal is now nearly flat at the onset and shows a slowly increasing alternating component. Its time course and phase shift of ~90 ° with the CM (Fig. 11B(c’ vs. b) are consistent with a dominant neural component. In summary, after administering of TTX a small decrease (−17 %) in amplitude of the CM was observed but not in phase, which we have to take into account in our further analysis.
Effect on neural contributions
The second assumption we examine is how complete the block of the neural contribution is by TTX. If the block is not complete, the subtraction of pre- and post-TTX responses (Fig. 11A(c)) will not represent the full neural contribution. To assess completeness of neural block, we look at the maskable component in pre- and post-TTX conditions. Maskability is a neural property, so the prediction is that the effect of masking disappears after administration of TTX. We start by constructing the RW-dNP for the pre-TTX responses. Figure 11C(a) shows the pre-TTX responses, as the difference between unmasked (Fig. 11A(a)) and masked (Fig. 11B(a)) responses. This is the same subtraction as illustrated in Figure 3A(c). Filtering of this subtraction removes the CAP (cf. Fig. 3A(d)): the result is shown in Figure 11D(a). Remember that we regard these signals as purely neural responses. We then perform the same analysis on the post-TTX responses: these results are shown in Figure 11C(b), D(b). These signals are practically featureless. The adapted component in Figure 11C(b) reveals a tiny onset but no ongoing response difference between the unmasked and masked post-TTX responses, and this onset response difference disappears completely with filtering (Fig. 11D(b), RW-dNP post-TTX). This residual component was not unexpected, as it was observed during the monitoring of CAPs to tone pips (Fig. 10). The main point here is that there are virtually no maskable components after application of TTX, which is a strong indication that the neural block is very complete, certainly regarding the ongoing, alternating neural contribution.
Stimulus polarity-dependent responses
We are now in a position to calculate the neurophonic (RW-ttxNP) using the results with TTX. As illustrated earlier (Figs. 2B and 3B), subtraction of responses to opposite polarity allows a better evaluation of the presence of the fundamental component, which dominates such subtractions. To obtain the RW-ttxNP, we first subtract the two polarities in the post-TTX (Fig. 11A(b)) and pre-TTX (Fig. 11A(a)) signals: these differences are shown in Figure 12A(a) in red (pre-TTX) and dashed black (post-TTX). The latter signals were compensated by a factor of 1.2 (see “Effect on CM”). The RW-ttxNP is the difference of these compensated pre- and post-TTX signals (Fig. 12A(b), green). Note that this difference does not simply equal the difference of the signals shown in Figure 11A(c), which did not incorporate the 1.2 compensation factor. As expected, the RW-ttxNP signal has a prominent fundamental component. It shows an onset lag (~0.91 ms), an adaptive component (<15 ms), and thereafter a sustained part.
FIG. 12.
Effect of TTX on the stimulus polarity-dependent responses of Figure 11, calculated as the half differences between the corresponding pairs in Figure 11; the results represent the odd harmonics, here dominated by the fundamental. A a Polarity-dependent probe responses pre-TTX and 1.2∙post-TTX (compensated for post-TTX reduction in CM). A b Netto effect of TTX on probe response (traces pre-TTX–1.2∙post-TTX in (A a)): this is the RW-ttxNP. B a, b Same as (A) but for the masked responses. C a Decaying neural component pre-TTX (red, A a–B a, CAP filtered); envelope indicated by thick line. C b Same as Ca but post-TTX (dashed black (A a–B a)/1.2 CAP filtered). D Overlay of (A b) and (C a) for comparison (magnitude, ×3 relative to other panels). Accolade: onset lag relative to onset of CM (vertical dotted line). Vertical dashed lines are guide lines to indicate the phase relation between (A b) and (B b).
Figure 12C(a) shows the stimulus polarity-dependent neurophonic, i.e., the RW-dNP, derived from the pre-TTX recordings as illustrated earlier (cf. Fig. 3B(d)), and showing the same features as obtained in the previous animal. Also shown (Fig. 12C(b)) is the RW-dNP signal derived from the post-TTX recordings: no more features are discernable, which does not only indicates a lack of neurophonic (as expected from the action of the TTX) but also illustrates the excellent CM cancelation, as will be discussed and quantified in the next subsection.
Figure 12D now shows the critical comparison of RW-dNP (red, same as Fig. 12C(a)) and RW-ttxNP (dashed green, same as Fig. 12A(b)). In addition to the decay in the RW-dNP due to recovery from forward masking, both signals are strikingly similar in amplitude (ΔV/V = 6 %) and phase (Δφ≈4 °). This is a strong argument that forward masking allows us to effectively capture the phase-locked neural contribution in the signal measured at the RW.
For completeness, we applied the analysis performed on the probe responses (Fig. 12A) also on the masked responses (Fig. 12B). The near-zero magnitude at the stimulus onset and the phase being consistent with that in Figure 12A(b) (indicated by the vertical dashed lines between the two green traces) are further evidence that the masked signal is indeed dominated by neurophonic, without significant contamination by CM.
First-harmonic component
As already remarked, the fundamental frequency component of the neurophonic is particularly relevant because neural phase locking in single nerve fibers is typically quantified with the vector strength to the fundamental. In the “Quantification of the Neurophonic,” we concluded that the maximum magnitude obtained with the Gabor transform is the most suitable measure of this fundamental. Having determined the qualitative similarity in RW-dNP and RW-ttxNP, we now apply the Gabor analysis for a quantitative assessment of these results.
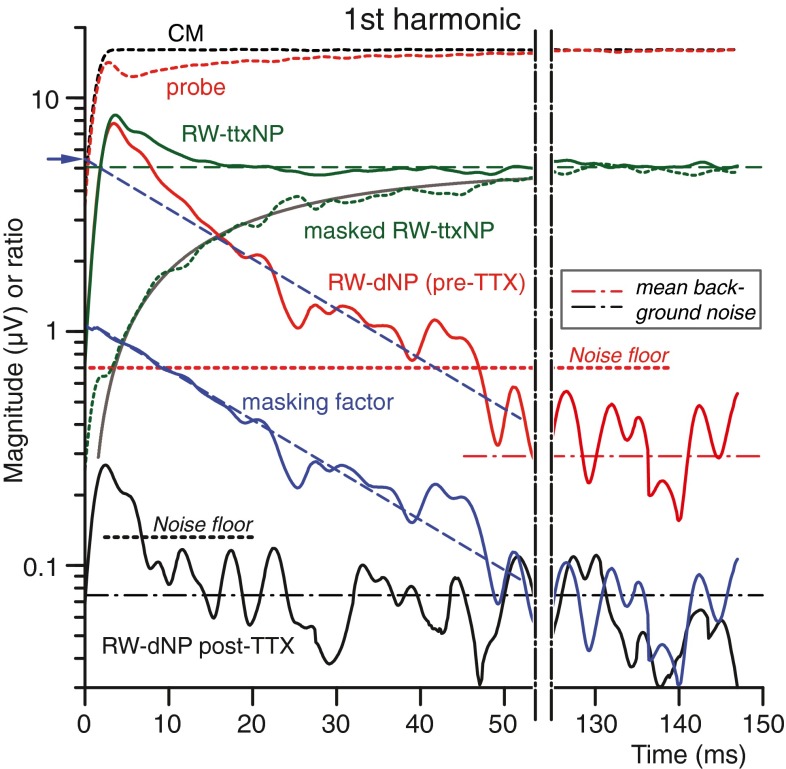
Figure 13 shows the magnitudes obtained with the Gabor transform as a function of time for the first-harmonic components of the most relevant signals in Figure 12. The post-TTX CM (dashed black, see also Fig. 12Ba) shows a steep rise to a steady state. The pre-TTX probe response (dashed red, also in Fig. 12Aa) shows the same steep rise but then it has a somewhat different time course because it is a mixture of CM and neurophonic. The RW-ttxNP (green, based on Fig. 12D) is purely neural: after an initial rise, it adapts to a steady-state value which is smaller in magnitude than the CM. The recovering neurophonic, masked RW-ttxNP (dashed green, based on Fig. 12Bb), grows monotonically to reach the same magnitude as the RW-ttxNP. The pre-TTX RW-dNP (red, based on Fig. 12C) decays in time as expected from recovery of masking. The post-TTX RW-dNP shows some initial remaining signal (black, also in Fig. 12C).
FIG. 13.
Magnitudes as a function of time for the fundamental component using the Gabor transform (see “METHODS”) of the most relevant signals in Figure 12: CM (black dotted trace; from Fig. 12B(a), post-TTX), unmasked probe response (red dotted trace; from Fig. 12A(a), pre-TTX), RW-ttxNP (green trace; from Fig. 12D, green trace), recovering masked RW-ttxNP (green dotted trace; from Fig. 12B(b)) with idealized trend (faint gray trace), pre-TTX RW-dNP (red trace; from Fig. 12C(a)) and post-TTX RW-dNP (black trace; from Fig. 12C(b)). Additionally, two other kinds of noise levels, the mean background noise (horizontal dashed dotted lines) and the noise floor (dotted lines; ~maximum noise level, threshold neurophonic) of the RW-dNP pre-TTX (red) and post-TTX (black) and also a trace representing the masking factor (blue trace) with its fitted slope (blue dashed line) are included; the blue arrow is the estimated neural steady-state value based on the masking slope determined at 0 ms. The masking factor is the ratio between the pre-TTX RW-dNP and neurophonic (cf. Fig. 7B). The green dashed line is the steady-state neurophonic.
Earlier, we calculated an instantaneous masking factor for the responses measured on the AN (cf. Fig. 7B), to illustrate consistency between different estimates of the AN-NP. Here, we use a similar approach to check consistency between the neurophonic at the RW estimated from masking and from TTX. We calculate the masking factor as the ratio RW-dNP/RW-ttxNP, shown by the blue line in Figure 13. The masking factor is ~1 at stimulus onset, which indicates very effective masking. The masking factor behaves very similarly to that of the other experiment in Figure 7B, with the same linear trend and masking slope (τ = 21 vs. 23.3 ms in Fig. 7B). Application of this slope to the RW-dNP (blue dashed line through red trace) predicts a value at time 0 ms which is in agreement (blue arrow, estimation, 5.3 vs. 5 μV) with the steady-state neurophonic (horizontal green dashed line).
The green dotted line in Figure 13 shows the recovering fundamental in the masked RW-ttxNP (cf. Fig. 11B(c’)). This recovery is very well described by an idealized exponential recovery (gray curve) according to the formula: 5∙[1–exp((0.3−t)/21)], with 5 μV being the steady-state value of the RW-ttxNP, 0.3 ms being time delay in onset of recovery from masking, and 21 ms being the recovery constant of the masking factor. The good agreement between the predicted trend and the actual curve confirms the validity of the used compensation factor of 1.2. If the CM compensation factor of 1.2 is not applied, the recovery curve deviates significantly from the prediction, particularly at the onset where it then shows a larger signal (cf. Fig. 11B(c)).
Two kinds of noise measures are indicated. The first noise measure is the noise floor (Fig. 13, horizontal dotted lines) and is the value which we consider as the threshold of phase locking. It is the maximum magnitude (actually the 99.75th percentile to avoid freaks) of the stimulus and response-free pre-TTX (red dotted line) and post-TTX (black dotted line) signal, similarly calculated as the RW-dNP (Gabor transform). The post-TTX noise floor reveals a small adaptive component at the onset of the RW-dNP (black trace; post-TTX) with a shape and decaying slope similar to that of the pre-TTX RW-dNP (red trace). This indicates a residual maskable neurophonic (~3 %), as expected from the residual CAP (Fig. 10). However, its phase (not shown) is not the same as that of the neurophonic or CM, so its exact origin and composition is unclear.
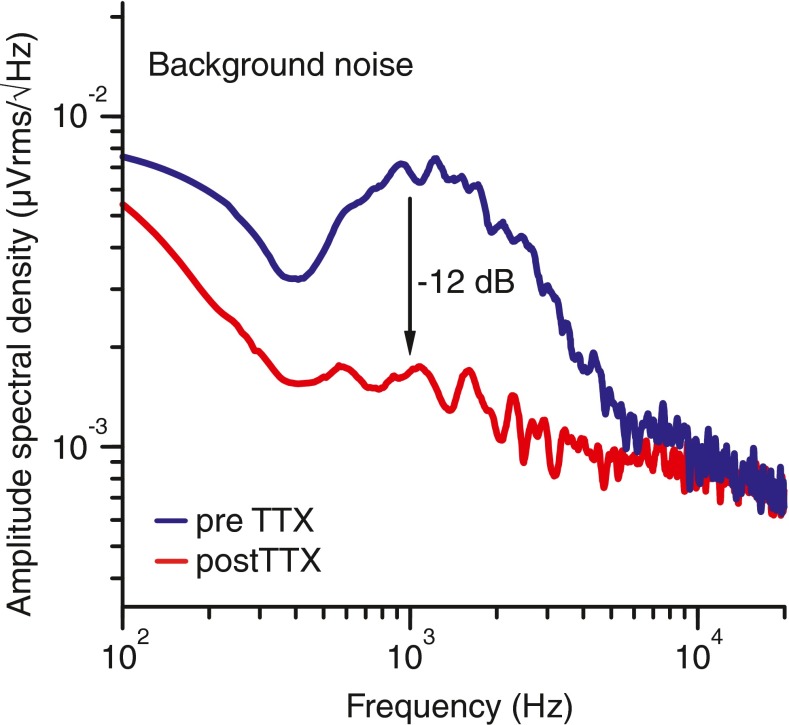
A second noise measure is the background noise (dotted–dashed horizontal lines), which is the mean rather than the maximum magnitude of the response-free signals. It is 12 dB lower in the post-TTX relative to the pre-TTX condition, presumably due to the neural blocking of spontaneous activity. Consistent with this explanation, the post-TTX amplitude spectral density in Figure 14 shows a 12-dB reduction and a flattening of the spectral band associated with spike activity.
FIG. 14.
Frequency spectrum of the background noise pre- (blue) and post-TTX (red). Calculated from the response-free part in the signal (cf. section 3 of Fig. 1).
It is interesting to compare steady-state magnitudes of responses and noises (Fig. 13, right side of figure). The mean steady-state value of the post-TTX RW-dNP (0.068 μVp, Fig. 13, black trace) is similar in amplitude to its (response-free) background noise (0.073 μVp, black dotted–dashed horizontal line). Remember that the post-TTX RW-dNP is obtained from probe and masked responses (such as in Fig. 11A(b), B(b)) with amplitudes of ~15 μVp, which are ~46 dB above the background noise level. Thus, the subtraction effectively cancels CM over at least 46 dB. In the pre-TTX condition, the mean steady-state value of the RW-dNP (0.35 μVp, Fig. 13, red solid trace) is again similar in magnitude to its background noise (0.3 μVp, red dotted–dashed horizontal line). Clearly, in this case the background noise is largely of neural origin.
Stimulus polarity-independent responses
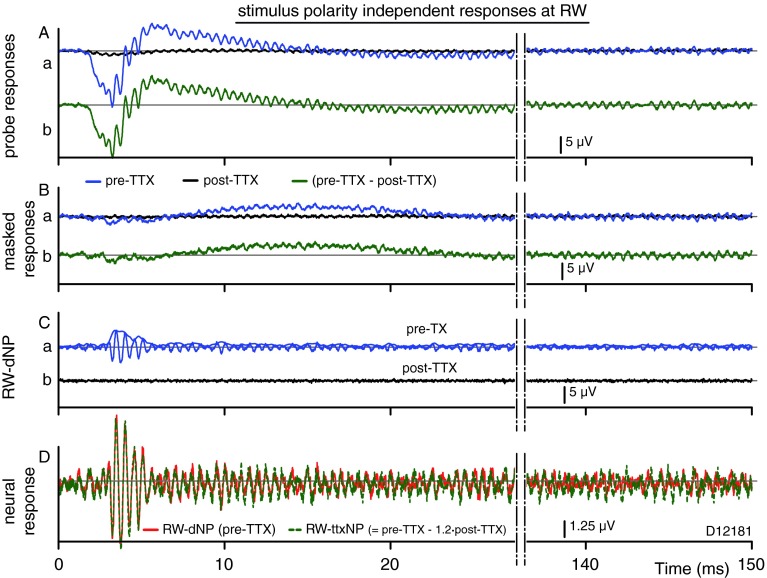
An alternative approach to disambiguate CM and neural contributions to RW responses has been to study the second harmonic (Snyder and Schreiner 1984a; Forgues et al. 2013; Lichtenhan et al. 2013). Figure 15 shows the stimulus polarity-independent responses obtained by summing the pairs of responses of Figure 11. Shown are the raw responses pre-TTX (blue, signals: Fig. 11A(a), B(a)) and post-TTX (black, signals: Fig. 11A(a), B(a)) for the unmasked (Fig. 11A) and masked (Fig. 11B) conditions. The post-TTX responses are not compensated for the post-TTX reduction in CM, because this would unintentionally increase the size of the CAP. The net results (pre-TTX–post-TTX) for the unmasked and masked probe responses are depicted in Figure 15A(b), B(b) (green). TTX affects the even harmonic responses similarly as the odd harmonics: neural features of the response disappear or are greatly reduced. In the probe response, the CAP and the second harmonics are greatly reduced post-TTX (Fig. 11A(a)). In the masked response, there is little signal in the second harmonics to start with and this is virtually abolished post-TTX Figure (Fig. 15B(a)). The RW-dNP, obtained by subtracting the masked response (Fig. 11B(a)) from the probe (Fig. 11A(a)) response and filtering the CAP, is shown for pre-TTX and post-TTX conditions in Figure 15C. The pre-TTX RW-dNP in Figure 15C(a) shows a small adapting neurophonic, which is absent post-TTX (Fig. 15C(b)). In order to compare the neural contribution to the even harmonics, we compare the estimate based on masking (the RW-dNP, Fig. 15C(a)) with that obtained using TTX (RW-ttxNP), similar to the overlay shown in Figure 12D. The pre-TTX RW-dNP is replotted in Figure 15D as the red trace. The RW-ttxNP is obtained as the CAP-filtered difference between the pre-TTX and post-TTX probe responses in Figure 15A(a). The post-TTX response is compensated by a factor 1.2 for the reduction in CM. As was the case for the signals dominated by the first harmonic (Fig. 12D), both signals are strikingly similar near onset, with basically the same amplitude and phase.
FIG. 15.
Same as Figure 12, but for the stimulus-independent components. Calculated as the half sum of the corresponding pairs in Figure 11, the results represent the CAP and even harmonics, here dominated by the second-harmonic component. A–C Similar to Figure 12, but not compensated for post-TTX reduction in CM. D Overlay of neural contribution estimated with forward masking (red) or TTX (dashed green; note, magnitude ×4 re. other panels). Green dashed line Signal obtained as the CAP-filtered difference of the traces in (A a), pre-TTX, and post-TTX, but with the post-TTX compensated by ×1.2. Red Same as trace in Ca.
Figure 15A(a) showed that the CAP is strongly reduced by TTX (−24 dB, VPP, black vs. blue trace in Fig. 15A(a)). Note that this reduction is not complete and two times less than for that of the neural phase-locked first-harmonic component in Figure 13 (<-30 dB, RW-dNP pre-TTX, red vs. RW-dNP post-TTX, black, at onset). This suggests that the neural generators contributing to the neurophonic are a subset of the generators contributing to the CAP. The remainder of the CAP post-TTX is further attenuated by forward masking and disappears almost completely (−40 dB, black trace in Fig. 15B(a) vs. blue trace in Fig. 15A(a)).
Second-harmonic components
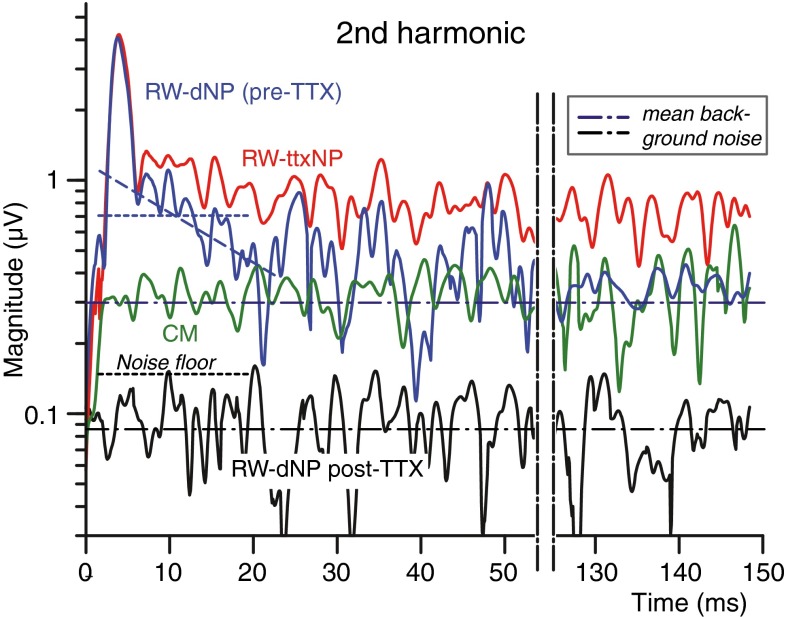
The magnitudes of the second harmonic, using the Gabor transformation, are depicted in Figure 16. The neural second-harmonic component (red) is derived from the RW-ttxNP (Fig. 15D, green) that was obtained from the pre- and post-TTX responses without masking. The second harmonic of the CM (Fig. 16, green) is obtained from the post-TTX masked response (Fig. 15B(a), black), compensated by factor 1.2. Clearly, for the parameters in this experiment (i.e., fP = 1 kHz; LP = 55 dB SPL), the steady-state neural second-harmonic component is significantly larger (16.4 dB) than the second harmonic of the CM. As expected, the CM’s second harmonic is also much smaller (−34 dB) than its fundamental (Fig. 13, dashed black trace). Note, however, that this second harmonic is significantly present (~10 dB) above the post-TTX background noise (black dashed–dotted horizontal line).
FIG. 16.
Magnitudes as a function of time for the second-harmonic component (obtained with Gabor transform) of the most relevant signals in Figure 15: CM (green trace; here from Fig. 15B(a), post-TTX), neurophonic (red trace; from Fig. 15D, green trace), pre-TTX RW-dNP (blue trace; from Fig. 15C(a)), and post-TTX RW-dNP (black trace; from Fig. 15C(b)). Also shown are the mean background noise (horizontal dashed dotted lines) and the noise floor (dotted lines; ~maximum noise level and threshold for neurophonic) of the RW-dNP pre-TTX (blue) and post-TTX (black). The slanted blue dashed line is the slope of the masking factor from Figure 13.
DISCUSSION
The aim of the present study was to find a method to extract and measure neural phase locking from the mass potentials at the cochlear RW, as such a method might be applicable to human volunteers with normal hearing. To achieve this goal, different techniques were combined. The main challenge was to separate the phase-locked signal generated by the hair cells, usually referred to as the CM, from the neural phase-locked signal (here denoted as neurophonic). Note that the simple “trick” of alternating the polarity of the stimulus and summing the responses, traditionally used to separate CAP from CM, does not suffice here as the phase of the neural response is also locked to the stimulus so that this procedure removes most of the neural signal as well. To achieve separation, we used signal averaging, forward masking, and filtering. The filtering included noncausal linear FIR filtering, nonlinear denoising (wavelets), Hilbert transformation, spectral analysis (FFT and STFT), and odd/even harmonic separation using stimulus polarity reversals. The technique was first assessed at the AN, then applied at the RW and validated using TTX.
Responses recorded at the AN
A logical place to measure neural phase-locked mass potentials is the AN. This site is also potentially accessible in human subjects undergoing neurosurgery (Moller and Jho 1989). The averaged probe and forward-masked probe responses recorded at the AN (e.g., Fig. 2A(a, b)) of cats showed similarities with those of previous studies (Weinberger et al. 1970; Snyder and Schreiner 1985; Chimento and Schreiner 1990). The probe responses showed a polarity-independent CAP and an alternating component that was phase locked to the stimulus; both components were strongly reduced by a sufficiently strong forward masker (on-frequency tone or broadband noise). We made significant efforts to isolate a signal and metric that capture a purely neural contribution to the alternating potentials measured—the dNP magnitude—and validate the metric with several observations throughout the paper. The strongest arguments that the AN-dNP consists of neural contributions without apparent contamination by CM, are (1) that this component basically completely decays due to the recovery from masking (Fig. 2A(d)) with a rapid time constant of 23.3 ms; (2) the clear onset time lag re. CM (Fig. 4), associated with a delay from the afferent synapses and some additional axonal propagation. In combination with several internal consistency checks (Figs. 4, 5, 6, 7, and 9) these arguments provide a compelling case that the AN-dNP captures neural phase locking. Our recordings also clearly indicate that the CM can make a sizable contribution to the potentials recorded on the AN, here denoted as AN-CM (Figs. 2A(b), 4A, and 6).
Responses recorded at the RW
The most important conclusion from the present study is that there is a sizable and isolatable neural phase-locked contribution that can be measured at the RW: the RW-dNP. The presence of such a contribution had been reported earlier (Henry 1995; Forgues et al. 2013; Lichtenhan et al. 2013). We show here that it is strikingly similar in many ways to the AN-dNP. The main differences were a typically larger magnitude at the RW (compare Fig. 5B, D) and a small time lead at the RW (~100 μs, Fig. 4; Fig. 5B, D).
The RW-dNP and AN-dNP also share properties with the CAP and with single AN fibers. First, the magnitude of the dNP has a linear relationship with masker level (dB SPL) over a dynamic range of 20 to 30 dB, and this up to about 5 to 10 dB above the probe level (Fig. 5), similar to masking intensity curves for CAP (Fig. 5, Verschooten et al. 2012) and single AN fibers (Harris and Dallos 1979). We examined several metrics to best quantify neural phase locking as reflected in the RW-dNP (Figs. 6, 7, 8, and 9). The most satisfactory metric over a wide range of conditions was the maximum magnitude of the fundamental obtained with the Gabor transform (Figs. 8 and 9).
Verification with TTX
As a final check, we verified the method and validated the proposed measure for the neurophonic (maximum magnitude obtained with Gabor method) with the aid of a neural blocker (TTX). We applied the method before and after TTX and came to the following findings. (1) TTX strongly reduced the neural components (i.e., neurophonic, CAP). However, a residual CAP and neurophonic remained, but could be further reduced by masking (Figs. 12, 13, and 15). (2) After the administration of TTX a reduction in CM (−17 %) was noted, similar to previous observations (He et al. 2012). (3) CM canceling by polarity reversals was very efficient and larger than 46 dB, for a 1-kHz probe at 50 dB SPL (Fig. 13). (4) The estimate of the neural contribution obtained by forward masking (RW-dNP) showed an excellent match to the contribution estimated using TTX, both in amplitude and phase (Figs. 12D and 15D). (5) The proposed measure for the neurophonic, derived from the fundamental of the RW-dNP using the Gabor transform, is in excellent agreement with the RW-ttxNP i.e. the neurophonic estimated from TTX (Fig. 12D). Taken together, we demonstrated in various ways that the RW-dNP is close to a purely neural phase-locked signal and is therefore appropriate to derive a measure of neural phase locking.
Use of the second harmonic to measure neural phase locking
As mentioned in the “INTRODUCTION,” neural rectification introduces higher harmonics, which can be used to disambiguate CM and NP. More specifically, a second-harmonic component is present in the summed responses to opposite polarities (e.g., steady-state region, Fig. 15A(a), pre-TTX). Is this polarity-independent response a suitable signal for the determination of the upper frequency limit of phase locking? It was recently studied by Lichtenhan et al. (2013), who refer to this response as the AN overlapped waveform (ANOW) and who stated that it cannot be used to find the upper-phase locking limit of the (human) auditory system. Their reasoning is that, even though neural responses may be synchronized at, e.g., 2 kHz, the effective so-called unit response of each phase-locked action potential has a certain duration (~0.5 ms; Kiang et al. 1976; Prijs 1986), which smoothes out the phase-locked mass potential. Note, however, that this factor does not imply by itself a hard limitation for the detection of phase locking at high frequencies, but rather that it imposes a practical limitation. The low-pass filtering due to the convolving effect of the unit response strongly reduces response magnitude and thus SNR, but it can in theory be overcome by increasing the amount of repetitions or in general measurement time.
Still, we argue, but for another reason, that this neural steady-state second-harmonic component is not suitable to determine the upper limit of phase locking. The post-TTX signals in Figure 15A(a), B(a) show the existence of a significant second-harmonic component in the CM (10 dB SNR; Fig. 16green trace re. post-TTX background noise, black dashed dotted line), which is ~10 dB smaller than the second harmonic of the neurophonic (Fig. 16, red trace) and here dormantly present in the neural background noise (blue dashed dotted line). This means that with increasing probe frequency, the rather frequency-invariant CM (Henry 1995; He et al. 2012) will eventually surpass the steeply declining neurophonic (Snyder and Schreiner 1984b) due to the steep low-pass characteristic (≥40..60 dB/decade) of single-fiber neural phase locking (Weiss and Rose 1988a, b; Kidd and Weiss 1990).
Acknowledgments
This study is supported by BOF (OT/09/50) (Flanders, Belgium).
Conflict of Interest
All (co-)authors have seen and agreed with the contents of the manuscript, and there is no financial interest to report.
Contributor Information
Eric Verschooten, Phone: +32 (0)16 33 03 80, Email: Eric.Verschooten@med.kuleuven.be.
Philip X. Joris, Phone: +32 (0)16 33 03 80, FAX: +32 (0)16 33 07 34, Email: philip.joris@med.kuleuven.be
References
- Antoli-Candela EJ, Kiang NYS. Unit activity underlying the N1 potential. In: Naunton R, Fernandez C, editors. Evoked electrical activity in the auditory nervous system. New York: Academic; 1978. pp. 165–189. [Google Scholar]
- Blackburn CC, Sachs MB. Classification of unit types in the anteroventral cochlear nucleus: PST histograms and regularity analysis. J Neurophysiol. 1989;62:1303–1329. doi: 10.1152/jn.1989.62.6.1303. [DOI] [PubMed] [Google Scholar]
- Bourk TR (1976) In: Electrical responses of neural units in the anteroventral cochlear nucleus of the cat. Ph.D. thesis, MIT
- Chimento TC, Schreiner CE. Time course of adaptation and recovery from adaptation in the cat auditory-nerve neurophonic. J Acoust Soc Am. 1990;88:857–864. doi: 10.1121/1.399735. [DOI] [PubMed] [Google Scholar]
- Dallos P. The auditory periphery. New York: Academic; 1973. [Google Scholar]
- Dolan DF, Xi L, Nuttall AL. Characterization of an EPSP-like potential recorded remotely from the round window. J Acoust Soc Am. 1989;86:2167–2171. doi: 10.1121/1.398477. [DOI] [PubMed] [Google Scholar]
- Eatock RA. Adaptation in hair cells. Annu Rev Neurosci. 2000;23:285–314. doi: 10.1146/annurev.neuro.23.1.285. [DOI] [PubMed] [Google Scholar]
- Eggermont JJ. Electrophysiological study of the normal and pathological human cochlea. II. Neural responses. Rev Laryngol Otol Rhinol Bord. 1976;97(Suppl):497–506. [PubMed] [Google Scholar]
- Forgues M, Koehn HA, Dunnon AK, Pulver SH, Buchman CA, Adunka OF, Fitzpatrick DC (2013) Distinguishing hair cell from neural potentials recorded at the round window. J Neurophysiol [DOI] [PMC free article] [PubMed]
- Galambos R, Davis H. The response of single auditory nerve fibers to acoustic stimulation. J Neurophysiol. 1943;6:39–58. [Google Scholar]
- Goldberg JM, Brown PB. Response of binaural neurons of dog superior olivary complex to dichotic tonal stimuli: some physiological mechanisms of sound localization. J Neurophysiol. 1969;22:613–636. doi: 10.1152/jn.1969.32.4.613. [DOI] [PubMed] [Google Scholar]
- Goldstein MH, Kiang NYS. Synchrony of neural activity in electric responses evoked by transient acoustic stimuli. J Acoust Soc Am. 1958;30:107–114. doi: 10.1121/1.1909497. [DOI] [Google Scholar]
- Harris DM, Dallos P. Forward masking of auditory nerve fiber responses. J Neurophysiol. 1979;42:1083–1107. doi: 10.1152/jn.1979.42.4.1083. [DOI] [PubMed] [Google Scholar]
- He W, Porsov E, Kemp D, Nuttall AL, Ren T. The group delay and suppression pattern of the cochlear microphonic potential recorded at the round window. PLoS ONE. 2012;7:e34356. doi: 10.1371/journal.pone.0034356. [DOI] [PMC free article] [PubMed] [Google Scholar]
- Henry KR. Auditory nerve neurophonic recorded from the round window of the Mongolian gerbil. Hear Res. 1995;90:176–184. doi: 10.1016/0378-5955(95)00162-6. [DOI] [PubMed] [Google Scholar]
- Johnson DH. The relationship between spike rate and synchrony in responses of auditory-nerve fibers to single tones. J Acoust Soc Am. 1980;68:1115–1122. doi: 10.1121/1.384982. [DOI] [PubMed] [Google Scholar]
- Joris PX, Carney LH, Smith PH, Yin TC. Enhancement of neural synchronization in the anteroventral cochlear nucleus. I Responses to tones at the characteristic frequency. J Neurophysiol. 1994;71:1022–1036. doi: 10.1152/jn.1994.71.3.1022. [DOI] [PubMed] [Google Scholar]
- Kiang NYS, Watanabe T, Thomas EC, Clark LF. Discharge patterns of single fibers in the cat’s auditory nerve. 35. Cambridge: MIT Press; 1965. [Google Scholar]
- Kiang NYS, Moxon EC, Kahn AR. The relationship of gross potentials recorded from the cochlea to single unit activity in the auditory nerve. In: Ruben RJ, Elberling C, Salomon G, editors. Electrocochleography. Baltimore: University Park Press; 1976. pp. 95–115. [Google Scholar]
- Kidd RC, Weiss TF. Mechanisms that degrade timing information in the cochlea. Hear Res. 1990;49:181–208. doi: 10.1016/0378-5955(90)90104-W. [DOI] [PubMed] [Google Scholar]
- Lichtenhan JT, Cooper NP, Guinan JJ., Jr A new auditory threshold estimation technique for low frequencies: proof of concept. Ear Hear. 2013;34:42–51. doi: 10.1097/AUD.0b013e31825f9bd3. [DOI] [PMC free article] [PubMed] [Google Scholar]
- Moller AR, Jho HD. Response from the exposed intracranial human auditory nerve to low-frequency tones: basic characteristics. Hear Res. 1989;38:163–175. doi: 10.1016/0378-5955(89)90137-8. [DOI] [PubMed] [Google Scholar]
- Moore BC. The role of temporal fine structure processing in pitch perception, masking, and speech perception for normal-hearing and hearing-impaired people. J Assoc Res Otolaryngol. 2008;9:399–406. doi: 10.1007/s10162-008-0143-x. [DOI] [PMC free article] [PubMed] [Google Scholar]
- Palmer AR, Russell IJ. Phase-locking in the cochlear nerve of the guinea-pig and its relation to the receptor potential of inner hair cells. Hear Res. 1986;24:1–15. doi: 10.1016/0378-5955(86)90002-X. [DOI] [PubMed] [Google Scholar]
- Prijs VF. Single-unit response at the round window of the guinea pig. Hear Res. 1986;21:127–133. doi: 10.1016/0378-5955(86)90034-1. [DOI] [PubMed] [Google Scholar]
- Rhode WS, Smith PH. Characteristics of tone-pip response patterns in relationship to spontaneous rate in cat auditory nerve fibers. Hear Res. 1985;18:159–168. doi: 10.1016/0378-5955(85)90008-5. [DOI] [PubMed] [Google Scholar]
- Rose JE, Brugge JF, Anderson DJ, Hind JE. Phase-locked response to low-frequency tones in single auditory nerve fibers of the squirrel monkey. J Neurophysiol. 1967;30:769–793. doi: 10.1152/jn.1967.30.4.769. [DOI] [PubMed] [Google Scholar]
- Snyder RL, Schreiner CE. The auditory neurophonic: basic properties. Hear Res. 1984;15:261–280. doi: 10.1016/0378-5955(84)90033-9. [DOI] [PubMed] [Google Scholar]
- Snyder RL, Schreiner CE. The auditory neurophonic: basic properties. Hear Res. 1984;15:261–280. doi: 10.1016/0378-5955(84)90033-9. [DOI] [PubMed] [Google Scholar]
- Snyder RL, Schreiner CE. Forward masking of the auditory nerve neurophonic (ANN) and the frequency following response (FFR) Hear Res. 1985;20:45–62. doi: 10.1016/0378-5955(85)90058-9. [DOI] [PubMed] [Google Scholar]
- Tasaki I. Nerve impulses in individual auditory nerve fibers of guinea pig. J Neurophysiol. 1954;17:97–122. doi: 10.1152/jn.1954.17.2.97. [DOI] [PubMed] [Google Scholar]
- Verschooten E, Robles L, Kovacic D, Joris PX. Auditory nerve frequency tuning measured with forward-masked compound action potentials. J Assoc Res Otolaryngol JARO. 2012;13:799–817. doi: 10.1007/s10162-012-0346-z. [DOI] [PMC free article] [PubMed] [Google Scholar]
- Weinberger MM, Kitzes LM, Goodman DA. Some characteristics of the auditory neurophonic. Experientia Basle. 1970;26:46–48. doi: 10.1007/BF01900383. [DOI] [PubMed] [Google Scholar]
- Weiss TF, Rose C. A comparison of synchronization filters in different auditory receptor organs. Hear Res. 1988;33:175–180. doi: 10.1016/0378-5955(88)90030-5. [DOI] [PubMed] [Google Scholar]
- Weiss TF, Rose C. Stages of degradation of timing information in the cochlea: a comparison of hair-cell and nerve-fiber responses in the alligator lizard. Hear Res. 1988;33:167–174. doi: 10.1016/0378-5955(88)90029-9. [DOI] [PubMed] [Google Scholar]


