

Abstract
The mouse has become an important animal model in understanding cochlear function. Structures, such as the tectorial membrane or hair cells, have been changed by gene manipulation, and the resulting effect on cochlear function has been studied. To contrast those findings, physical properties of the basilar membrane (BM) and tectorial membrane (TM) in mice without gene mutation are of great importance. Using the hemicochlea of CBA/CaJ mice, we have demonstrated that tectorial membrane (TM) and basilar membrane (BM) revealed a stiffness gradient along the cochlea. While a simple spring mass resonator predicts the change in the characteristic frequency of the BM, the spring mass model does not predict the frequency change along the TM. Plateau stiffness values of the TM were 0.6 ± 0.5, 0.2 ± 0.1, and 0.09 ± 0.09 N/m for the basal, middle, and upper turns, respectively. The BM plateau stiffness values were 3.7 ± 2.2, 1.2 ± 1.2, and 0.5 ± 0.5 N/m for the basal, middle, and upper turns, respectively. Estimations of the TM Young’s modulus (in kPa) revealed 24.3 ± 25.2 for the basal turns, 5.1 ± 4.5 for the middle turns, and 1.9 ± 1.6 for the apical turns. Young’s modulus determined at the BM pectinate zone was 76.8 ± 72, 23.9 ± 30.6, and 9.4 ± 6.2 kPa for the basal, middle, and apical turns, respectively. The reported stiffness values of the CBA/CaJ mouse TM and BM provide basic data for the physical properties of its organ of Corti.
Keywords: cochlea, stiffness, basilar membrane, tectorial membrane, best frequency, mice
INTRODUCTION
The past decade has brought remarkable advances in the understanding of the micromechanics of the auditory system and its components (Barral and Martin 2011; Brownell et al. 2011; Cheatham and Dallos 2000; Dong and Olson 2009; Eiber 2008; Elliott et al. 2007, 2011; Eze and Olson 2011; Fettiplace 2006; Fisher et al. 2012; Gao et al. 2013; Gavara and Chadwick 2009; Gavara et al. 2011; Gu et al. 2008; He et al. 2008; Hemila et al. 2010; Hong and Freeman 2006; Jacob et al. 2009; Kapadia and Lutman 2000; Kitani et al. 2011; Kolston 2000; Meaud and Grosh 2011, Meaud and Grosh 2010; Naidu and Mountain 2007; Nam and Fettiplace 2012; Ren and Nuttall 2000; Rhode 2007; Santos-Sacchi 2008; Van Dijk et al. 2011; Zhang et al. 2007; Zheng et al. 2007). Quantitative descriptions of basilar membrane motion patterns are available for the base and the apex of the mammalian cochlea (e.g., Olson et al. 2012; Robles and Ruggero 2001). Coherent experimentally based theories of transduction and adaptation in mammalian hair cells have been developed. The motor protein of outer hair cells, prestin, has been identified, and some of its unique properties have been described (e.g. Dallos and Fakler 2002). An understanding of molecular mechanisms of cochlear homeostasis, fluid, and ion balance in the inner ear has been advanced significantly (e.g. Wangemann and Schacht, 1996). Genes responsible for deafness have been identified, along with their phenotypes, and appropriate mouse models are available (e.g. Steel and Kros 2001).
Although these advances are remarkable, fundamental questions remain unanswered. Little is known of how the structures of the organ of Corti and TM move and by what mechanism the patterns of vibration contribute to local mechanical amplification in the cochlea (e.g. Dallos 1992). Experimental results are available that studied the micromechanics of the organ of Corti in excised cochlear preparations, including guinea pig temporal bone preparations, sections of the guinea pig, gerbil cochlea, and the gerbil hemicochlea (Chan and Hudspeth 2005; Edge et al. 1998; Fridberger et al. 2002a, b; Fridberger and de Monvel 2003; Hu et al. 1995, 1999; Jacob et al. 2011; Jia et al. 2007; Karavitaki and Mountain 2007a, b; Karavitaki et al. 1996; Mammano and Ashmore 1993; Morioka et al. 1995; Nowotny and Gummer 2006; Reuter et al. 1992; Richter and Dallos 2001, 2003; Richter et al. 2002, 2000; von Tiedemann et al. 2010). Results have been published using confocal microscopy or optical coherence tomography (OCT) to study micromechanics of the cochlea in vivo (Chen et al. 2007, 2011; Choudhury et al. 2006; Gao et al. 2011, 2013; Masaki et al. 2009; Zha et al. 2012).
Micromechanics of the inner ear are determined by the mechanical properties of its components, including the stiffness of the ™ and BM. Thus, by investigating the physical and dynamical properties of the TM and the BM, a better understanding of the mechanism mentioned above will help to model and understand the micromechanics of the cochlea (e.g. Jones et al. 2013; Lamb and Chadwick 2011; Nam and Fettiplace 2010).
Results from BM and TM stiffness measurements in a mouse species are presented. The mouse was selected because mouse species have become models of choice to study hereditary abnormalities of the human cochlea as well as the effects of genetic manipulations. The homologies between mice and human genomes are well-established, and the hereditary abnormalities are similar (Steel and Brown 1996; Zheng et al. 1999). Such genetically induced abnormalities might manifest themselves in changes of physical properties of cochlear structures and thus result in abnormal cochlear mechanics and cochlear dysfunction (Legan et al. 2000; Masaki et al. 2009). For example, the mutation of the gene that encodes α-tectorin resulted in TM detachment from stereo cilia and disruption of its non-collagenous matrix (Legan et al. 2000). The structural changes caused by this mutation appeared to be limited to the TM, but hearing function was severely compromised. The mutation can be used to study the role of the TM in the hearing process. In the present experiment, the BM and TM driving point stiffness and bulk stiffness were measured in CBA/CaJ mice. The CBA/CaJ mouse strain is commonly used as a control as it has no known genetic mutations affecting inner ear morphology or function. The mice maintain normal cochlear function throughout life and serve more frequently in hearing research as a background for creating new genetic strains. Thus, stiffness data of the CBA/CaJ mouse can be compared with existing cochlear models and future data obtained in knock-out mice or mice with impaired hearing ability.
METHODS
Forces to indent BM and TM were measured in the mice hemicochleae. For the measurements, a piezoelectric cantilever sensor was inserted into the scala tympani or scala media. A displacement was introduced on the sensor, static by advancing the sensor’s base position with a micromanipulator, and a dynamic displacement by moving the sensor sinusoidally at 10 Hz with a second piezoelectric cantilever. The sensor’s response was calibrated for force, which was used to obtain the point stiffness and then analyzed to calculate Young’s modulus. All animal experimental procedures followed the guidelines of the National Institute of Health and were also approved by the Northwestern University Animal Care and Use Committee.
The HemiCochlea Preparation
Mice (CBA/CaJ, ages 8–12 weeks) were used for the experiments. After the mice were anesthetized and euthanized using sodium pentobarbital (200 mg/kg), the bullae were harvested, and the cochleae were isolated. Each cochlea was sliced using a vibrato me (Vibrato me 1000+, Pelco 102, TedPella, USA) with half of a double-edged razor blade. A few drops of cyanoacrylate (Superglue-gel, Loctite, Henkel, OH, USA) were placed onto the rectangular block of the vibrato me tray, and a small rectangular piece of wood was placed in the glue opposite the blade. Before the glue set, the cochlea was positioned in the glue so that the basal turn was lifted onto the wood while the apex slanted downwards towards the blade. A droplet of artificial perilymph was placed over the round window and stapes to prevent dehydration. Next, the cochlea was immersed in medium and the blade aligned with the cochlea’s mid-modiolar plane. Excess glue was trimmed away around the cochlea with some being pushed below the cochlea for extra support. Finally, the amplitude of the vibrato me was turned to 400 μm, and the speed adjusted between 1 and 4 mm/min depending on the ease of the cut. Forceps were placed behind the specimen to stabilize it while slicing. After the blade passed through the entire cochlea, the specimen was gently cut from the block using a razor blade and placed into an artificial perilymph-filled petri dish containing a dab of vacuum grease. The artificial perilymph contained (in mM) 100 lacto bionic acid, 10 HEPES, 81 NaOH, 24 NaHCO3, 45 NaCl, and 5 KCl. The solution was adjusted to pH 7.45 and 305 mosmol. A more detailed description of cutting a hemicochlea has been published previously (Teudt and Richter 2007).
The time between decapitation of the animal and the first measurement was typically 30 min, and the results obtained within the first hour after euthanasia of the animal were used. Furthermore, only data from hemicochlea preparations classified as good or excellent were included for presentation and analysis here. For a hemicochlea to be classified as good, the following morphological features had to be evident: the TM was not lifted away from the reticular lamina, the hair cells were not swollen, the BM appeared straight, and the outer pillar cells were not bent.
Distance of the Cut Edge from the Apex
In 11 hemicochleae, the bony shell and stria vascular were removed turn by turn, starting at the apex. Using an upright microscope, pictures of every half-turn segment of the hemicochlea were captured with a CCD camera and displayed on a monitor. By tracing the heads of the pillar cells and completing every half-turn segment on the monitor by using Image J (Wayne Rasband, NIH, public domain software), a complete circumference could be measured for every turn. Thus, it was possible to determine the distance from each cut edge to the cochlear apex. Before distance measurements were made, the program’s scale was calibrated and the scale setting was changed from pixels to micrometers. This conversion was accomplished by determining the number of pixels between two lines of the image of a standard slide having 10-μm divisions. The pixel size corresponded typically to 7.5 μm.
Piezoelectric Sensor
The sensor for stiffness measurements (Fig. 1) consisted of a needle tip (~10 μm), which was attached to a piezoelectric “sensor bimorph,” attached in turn to a piezoelectric “driver bimorph.” The driver bimorph was used to deliver a 10-Hz sinusoidal motion to the sensor bimorph and needle. The sensor bimorph voltage, acquired by the way of its flexion, was proportional to the deflection of the needle tip. To characterize the mechanical properties of the sensor, three parameters were measured: (1) the sensor sensitivity, which was the smallest measurable deflection of the needle tip above the noise floor, (2) the stiffness of the sensor, and (3) the sensor’s response while placed in fluids without touching any tissue. The noise floor was the peak-to-peak amplitude of the recordings while the sensor did not touch the tissue and was not moved. For the calibration, our piezoelectric sensor was fixed in a holder, and the needle tip was deflected with a second bimorph (PZL007, Burleigh Instruments Incorporation; displacement to a voltage ratio of 4.67 nm/V). The resulting voltage, obtained for different needle tip deflections, was recorded. The sensor voltage increased linearly with a slope of 0.082 V/μm from the noise floor level (dotted line in Fig. 2). The smallest deflection was 20 nm. As shown in Figure 2, the sensor’s response curve lost its linearity with values smaller than 1 mV as indicated by the dashed line. Stiffness calibration of the sensor was performed in front of an objective with eyepiece reticular by hanging known weights on the sensor tip. Thus, the deflection of the sensor tip could be measured, and the stiffness was calculated by dividing the force by the deflection, where ksensor denotes the stiffness of the sensor, m the mass attached to the sensor, g the gravitational constant, 9.81 m/s2, and x the deflection. The sensor’s stiffness ksensor was 2.71 N/m. The corresponding smallest force, which was measurable with the sensor system at a 20-nm deflection, was 0.054 μN.
FIG. 1.
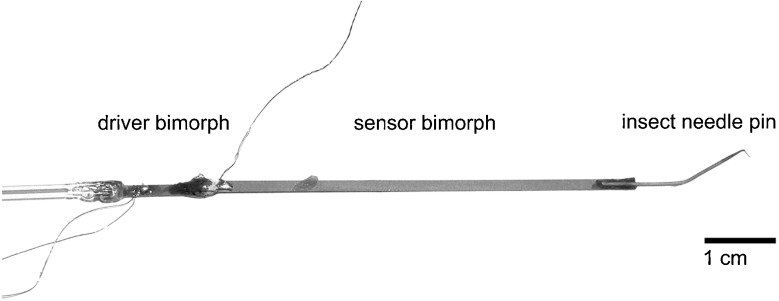
The sensor used for the stiffness measurements consisted of an insect needle pin, sensor bimorph, driver bimorph, and a glass rod. All components were attached to each other with cyanoacrylate. The sensor tip diameter was about 10 μm.
FIG. 2.

Sensor response voltage measured from the sensor bimorph is plotted versus the sensor tip displacement. Voltage decreased linearly with a slope of 0.082 V/μm until the sensor’s noise floor of 1 mV (dashed line) was reached.
The quality of the sensor was also tested by measuring a known stiffness (Fig. 3). The reference stiffness probes were cantilevers, which were purchased from Nano World Innovative Technologies. Values of the measured and provided stiffness were not significantly different (p < 0.05).
FIG. 3.

Cantilever tips of an atomic force microscope (50-μm wide, 450-μm long, and 2–5-μm thick) were chosen to test the sensor’s validity by measuring a known stiffness. The cantilever stiffness provided by the manufacturer was between 0.2 and 1.6 (N/m), dependent on the cantilever. The measured stiffness values were similar to the provided stiffness values. Differences were not statistically significant (paired t test, p < 0.05).
The sensor is not an ideal system. In addition to its stiffness, the sensor has inertia. The resonance frequency of the system is about 50 Hz, and the vibration frequency of 10 Hz, which was used for the measurements, is about 2.3 octaves below the resonance frequency of the sensor. When the sensor bimorph was moved at 10 Hz in the fluid and the needle tip still not touching the tissue, a response could be recorded. After the needle tip made contact with the tissue, the sensor was loaded and a phase and amplitude change could be seen in the recordings. Response amplitudes and phases were determined for the 10-Hz voltage response measured at each static displacement step. A static step was achieved by advancing the sensor’s base by 1 μm with the micromanipulator. In order to correct for intrinsic inertial forces caused by the combined mass of the needle and the sensor bimorph, a set of ten measurement waveforms with the sensor in the fluid before contacting the tissue was selected from the initial steps of the sensor advancement. The ten measurement waveforms were averaged and subtracted from all measurement waveforms measured in the series. By averaging and subtracting the entire waveforms, both magnitude and phase information were included in the inertia correction. After this correction, the magnitude of each measurement waveform was computed and converted to a stiffness value based on the sensor calibration data as described above. Viscous forces at a 10-Hz measurement frequency were assumed to be negligible based on the observation that the response from the sensor did not change before and after immersing the sensor tip into the bathing fluid.
Stiffness Measurements
A hemicochlea in a petri dish was placed on the stage of a Leitz Ergolux AMC upright microscope, and one cochlear turn was selected for measurements (Fig. 4). The microscope sat on a vibration isolation table (Newport, model RS4000TM) and was fitted with a ×10 Nikon water-immersion objective. Oblique illumination was provided by red-light emitting diodes (LEDs). The sensor tip was initially placed at about 20 μm from the surface of the structure to be measured and about at 100 μm from the cut edge of the preparation. The sensor base was then advanced in steps of 1 μm towards and onto the tissue (Figs. 5–7).
FIG. 4.

Cochlear cross-sectional view in the apical turn of a CBA/CaJ mouse hemicochlea. The short arrows indicate the sites of sensor tip positioning for stiffness measurements at the BM and TM. Notice that the tip is approximately at the middle of the pectinate zone of the BM or at the middle of the upper surface of the TM. Radial and longitudinal directions within the cochlea are indicated by long arrows.
FIG. 5.

A Sketch of the sensor system and its systematic approach to the target tissue. For each step of the measurement, the base to which the stiffness sensor is mounted is advanced by 1 μm (Δx base-static = 1 μm). If the tip of the stiffness sensor does not touch any object, the tip will also advance by 1 μm and Δx tip-static = 1 μm. In case the tip touches tissue, the base still will advance by 1 μm (Δx base-static), but the tip will advance less Δx tip-static = 1 μm- x deflect-dynamic. The deflection of the stiffness sensor equals the amount the tip advancement will be less than the base advancement or, in other words, the tip advancement plus the deflection are same as the base advancement (Δx tip-static + x deflect-dynamic =Δx base-static). B shows a representative example of the point stiffness as a function of sensor base and sensor tip position. C shows the increase in point stiffness with the advancement of the sensor. The stiffness increases from the noise floor over a small range to a plateau. Beyond the plateau, the stiffness increases in a non-linear fashion. Data are fitted to the function k(x) = k plateau + A(x − x offset)2 (see also text) to determine the value for the plateau stiffness.
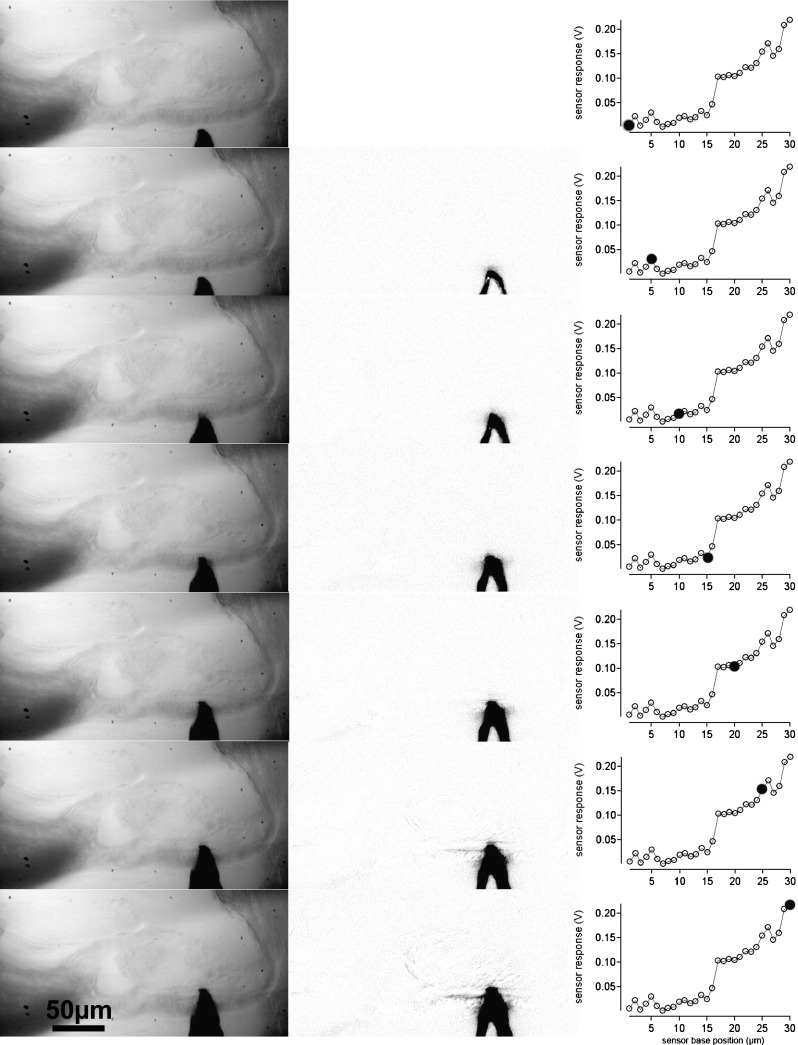
FIG. 7.
Indentation of the measuring sensor in the TM. In the left column, the measuring sensor is shown at different distances from the TM and after indentation. The middle column is the difference of the image in the left column and the first image in the left column. If no displacement occurred, the image is gray or white. The darkened areas show the displacements of the sensor or tissue structures in the difference images. The right column provides the corresponding sensor responses. Filled circles show at which point during the advancement of the sensor base the image has been taken.
To access the BM in apical cochlea turns, in some cases, the bony separation between middle and apical turns had to be partially removed. For measurements at the apical TM, parts of the cochlear capsule had to be removed as well.
Driving Point Stiffness
The approach is not novel and has been described in the literature before (Emadi et al. 2004; Richter et al. 2007). In short, the stiffness measurements were conducted with the assumption that a sensor with known stiffness ksensor can be used to determine an unknown stiffness ktissue by pushing the sensor against the tissue and measuring the sensor’s deflection. For the measurements, the base of the sensor was moved by a known distance (static displacement) Δxbase-static = 1 μm towards and onto the tissue (Figs. 5A–7). After the base had been moved by Δxbase-static, the sensor tip was vibrated at 10 Hz. While the needle did not contact the tissue, the amplitude of the vibration at the sensor tip was 1μm peak (Δxtip-dynamic = 1 μm). After the needle tip made contact with the tissue, the load of the tissue on the sensor deflects the sensor, xdeflect-dynamic, which was determined from the voltage reading from the sensor by dividing the voltage reading by the sensitivity of the sensor. The movement of the needle tip was Δxtip-dynamic = 1 μm−xdeflect-dynamic. In other words, before the sensor touches the tissue, it is not deflected (xdeflect-dynamic = 0), and the needle tip position is the same as the sensor base position, xtip-static = xbase-static, and after the needle touches the tissue, the needle is deflected (xdeflect-dynamic >0) and Δxtip-dynamic <1. In the current setup, the sensor bimorph can only record dynamic deflections but no static compressions. Therefore, only the exact static position of the sensor base, xbase-static, and the dynamic deflection of the needle tip (xdeflect-dynamic) was known during the experiments. The static position of the needle tip xtip-static was calculated iteratively using the dynamic deflections of the sensor based on the relative values of the sensor input stiffness and the stiffness of the tissue. The advancement of the needle tip, Δxtip-static, was then calculated as follows:
 |
A representative example that shows the point stiffness as a function of sensor base and sensor tip position is shown in Figure 5B.
For the measurements, it has been assumed that the tissue response is dominated by its elastic reactance. Contributions of the inertial reactance have been estimated for the apical turn, where the tissue is more compliant and the inertial reactance is closer to the elastic reactance. From the experiments, we determined that the average plateau stiffness (see also below) for the tectorial membrane is 0.09 N/m. The corresponding sensor deflection is about 32 nm, which corresponds to an average force of about 87 nN. At the apical measurement site, the cross-sectional area of the organ of Corti and tectorial membrane is 3,448 and 6,622 μm2, respectively. The section moved of the sensor is about 10 μm. Assuming that the tissue density is close to water (1,000 kg/m3), the estimated mass is about 101*10−12 kg. At 10 Hz with a peak displacement of the tissue of 968 nm, the peak acceleration is 3.4*10−3 m/s2 and the peak inertial force can be estimated to ~0.3 pN. The elastic force of 87 nN is estimated with a sensor tip size of 10 μm in diameter. The corresponding inertial force from this segment would several orders of magnitude smaller than the elastic force. Mass effects have not been considered in the analysis of the experiments.
Plateau Stiffness
The examples in Figure 5C and in Figures 6 and 7 show that the point stiffness increases from the noise floor over a small range of tissue displacement to a plateau. Following this small plateau, the stiffness further increases for a larger deflection of the tissue. While the initial rise in stiffness can be attributed to the coupling of the sensor to the tissue, it has been argued that the plateau reflects the relevant stiffness of the tissue. It has been assumed that the tissue can be approximated by a system of parallel and radially oriented beams and that the return force on the sensor results from the increasing number and stiffness of those beams (Emadi et al. 2002; Emadi and Richter 2008; Emadi et al. 2004; Gummer et al. 1981; Miller 1985; Richter et al. 2007; Vôldrich, 1978). In other words, the plateau stiffness has been suggested to reflect the stiffness of the embedded collagen fibers. In the present study, this plateau stiffness is used as a basis to compare the stiffness at different locations along the cochlea. The increasing, non-linear, stiffness beyond the plateau stiffness may be explained with the underlying beam model. While for small displacements the return force from the beam is approximately linear to the deflection of the beam and the resulting stiffness is constant, for larger deflections, tangential forces within the beam dominate the restoring force, and the stiffness increases quadratically. The plateau stiffness has, therefore, been extracted fitting the following function:
 |
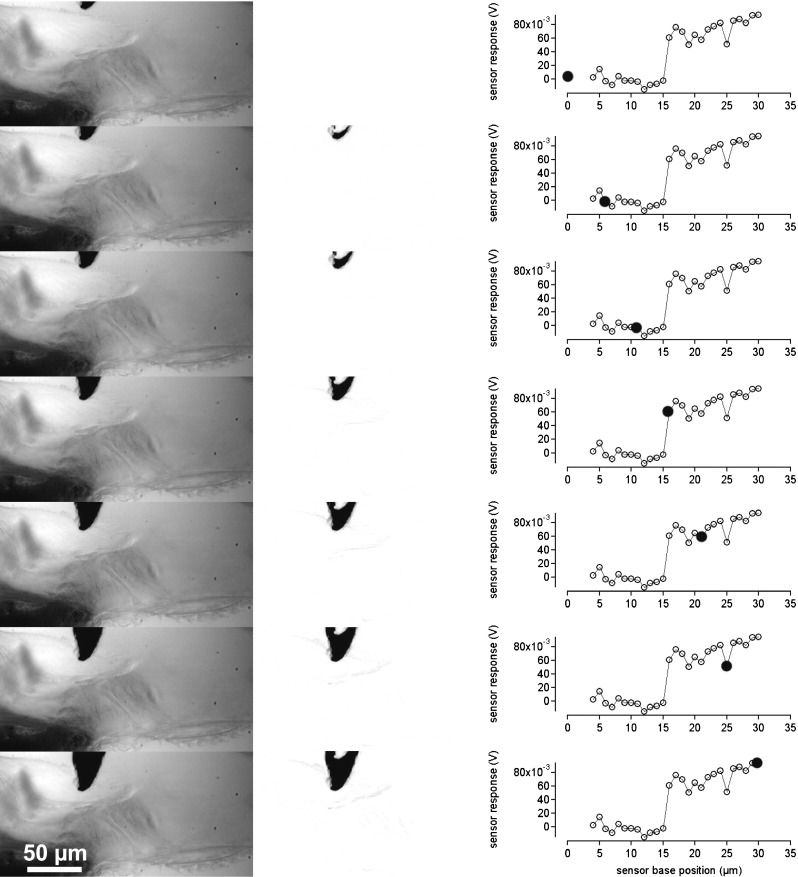
FIG. 6.
Indentation of the measuring sensor in the BM. In the left column, the measuring sensor is shown at different distances from the BM and after indentation. The middle column is the difference of the image in the left column and the first image in the left column. If no displacement occurred, the image is gray or white. The darkened areas show the displacements of the sensor or tissue structures in the difference images. The right column provides the corresponding sensor responses. Filled circles show at which point during the advancement of the sensor base the image has been taken.
where k(x) is the stiffness at tip position x, and A and xoffset are the parameters for the parabolic portion of the curve. An example for the fit of the function is shown in Figure 5C.
Young’s Modulus E
In order to compare the results with data in the literature, Young’s modulus was extracted from the measurements using a model describing a sphere indenting an elastic material (Dimitriadis et al. 2002; Shoelson et al. 2004). The model is based on Hertz’s description of a spherical sensor indenting an elastic isotrophic material. A detailed derivation of the model is given in Dimitriadis et al. (2002). In the present study, it has been assumed that the sample (TM) is not bonded to the supporting substrate (reticular lamina). The force F can be calculated as follows:
 |
where F denotes the applied force, δ the resulting indentation, E the Young’s modulus, R the radius of the indenter, and  ; the thickness of the specimen is given by h. Young’s modulus was determined by fitting the model to the measured force and deflection data. The other fitting parameters were either constrained or kept constant. The sensor radius was kept fixed during the fitting procedure, and TM height was limited between 10 and 50 μm.
Since there are multiple models that can be used to estimate Young’s modulus, one has to be aware of some limitations of the approach chosen here. A modified Hertz model was selected because the TM and the BM are assumed to be elastic layers (of known thickness). For the measurements, it has been assumed that the structures are indented but not displaced. However, it is possible that the lower surface of the TM or the upper fiber band of the basilar membrane is not “rigid” and that the entire structure bends or is displaced during the measurements. Two methods were applied to confirm that the bending or displacement of the structure under investigation was negligible: (1) visual observation and (2) image subtraction. During visual observation of the displacement of the sensor and the TM/BM, for indentations of 15 μm with the sensor, no obvious displacements of the entire structure could be detected. The raw visual observations were supplemented using image subtraction in NIH image. An example is provided for the BM (Fig. 6) and for the TM (Fig. 7). In the left, column images with the sensor tip are shown. The middle columns show the changes referenced to the first (top) image. If no movement occurred in a particular region, the corresponding region in the difference image should be white or gray. However, if a structure was displaced, it shows up as a darkened region on the difference image. Corresponding voltage responses of the sensor during the measurements are shown in the right columns. For large sensor base advances (>15 μm) after contact with the tissue movement is seen on the reticular lamina side of the TM. Any bulk displacement of the TM or BM would result in an overestimation of the indentation and a subsequent underestimation of Young’s modulus. On the assumption that the relative displacements quantified in Figures 6 and 7 are representative of those across an entire measurement series for each of our experiments, it is possible to quantify the extent to which the extracted Young’s modulus value might be underestimated. If the indentation is assumed to be actually 20 % smaller than the values being used, Young’s modulus would be underestimated by about 13 %.
Another concern could be that the sensor penetrated the tissue. Penetration of the TM and BM would lead to erroneous stiffness data. Inspection of the images captured during the indentation of the TM and BM membrane showed displacement after large sensor base advances (>15 μm) but no penetration of the tissue. The structures of the TM and BM followed the contour of the indenter. Furthermore, abrupt retraction of the indenter left an indentation, which slowly disappeared while the TM and BM returned to its normal contour.
For Young’s modulus calculations, it is also important to determine the point at which the sensor first touches the structure. Initially, this zero point was guessed by visual inspection of the plot of static sensor base position versus static sensor compression. After the first estimate of Young’s modulus, the chi-square value of the goodness of fit between the model and data was calculated. The zero point was then changed by increments of one in the positive and negative directions. The reported value for Young’s modulus was obtained from the fit with the lowest chi-square value. In general, the initial guess for the zero point yielded the lowest chi-square value.
Statistics
Mean and standard deviation of the data were calculated (Igor, Wavemetrics). An analysis of variance (ANOVA) was performed to test whether values of the mean driving point stiffness and the Young’s modulus at different locations were equal. The Tukey test was used for pairwise comparison of the data. Test decisions were made for p = 0.05.
RESULTS
In the following, values are given as averages ± one standard deviation.
Distances of all three cut edges of the hemicochleae were measured starting at the cochlear apex. The values were 1.69 ± 0.2, 2.55 ± 0.4, and 4.52 ± 0.5 mm, for the apical (n = 11), middle (n = 11), and basal (n = 11) cut edge, respectively. For graphing reasons, all distances were transformed into distances calculated from the cochlear base, using data of total BM length measurements in CBA/CaJ mice, obtained in previous studies (Keiler and Richter 2001). Thus, stiffness measurements were taken at 4.15, 3.29, and 1.32 mm distances from the cochlear base.
Young’s modulus was obtained in CBA/CaJ mice and reported for the BM and TM. Furthermore, driving point stiffness values were computed for each structure.
BM Young’s Modulus
Mean values measured at the BM pectinate zone in kilopascal (kPa) were 76.8 ± 72.0 (n = 16) for the basal turns, 23.9 ± 30.6 (n = 12) for the middle turns, and 9.4 ± 6.2 (n = 20) for the apical turns (Fig. 8 and Table 1).
FIG. 8.

A shows all measured Young’s modulus values of the BM in CBA/CaJ mice. Values were obtained for the basal, middle, and apical turns of the cochlea. B depicts all Young’s modulus data for the TM, obtained at the same longitudinal cochlear position as in described in A.
TABLE 1.
Young’s modulus data, including their mean values, measured in different hemicochleae summarized for the BM and TM, respectively. Values are given as averages in kPa
| Basilar membrane | Tectorial membrane | |||||
|---|---|---|---|---|---|---|
| Turn | Basal | Middle | Apical | Basal | Middle | Apical |
| Measured data | 125.90 | 24.03 | 16.71 | 29.67 | 11.80 | 2.71 |
| 21.62 | 28.00 | 12.49 | 82.27 | 15.00 | 3.43 | |
| 40.16 | 30.20 | 13.22 | 34.37 | 1.73 | 4.27 | |
| 6.21 | 13.41 | 7.60 | 20.25 | 4.58 | 1.49 | |
| 141.45 | 115.38 | 5.48 | 10.39 | 10.31 | 0.04 | |
| 233.06 | 7.15 | 0.05 | 67.85 | 1.07 | 0.38 | |
| 52.49 | 6.96 | 7.95 | 10.80 | 6.10 | 1.14 | |
| 3.11 | 14.04 | 15.71 | 32.23 | 3.01 | – | |
| 102.52 | 3.33 | 4.60 | 8.69 | 0.93 | – | |
| 214.51 | 30.90 | 6.74 | 4.30 | 1.06 | – | |
| 13.13 | 5.70 | 18.33 | 5.39 | 5.18 | – | |
| 30.51 | 7.31 | 15.50 | 5.33 | 2.34 | – | |
| 8.23 | – | 5.78 | 4.48 | 1.19 | – | |
| 103.17 | – | 4.92 | – | 6.95 | – | |
| 64.09 | – | 3.19 | – | – | – | |
| 68.12 | – | 10.88 | – | – | – | |
| – | – | 22.81 | – | – | – | |
| – | – | 3.48 | – | – | – | |
| – | – | 11.37 | – | – | – | |
| – | – | 1.86 | – | – | – | |
| Average | 76.8 | 23.9 | 9.4 | 24.3 | 5.1 | 1.9 |
| SD | 72.0 | 30.6 | 6.2 | 25.2 | 4.5 | 1.6 |
All data reflect Young’s modulus [kPa]
TM Young’s Modulus
The modulus at the TM in kPa was 24.3 ± 25.2 (n = 13) for the basal turns, 5.1 ± 4.5 (n = 14) for the middle turns, and 1.9 ± 1.6 (n = 7) for the apical turns (Fig. 8 and Table 1).
The ANOVA was significant for the BM (DF = 2, Fc = 3.49, p < 0.001) and TM (DF = 2, Fc = 3.30, p < 0.001) Young’s modulus data. A pairwise comparison of the mean values using the Tukey HSD test revealed for the BM: base vs middle cut edge p = 0.0009, base vs apical cut edge p = 0.00013, and middle vs apical cut edge p = 0.65. For the TM pairwise comparison, the values were as follows: base vs middle cut edge p = 0.01, base vs apical cut edge p = 0.014, and middle vs apical cut edge p = 0.9.
BM Driving Point Stiffness
Stiffness values for the BM are shown for three different locations along the cochlea (Fig. 9 and Table 2). Stiffness values in N/m were 3.7 ± 2.2 (n = 11), 1.2 ± 1.2 (n = 12) and 0.5 ± 0.5 (n = 20), for the basal, middle and apical turns, respectively.
FIG. 9.

A and B show basic driving point stiffness measurements obtained at the BM and TM in CBA/CaJ mice. The green graphs show recordings from the apical turn, the blue and red graphs depict measurements from the middle and basal turn, respectively. C and D show all the corresponding plateau stiffness values from the recordings shown in A and B. Plateau stiffness was determined as described in methods and Figure 5c.
TABLE 2.
Driving point stiffness data, including their mean values, measured in different hemicochleae summarized for the BM and TM, respectively. Values are given as averages in N/m
| Basilar membrane | Tectorial membrane | |||||
|---|---|---|---|---|---|---|
| Turn | Basal | Middle | Apical | Basal | Middle | Apical |
| Measured data | 8.263 | 1.77 | 0.28 | 0.602 | 0.251 | 0.083 |
| 3.457 | 1.47 | 0.496 | 1.212 | 0.490 | 0.049 | |
| 1.528 | 1.726 | 0.708 | 1.184 | 0.360 | 0.057 | |
| 4.634 | 4.367 | 0.405 | 1.636 | 0.154 | 0.033 | |
| 5.274 | 0.201 | 1.2 | 0.266 | 0.088 | 0.033 | |
| 1.904 | 0.633 | 0.720 | 0.469 | 0.199 | 0.086 | |
| 1.550 | 0.526 | 0.680 | 0.236 | 0.144 | 0.289 | |
| 1.390 | 2.038 | 0.960 | 0.930 | 0.091 | – | |
| 4.889 | 0.464 | 2.150 | 0.278 | 0.143 | – | |
| 5.145 | 0.621 | 0.334 | 0.278 | 0.076 | – | |
| 2.675 | 0.488 | 0.097 | 0.277 | – | – | |
| – | 0.330 | 0.238 | 0.403 | – | – | |
| – | – | 0.169 | 0.154 | – | – | |
| – | – | 0.084 | – | – | – | |
| – | – | 0.184 | – | – | – | |
| – | – | 0.068 | – | – | – | |
| – | – | 0.143 | – | – | – | |
| – | – | 0.155 | – | – | – | |
| – | – | 0.163 | – | – | – | |
| – | – | 0.380 | – | – | – | |
| Average | 3.7 | 1.2 | 0.5 | 0.6 | 0.2 | 0.09 |
| SD | 2.2 | 1.2 | 0.5 | 0.5 | 0.1 | 0.09 |
All data reflect driving point stiffness [N/m]
TM Driving Point Stiffness
Stiffness values for the TM are shown for three different locations along the cochlea (Fig. 9 and Table 2). For the TM the stiffness values in N/m were 0.6 ± 0.5 (n = 13), 0.2 ± 0.1 (n = 10) and 0.09 ± 0.09 (n = 7) for the basal, middle and apical turns, respectively.
All values were calculated following average fitting curves for the stiffness-indentation graphs (see Figs. 6 and 7) of the respective cochlear turns. The ANOVA was significant for the BM (DF = 2,, Fc = 3.38, p < 0.01) and TM (DF = 2, Fc = 3.35, p < 0.01) data. A pairwise comparison of the mean values using the Tukey HSD test revealed for the BM: base vs middle cut edge p = 0.001, base vs apical cut edge p = 1.8*10−7, and middle vs apical cut edge p = 0.27. For the TM pairwise comparison the values were as follows: base vs middle cut edge p = 0.017, base vs apical cut edge p = 0.006, and middle vs apical cut edge p = 0.78.
Only hemicochleae that were considered as good were used for analysis. However, driving point stiffness could not be determined in all of those samples because in some samples, the sensor advancement after the sensor tip contacted the tissue was too small to get a reliable point stiffness measurement. More samples could be used for the fitting procedure estimating Young’s modulus since lesser indentation in the tissue could be used for the fitting procedure. Consequently, a difference in sample size for driving point stiffness and Young’s modulus exists.
DISCUSSION
BM stiffness has been determined by several groups. The stiffness was measured in the guinea pig (Gummer et al. 1981; Miller 1985), the gerbil (Emadi et al. 2004; Naidu and Mountain 2001, Naidu and Mountain 1998; Olson and Mountain 1991, 1994) and the human cochlea (von Békésy, 1960). In a recent review by Olson and coworkers, it was emphasized that von Békésy showed an area displacement of the basilar membrane while applying a pressure to the membrane. Converting the stiffness data available form Newton per meter (N/m) to Pascal per meter (Pa/m), Olson et al. were able to directly compare the data reported by the different studies. Still, to our knowledge, no mouse BM stiffness data have been published so far. Available data are summarized in Table 3.
TABLE 3.
BM stiffness values measured by previous authors
| Basilar membrane | ||||
|---|---|---|---|---|
| Author | Species | Point stiffness (N/m) |
Probe diameter (μm) |
Notes |
| von Békésy 1960 | Human | 0.034–1.9 | ~150 | Bending hair probe, fixed cadaver, from apex to base |
| Miller 1985 | Guinea pig | 0.16–0.8 | 10 | 1st region, 0.9–2.5 mm from stapes, static |
| Gummer et al. 1981 | Guinea pig | 0.25–0.8 | 25 | 1st plateau, 0.8–2.3 mm from stapes, 40 Hz |
| Olson and Mountain 1991 | Gerbil | 0.2–1.2 | 25 | 1st plateau, 1.3–1.4 mm from stapes, 80 Hz |
| Olson and Mountain 1994 | Gerbil | 2–10.5 | 20 | Multiple location, 1.3–1.4 mm from stapes, 40 Hz |
| Naidu and Mountain 1998 | Gerbil | ~0.2–11 | 10 | Multiple location, 12, 8 and 1–4 mm from stapes, 40 Hz |
| Emadi et al. 2004 | Gerbil | 0.05–1 | 25 | Multiple radial locations, apex to base, 10 Hz |
| Emadi and Richter 2008 | Gerbil | 0.05–0.079 | 26 | 1 plateau, 2.9 and 7.3 mm from stapes, 10 Hz |
| Teudt and Ricther | Mouse | 0.5, 1.2, 3.7 | 10 | 1 plateau, 4, 15, 29 and 1.32 mm from stapes, 10Hz |
Furthermore, stiffness measurements were made on isolated TM (Freeman et al. 2003a, b; Gueta et al. 2006, 2008, 2011; Shoelson et al. 2004), in vitro (Emadi et al. 2002; Richter et al. 2007; von Békésy, 1960) and in vivo (Zwislocki and Cefaratti 1989; Zwislocki et al. 1988). Some experimental sets were obtained from different sites along the cochlea, and a longitudinal gradient could be determined (Emadi et al. 2002, 2004; Gueta et al. 2006, 2011; Richter et al. 2007; von Békésy, 1960). Recently, efforts have been made to determine the impedance of isolated tectorial membranes (Gavara and Chadwick 2010; Jones et al. 2013). Available data are summarized in Table 4.
TABLE 4.
TM stiffness values measured by previous authors
| Tectorial membrane | ||||
|---|---|---|---|---|
| Author | Species | Point stiffness | Probe diameter | Notes |
| von Békésy 1960 | Human | 0.1 N/m | ~150 μm | Bending hair probe, fixed cadaver, from apex to base |
| Zwislocki and Cefaratti 1989 | Gerbil | 0.116–0.125 N/m | nn | Bending micropipette, 2nd turn |
| Richter et al. 2007 | Gerbil | (transv.) 0.005–0.16 N/m | 25 μm | 1 plateau, apex to base, 10 Hz |
| Richter et al. 2007 | Gerbil | (radial) 0.007–0.28 N/m | 25 μm | 1 plateau, apex |
| Shoelson et al. 2004 | Guinea pig | Shear modulus 1.3–9.8 KPa | ~10 μm | AFM cantilever, multiple locations, apex to base, 1–2 Hz |
| Abnet and Freeman 2000 | Mouse | 0.3–0.11 N/m | ~20 μm | Magnetic beads, isolated TM, apical 1.5 turns, 10 Hz |
| Freeman et al. 2003a | Mouse | 0.06–0.34 N/m | ~20 μm | Magnetic beads, isolated TM, apical 1.5 turns, 10 Hz |
| Masaki et al. 2006 | Mouse | 0.009 N/m | No probe | Osmotic stress |
| Gueta et al. 2006 | Mouse | 0.008–0.015 N/m | 40 nm | AFM cantilever, isolated TM, apex to base, 2 Hz |
| Ghaffari et al. 2007 | Mouse | Shear modulus 17–47 KPa | No probe | Floating in fluid chamber, 1–40 KHz, apical and basal TM |
| Gu et al. 2008 | Mouse | 0.36–0.41 N/m | nn | Shearing probe, isolated TM, apical 1.5 turns 0.01–9 KHz |
| Gueta et al. 2008 | Mouse | 1.9–10.5 N/m | ~2 μm | AFM cantilever, apex to base, 2 Hz |
| Gavara and Chadwick 2010 | Guinea pig | Young’s modulus 3.3–14 KPa | 10 μm | Oscilliation of bead on FM-AFM cantilever |
| Teudt and Ricther | Mouse | 0.09, 0.2, 0.6 N/m | 10 μm | 1 plateau, 4.15, 3.29 and 1.32 mm from stapes, 10 Hz |
In contrast to previous experiments, the measurements in the present study were made in the mouse hemicochlea, which allowed determining the driving point stiffness of the BM and the TM in situ at multiple locations along the cochlea. Simultaneous access to these locations provides an ideal tool to study cochlear stiffness gradients. Here, the experiments were able to quantify the stiffness gradient at a level of p = 0.05 for the BM and the TM in the CBA/CaJ mouse strain, a gold standard for mice in hearing research.
Basilar Membrane
Von Békésy was the first to measure the stiffness of the BM along the cochlea (von Békésy, 1960). He reported that the elasticity of the cochlear partition changed by a factor of 100 from the base to the apex of the 35-mm-long human cadaver cochlea. Despite the basic concerns regarding the freshness of his cadaver preparations (e.g. Vôldrich, 1978), his magnitude for the base-to-apex stiffness gradient is remarkably close to more recently reported values for the BM (Emadi et al. 2004; Naidu and Mountain 1998). Measurements of BM stiffness have also been obtained in guinea pig (Gummer et al. 1981; Miller 1985) and in gerbil (Naidu and Mountain 1998; Olson and Mountain 1991, 1994). All of these investigators have provided data on point stiffness as a function of tissue deflection for each recording site. Gummer et al. (1981), who made measurements in excised guinea pig cochleae (1 h postmortem) on the scala tympani side of the BM near the base of the cochlea (0.8 to 2.3 mm from the base), observed an initial constant “plateau” of stiffness (corresponding to linearly elastic behavior) extending over a deflection range of 1 to 3 μm after initial contact with the tissue, followed by a quadratic growth of stiffness with further increases in deflection. Miller (1985) made BM compliance measurements at radial positions spanning the width of the BM in excised guinea pig cochleae at locations 1.0–2.5 mm from the base. She observed three distinct plateaus of stiffness with divisions between the segments occurring at average tissue deflections of 2.4 and 4.7 μm. Olson and Mountain (1991) observed as a function of increasing tissue deflection near the center of the gerbil BM an initial stiffness plateau, a rise in stiffness over a short distance, followed by a second plateau of stiffness, and a quadratic increase in stiffness beyond the second plateau. Extending their point stiffness measurements to positions spanning the entire width of the BM, Olson and Mountain (1994) found that, near the spiral lamina and the spiral ligament, the stiffness increased relatively steeply with increasing tissue deflection. At the arcuate zone (below the fluid-filled tunnel of Corti), they observed that the BM was initially relatively compliant and exhibited a monotonic increase in stiffness with increasing tissue deflection. Below the foot of the outer pillar cell, the BM exhibited a relatively stiff plateau followed by a quadratic increase in stiffness with increasing deflection. The magnitude of the plateau stiffness measured at the pectinate zone was between those measured at the arcuate zone and below the outer pillar foot. Naidu and Mountain (1998) made stiffness measurements in an in vitro gerbil cochlear turn preparation. They examined the longitudinal gradient of BM stiffness by measuring at locations near 1–4, 8, and 12 mm from the base of the gerbil cochlea. According to their data, the BM stiffness decreased by a factor of 56 from the base to the apex at radial locations below the outer pillar foot, below the outer hair cells, and below Hensen’s cells. At the arcuate zone, the stiffness decreased by a factor of 20 from base to apex. Emadi et al. (2004) determined stiffness of the gerbil BM at several radial and longitudinal locations. Determining the driving point stiffness in CBA/CaJ mice, only one plateau stiffness could be observed in most of the experiments. The plateau occurred after a sensor indentation of approximately 10 μm into the tissue.
Fit functions for the plateau stiffness versus cochlear base distance were reported by Emadi et al. (2004) and Naidu and Mountain (2001, 1998). Their stiffness data measured at the pectinate zone of the gerbil BM decreased towards the apex following ln (k) = 10.24–4.43× and ln (k) = 1.75–0.31×, respectively. BM driving point stiffness data in CBA/CaJ mice decreased towards the apex following the fit function ln (k) = 2.1–0.64×. Since no previous stiffness measurements were obtained in mouse BM, the here presented stiffness values were compared to the neural mapping data of Müller et al. (2005), Figure 10. Corresponding sites were compared, given by the distance from the cochlear base in the percent of the total length of the BM. According to Müller et al., the best frequency changes in mouse auditory neurons from 42 to 9 kHz between the basal and the apical measuring sites, while corresponding stiffness values presented here change from 3.7 to 0.5 N/m. Previous studies revealed a change in cross-sectional area of the organ of Corti from 2,832 to 3,448 μm2 (Keiler and Richter 2001). In other words, the best frequency decreased by a factor of 4.7, the stiffness decreased by a factor of 7.4, and the mass increased by a factor of 1.2. With the assumption that the BM behaves like a simple resonator, the best frequency, f, should change according to f0/f1 = ((k0/k1)/(m1/m0))0.5, where k is the stiffness of the BM and m the mass of the cochlear partition. For the present experiments, a 6.2-fold change in best frequency was calculated. This frequency difference is close to the changes along the frequency-place map for the mouse that was obtained by recordings from single auditory nerve fibers and subsequent staining with horseradish peroxidase (Müller and Smolders 2005). A similar conclusion was reached for the gerbil BM in previous studies (Emadi et al. 2004).
FIG. 10.

The square root of the driving point stiffness obtained at the BM is plotted together with the best-frequency neural map of Müller et al. (2005).
Tectorial Membrane
Again, von Békésy was the first to measure the stiffness of the TM along (von Békésy, 1960). He used a hair of known stiffness and pushed on the TM from above (von Békésy, 1953). By measuring the bending of the hair, he determined the stiffness of the TM of a human cadaver to be 0.1 N/m, with little change along the cochlea. In other words, von Békésy could not find gradients in transversal stiffness of the TM along the cochlea. Moreover, by the oval shape of the indentation caused by the stiffness probe, von Békésy suggested a greater stiffness in the radial direction compared to the longitudinal direction (von Békésy, 1953, 1960). The larger stiffness in the radial direction was also shown in mice. Abnet and Freeman (2000) harvested mouse TM and placed them on a cover slip. Deformation was achieved via magnetic beads placed on the surface of the TM, to which a force was applied via an electromagnetic field. Stiffness values in the radial and longitudinal directions were ~0.25 and 0.15 N/m, respectively, confirming a stiffer TM in radial direction when compared to the longitudinal direction. Measurements were taken at different stimulus frequencies. Amplitude and phase plots of the magnetic bead measurements on the TM suggested that the isolated TM behaves like a viscoelastic solid. These results are in contrast to the reported in vivo stiffness measurements by Zwislocki and Cefaratti (1989; 1988). Using a calibrated glass fiber, they determined the TM stiffness of gerbils in the transversal and radial direction. Measurements were taken at one location in the cochlea, about 5 to 6 mm from the basal end of the TM. Their values for the transversal and radial stiffness were 0.125 and 0.116 N/m, respectively.
In another set of experiments, Freeman et al. (2003a; 2003b) placed a section of mouse TM membrane in a cell-tack coated chamber and vibrated this chamber with a piezo actuator at frequencies between 10 and 14 kHz. At the same time, they recorded the mechanically induced vibrations of the TM with an atomic force cantilever with known mechanical impedance. The vibration magnitude of the TM decreased with a rate between 0 and −20 dB/decade of frequency, and the phase angle was between 0 and −90 °. The conclusion drawn from these latter experiments supported their previous demonstration that the impedance spectrum of the TM is that of a viscoelastic element.
More recently, Jones et al. (2013) isolated segments of mouse TM and placed them into a bath one side on a fixed, the other end on a vibrating support. Wave travel along the TM could be studied. The results showed that the stiffness of the TM is reduced when it is mechanically stimulated at physiologically relevant magnitudes and at frequencies below their frequency place in the cochlea.
In a paper by Shoelson et al. (2004), sections of isolated guinea pig TM from the base, middle, and apex of the cochlea were used to measure Young’s modulus. Measurements were made with an atomic force cantilever. Shear modulus values between 1.3 and 9.8 kPa were reported. While TM modulus values varied with radial location, the authors could not detect any systematic changes along the length of the cochlea. When TM stereo cilia modulus were compared (Strelioff and Flock 1984), similar values were found, 4.36 kPa (tectorial membrane) and 1.62 kPa (stereo cilia bundle).
The TM driving point stiffness measured here in the apical turn of CBA/CaJ mice is close to those measured by Abnet and Freeman (2000), who studied mice TM. They reported a range of TM stiffness between 0.11–0.30 N/m in CBA/CaJ mice. Zwislocki and Cefaratti measured in the apical turn of Mongolian gerbils 0.125 N/m. No stiffness measurements were obtained at positions closer to the stapes. In the present study as well as in previous work on gerbil TM (Richter et al. 2007), a longitudinal stiffness gradient not only for the BM but also for the TM could be shown.
Whereas von Békésy (1953, 1960) and Shoelson et al. (2004) found no systematic longitudinal stiffness changes in the TM, a systematic change in driving point stiffness measured at the TM has been reported by our group in the gerbil (Emadi et al. 2002; Richter et al. 2007) and by Gueta at al. (Gueta et al. 2006, 2011) in the mouse. Gueta et al.’s (2006) published data on TM Young’s modulus differed significantly from previously reported values (Gueta et al. 2006, 2008, 2011). They measured Young’s modulus using an atomic force microscope probe and demonstrated that the values decrease from base to apex by about an order of magnitude (210 to 24 kPa) and vary along the radial axis by a factor of two. With regard to actual magnitudes, however, their values at equivalent radial and longitudinal positions on the isolated mouse TM were at least an order of magnitude larger than their data published previously. The source for the differences is still not clear.
Masaki and coworkers (Masaki et al. 2006) used osmotic stress to determine the poroelastic bulk properties of the mouse TM. The equilibrium stress–strain relation of the TM was determined by adding polyethylene glycol (molecular weight of 511 kDa) to the bathing solution. Their experiments showed a gradient in the transverse stiffness along the radial axis of the TM and along the longitudinal axis of the cochlea: the transverse stiffness was about 20 % greater in the modiolar region than in the lateral wall region, and samples from the base of the cochlea were stiffer than samples from the upper half of the cochlea. The authors have compared the strains in the different directions and have argued that their method provides them with the longitudinal modulus, for which they measured an average value of 0.45 kPa. To compare their data with values previously reported in the literature, Masaki et al. used their longitudinal modulus data to estimate transverse stiffness. The transverse stiffness estimate was 0.009 N/m, which is close to the lower end of the previously published data (Masaki et al. 2006). The value compares with the values obtained in this study.
In the present study, in CBA/CaJ mice, we were also able to detect a significant decrease (at a level of p = 0.05) of the TM Young’s modulus and driving point stiffness from base towards the apex.
Stiffness Gradients and Frequency-Place Mapping
Using our estimate for the gradient of TM stiffness along the length of the cochlea, we examine whether the TM could constitute the substrate for a second frequency-place map along the cochlea. Similar to previous analysis for the TM (Emadi et al. 2004), a relatively simple lumped-parameter model incorporating a one-dimensional spring–mass resonance was used. In this analysis, some gross simplifications of the cochlea’s mechanical behavior are applied. First, the TM is conceptually divided along its longitudinal dimension into many short segments, with each segment modeled as a friction-free lumped parameter system having a single mass suspended by a single spring, attached to a rigid support. Such a system exhibits a resonance at a radian frequency equal to (k/m)0.5, where k is the stiffness and m is the mass (Rossing and Fletcher 1995). Second, the stiffness of the entire TM cross section at a given longitudinal location is approximated with its plateau stiffness, and the mass is assumed to be proportional to the local cross-sectional area of the TM. The best frequency was assumed to be the frequency of the BM at the elected location. Note, the best frequency determined for different structures at a given measuring site was the same (Richter et al. 2002). If the spring–mass resonance model applies, then (k/m)0.5 also should change by a factor of 4.7. Data from the present study indicate that the average TM stiffness decreases from 0.6 N/m at the basal turn locations to 0.2 N/m at the middle turn locations and to 0.09 N/m at the apical turn locations, equivalent to a decrease in k by a factor of 6.7. The TM cross-sectional area is 2,507, 5,290, and 6,622 μm2 for the basal, middle, and apical locations, respectively (Richter et al. 2000). Combining the measured stiffness change with the estimated mass change yields an expected decrease of resonance frequency from the basal location to the middle to the apical location by a factor of 2.5 (base to middle) and 4.2 (base to apex). This is less than the change of neural best frequency which has been reported by Müller et al. (2005) stating a factor of 4.7 (2.2 octaves). It should be clear that, although it is informative and intuitive, the spring–mass model used here is a greatly simplified interpretation and is insufficient to represent the details of either the active response of the cochlea (i.e., action by the outer hair cells) or the stimulation of the hair bundles of the hair cells.
Limitations of the Method
In previous reports (Emadi et al. 2004; Richter et al. 2007), some cautionary points were discussed with regard to driving point stiffness measurements made on the BM. Here, some of those points are re-iterated in the context of the here presented driving point stiffness measurements in the mouse. Under physiological conditions, the stimulus driving the cochlear tissues is a distributed fluid pressure. In contrast, for each stiffness measurement described in this and the above-mentioned studies, the stimulus is a focal point-force applied by a probe at a single position on the tissue. Associated with this difference in stimulation mode is a difference in the magnitude of the tissue deflection. Normal physiological motion of the cochlear partition is assumed to be in the submicron range, even for high-level sound stimulation (e.g. Ruggero et al. 1997). The stiffness measurements presented here were based on tissue deflections on the order of tens of microns. These deflections are significantly larger than sound-induced motion in vivo, and it is important to consider some potential pitfalls with these measurement methods. It is possible that the relevant stiffness occurred at much smaller tissue deflections and may be buried in the noise. Moreover, the large deflections during stiffness measurements (on either the BM or the TM) are likely to produce immediate damage to the stereociliary complex. If this complex normally contributes to the stiffness at the TM, its contribution will not easily be observed with any point stiffness measurement technique. Acknowledging that caution is necessary, point-force measurements can provide a useful indication of spatial gradients of mechanical properties within the cochlea.
The use of a quadratic fit for the stiffness–deflection curves follows previous work in which the BM is approximated by parallel beams sustaining transverse deflections (Allaire et al. 1974; Gummer et al. 1981). Studies of the TM and the BM using immunocytochemistry have demonstrated that collagen fibers are important constituents of the fibrous components (Echteler 1995; Iurato 1962; Kössl and Vater 1996; Nakamura and Yuge 1982; Shoelson et al. 2004; Thalmann 1993; Thalmann et al. 1986). Although the biomechanical properties will, of course, depend on the exact configuration of the collagen fibrils and on the nature of other proteins in the tissue, to a first approximation, the authors expect general response characteristics of the TM to be similar to those seen in other types of tissue with this collagen content. One example of this tissue type is cartilage, for which the stress–strain relation at small deformations has been modeled using a power law function (e.g., Fung 1993). For the purpose of this study, however, the use of a quadratic fitting function was maintained rather than using a higher-order power law function, since the primary reason of the fit is to obtain values for the plateau stiffness (i.e., the constant term). The plateau has been observed consistently in our data and in previous work (Emadi et al. 2004). Although ultimately it may be more appropriate to fit the rising portion of the stiffness–deflection curves with a non-quadratic function, the authors believe that for the purpose of obtaining plateau values, the quadratic fit is accurate and sufficient.
Other Considerations
Taking into account that the TM is deflected several micrometers for the stiffness measurements, the angle of deflection can be estimated as the ratio of the radial deflection of the stereo cilia tip to the stereo cilia height. The angle for a 5-μm displacement is ~45 °. The cilia are therefore most likely pulled out of the tectorial membrane. In other words, the large displacements themselves likely detach the cilia (Dallos 2003). Consequently, it is asserted that all of the stiffness data presented here are, in fact, from the TM alone, without significant contribution from the stereo cilia. This helps to differentiate the TM data from the stereo cilia data of Strelioff and Flock (1984).
In summary, we have demonstrated that tectorial membrane and basilar membrane revealed a stiffness gradient along the cochlea. While a simple spring mass resonator predicts the change in characteristic frequency presented by Müller and coworkers for the same strain of mice, the spring mass model does not predict the frequency change along the tectorial membrane.
Acknowledgments
This work was supported by the American Hearing Research Foundation, the Hugh Knowles Center, the National Science Foundation (IBN-077476 and IBN-0415901), and the NIH (DC00089-44 to MAC). The authors thank Dr. Peter Dallos for providing equipment and support to accomplish the experiments and for feedback on an earlier version of the manuscript.
References
- Abnet CC, Freeman DM. Deformations of the isolated mouse tectorial membrane produced by oscillatory forces. Hear Res. 2000;144:29–46. doi: 10.1016/s0378-5955(00)00041-1. [DOI] [PubMed] [Google Scholar]
- Allaire P, Raynor S, Billione M. Cochlear partition stiffness—a composite model. J Acoust Soc Am. 1974;55:1252–1258. doi: 10.1121/1.1914693. [DOI] [PubMed] [Google Scholar]
- Barral J, Martin P. The physical basis of active mechanosensitivity by the hair-cell bundle. Curr Opin Otolaryngol Head Neck Surg. 2011;19:369–375. doi: 10.1097/MOO.0b013e32834a8c33. [DOI] [PubMed] [Google Scholar]
- Brownell WE, Jacob S, Hakizimana P, Ulfendahl M, Fridberger A. Membrane cholesterol modulates cochlear electromechanics. Pflugers Arch. 2011;461:677–686. doi: 10.1007/s00424-011-0942-5. [DOI] [PMC free article] [PubMed] [Google Scholar]
- Chan DK, Hudspeth AJ. Ca2+ current-driven nonlinear amplification by the mammalian cochlea in vitro. Nat Neurosci. 2005;8:149–155. doi: 10.1038/nn1385. [DOI] [PMC free article] [PubMed] [Google Scholar]
- Cheatham MA, Dallos P. The dynamic range of inner hair cell and organ of Corti responses. J Acoust Soc Am. 2000;107:1508–1520. doi: 10.1121/1.428437. [DOI] [PubMed] [Google Scholar]
- Chen F, Choudhury N, Zheng J, Matthews S, Nutall AL, Jacques SL. In vivo imaging and low-coherence interferometry of organ of Corti vibration. J Biomed Opt. 2007;12:021006. doi: 10.1117/1.2717134. [DOI] [PubMed] [Google Scholar]
- Chen F, Zha D, Fridberger A, Zheng J, Choudhury N, Jacques SL, Wang RK, Shi X, Nuttall AL. A differentially amplified motion in the ear for near-threshold sound detection. Nat Neurosci. 2011;14:770–774. doi: 10.1038/nn.2827. [DOI] [PMC free article] [PubMed] [Google Scholar]
- Choudhury N, Song G, Chen F, Matthews S, Tschinkel T, Zheng J, Jacques SL, Nuttall AL. Low coherence interferometry of the cochlear partition. Hear Res. 2006;220:1–9. doi: 10.1016/j.heares.2006.06.006. [DOI] [PubMed] [Google Scholar]
- Dallos P. The active cochlea. J Neurosci. 1992;12:4575–4585. doi: 10.1523/JNEUROSCI.12-12-04575.1992. [DOI] [PMC free article] [PubMed] [Google Scholar]
- Dallos P. Organ of Corti kinematics. J Assoc Res Otolaryngol. 2003;4:416–421. doi: 10.1007/s10162-002-3049-z. [DOI] [PMC free article] [PubMed] [Google Scholar]
- Dallos P, Fakler B. Prestin, a new type of motor protein. Nat Rev Mol Cell Biol. 2002;3:104–111. doi: 10.1038/nrm730. [DOI] [PubMed] [Google Scholar]
- Dimitriadis EK, Horkay F, Maresca J, Kachar B, Chadwick RS. Determination of elastic moduli of thin layers of soft material using the atomic force microscope. Biophys J. 2002;82:2798–2810. doi: 10.1016/S0006-3495(02)75620-8. [DOI] [PMC free article] [PubMed] [Google Scholar]
- Dong W, Olson ES. In vivo impedance of the gerbil cochlear partition at auditory frequencies. Biophys J. 2009;97:1233–1243. doi: 10.1016/j.bpj.2009.05.057. [DOI] [PMC free article] [PubMed] [Google Scholar]
- Echteler SM. Structural correlates of frequency-place map development. Abstr Assoc Res Otolaryngol. 1995;18:442. [Google Scholar]
- Edge RM, Evans BN, Pearce M, Richter CP, Hu X, Dallos P. Morphology of the unfixed cochlea. Hear Res. 1998;124:1–16. doi: 10.1016/s0378-5955(98)00090-2. [DOI] [PubMed] [Google Scholar]
- Eiber A. Mechanical problems in human hearing. Stud Health Technol Inform. 2008;133:83–94. [PubMed] [Google Scholar]
- Elliott SJ, Ku EM, Lineton B. A state space model for cochlear mechanics. J Acoust Soc Am. 2007;122:2759–2771. doi: 10.1121/1.2783125. [DOI] [PubMed] [Google Scholar]
- Elliott SJ, Lineton B, Ni G. Fluid coupling in a discrete model of cochlear mechanics. J Acoust Soc Am. 2011;130:1441–1451. doi: 10.1121/1.3607420. [DOI] [PubMed] [Google Scholar]
- Emadi G, Richter CP. Developmental changes of mechanics measured in the gerbil cochlea. J Assoc Res Otolaryngol. 2008;9:22–32. doi: 10.1007/s10162-007-0104-9. [DOI] [PMC free article] [PubMed] [Google Scholar]
- Emadi G, Richter C-P, Dallos P. Tectorial membrane stiffness at multiple longitudinal locations. Abstr Assoc Res Otolaryngol, 2002: 906.
- Emadi G, Richter CP, Dallos P. Stiffness of the gerbil basilar membrane: radial and longitudinal variations. J Neurophysiol. 2004;91:474–488. doi: 10.1152/jn.00446.2003. [DOI] [PubMed] [Google Scholar]
- Eze N, Olson ES. Basilar membrane velocity in a cochlea with a modified organ of Corti. Biophys J. 2011;100:858–867. doi: 10.1016/j.bpj.2011.01.006. [DOI] [PMC free article] [PubMed] [Google Scholar]
- Fettiplace R. Active hair bundle movements in auditory hair cells. J Physiol. 2006;576:29–36. doi: 10.1113/jphysiol.2006.115949. [DOI] [PMC free article] [PubMed] [Google Scholar]
- Fisher JA, Nin F, Reichenbach T, Uthaiah RC, Hudspeth AJ. The spatial pattern of cochlear amplification. Neuron. 2012;76:989–997. doi: 10.1016/j.neuron.2012.09.031. [DOI] [PMC free article] [PubMed] [Google Scholar]
- Freeman DM, Abnet CC, Hemmert W, Tsai BS, Weiss TF. Dynamic material properties of the tectorial membrane: a summary. Hear Res. 2003;180:1–10. doi: 10.1016/s0378-5955(03)00073-x. [DOI] [PubMed] [Google Scholar]
- Freeman DM, Masaki K, McAllister AR, Wei JL, Weiss TF. Static material properties of the tectorial membrane: a summary. Hear Res. 2003;180:11–27. doi: 10.1016/s0378-5955(03)00072-8. [DOI] [PubMed] [Google Scholar]
- Fridberger A, de Monvel JB. Sound-induced differential motion within the hearing organ. Nat Neurosci. 2003;6:446–448. doi: 10.1038/nn1047. [DOI] [PubMed] [Google Scholar]
- Fridberger A, Boutet De Monvel J, Ulfendahl M. Internal shearing within the hearing organ evoked by basilar membrane motion. The Journal of neuroscience : the official journal of the Society for Neuroscience. 2002;22:9850–9857. doi: 10.1523/JNEUROSCI.22-22-09850.2002. [DOI] [PMC free article] [PubMed] [Google Scholar]
- Fridberger A, Zheng J, Parthasarathi A, Ren T, Nuttall A. Loud sound-induced changes in cochlear mechanics. J Neurophysiol. 2002;88:2341–2348. doi: 10.1152/jn.00192.2002. [DOI] [PubMed] [Google Scholar]
- Fung YC. Biomechanics: mechanical properties of living tissue. New York: Springer Verlag; 1993. [Google Scholar]
- Gao SS, Xia A, Yuan T, Raphael PD, Shelton RL, Applegate BE, Oghalai JS. Quantitative imaging of cochlear soft tissues in wild-type and hearing-impaired transgenic mice by spectral domain optical coherence tomography. Opt Express. 2011;19:15415–15428. doi: 10.1364/OE.19.015415. [DOI] [PMC free article] [PubMed] [Google Scholar]
- Gao SS, Raphael PD, Wang R, Park J, Xia A, Applegate BE, Oghalai JS. In vivo vibrometry inside the apex of the mouse cochlea using spectral domain optical coherence tomography. Biomed Opt Express. 2013;4:230–240. doi: 10.1364/BOE.4.00230. [DOI] [PMC free article] [PubMed] [Google Scholar]
- Gavara N, Chadwick RS. Collagen-based mechanical anisotropy of the tectorial membrane: implications for inter-row coupling of outer hair cell bundles. PLoS One. 2009;4:e4877. doi: 10.1371/journal.pone.0004877. [DOI] [PMC free article] [PubMed] [Google Scholar]
- Gavara N, Chadwick RS. Noncontact microrheology at acoustic frequencies using frequency-modulated atomic force microscopy. Nat Methods. 2010;7:650–654. doi: 10.1038/nmeth.1474. [DOI] [PMC free article] [PubMed] [Google Scholar]
- Gavara N, Manoussaki D, Chadwick RS. Auditory mechanics of the tectorial membrane and the cochlear spiral. Curr Opin Otolaryngol Head Neck Surg. 2011;19:382–387. doi: 10.1097/MOO.0b013e32834a5bc9. [DOI] [PMC free article] [PubMed] [Google Scholar]
- Ghaffari R, Aranyosi AJ, Freeman DM. Longitudinally propagating traveling waves of the mammalian tectorial membrane. Proc Natl Acad Sci U S A. 2007;104(42):16510–16515. doi: 10.1073/pnas.0703665104. [DOI] [PMC free article] [PubMed] [Google Scholar]
- Gu JW, Hemmert W, Freeman DM, Aranyosi AJ. Frequency-dependent shear impedance of the tectorial membrane. Biophys J. 2008;95:2529–2538. doi: 10.1529/biophysj.107.124727. [DOI] [PMC free article] [PubMed] [Google Scholar]
- Gueta R, Barlam D, Shneck RZ, Rousso I. Measurement of the mechanical properties of isolated tectorial membrane using atomic force microscopy. Proc Natl Acad Sci U S A. 2006;103:14790–14795. doi: 10.1073/pnas.0603429103. [DOI] [PMC free article] [PubMed] [Google Scholar]
- Gueta R, Barlam D, Shneck RZ, Rousso I. Sound-evoked deflections of outer hair cell stereo cilia arise from tectorial membrane anisotropy. Biophys J. 2008;94:4570–4576. doi: 10.1529/biophysj.107.125203. [DOI] [PMC free article] [PubMed] [Google Scholar]
- Gueta R, Levitt J, Xia A, Katz O, Oghalai JS, Rousso I. Structural and mechanical analysis of tectorial membrane Tecta mutants. Biophys J. 2011;100:2530–2538. doi: 10.1016/j.bpj.2011.04.024. [DOI] [PMC free article] [PubMed] [Google Scholar]
- Gummer AW, Johnstone BM, Armstrong NJ. Direct measurement of basilar membrane stiffness in the guinea pig. J Acoust Soc Am. 1981;70:1298–1309. [Google Scholar]
- He W, Fridberger A, Porsov E, Grosh K, Ren T. Reverse wave propagation in the cochlea. Proc Natl Acad Sci U S A. 2008;105:2729–2733. doi: 10.1073/pnas.0708103105. [DOI] [PMC free article] [PubMed] [Google Scholar]
- Hemila S, Nummela S, Reuter T. Anatomy and physics of the exceptional sensitivity of dolphin hearing (Odontoceti: Cetacea) J Comp Physiol A Neuroethol Sens Neural Behav Physiol. 2010;196:165–179. doi: 10.1007/s00359-010-0504-x. [DOI] [PubMed] [Google Scholar]
- Hong SS, Freeman DM. Doppler optical coherence microscopy for studies of cochlear mechanics. J Biomed Opt. 2006;11:054014. doi: 10.1117/1.2358702. [DOI] [PubMed] [Google Scholar]
- Hu X, Evans BN, Dallos P. Transmission of basilar membrane motion to reticular lamina motion. . Abtsr. Assoc. Res. Otolaryngol., 1995: 223.
- Hu X, Evans BN, Dallos P. Direct visualization of organ of Corti kinematics in a hemi cochlea. J Neurophysiol. 1999;82:2798–2807. doi: 10.1152/jn.1999.82.5.2798. [DOI] [PubMed] [Google Scholar]
- Iurato S. Functional implication of the nature and submicroscopic structure of the tectorial and basilar membranes. J Acoust Soc Am. 1962;34:1386–1395. [Google Scholar]
- Jacob S, Johansson C, Ulfendahl M, Fridberger A. A digital heterodyne laser interferometer for studying cochlear mechanics. J Neurosci Methods. 2009;179:271–277. doi: 10.1016/j.jneumeth.2009.02.002. [DOI] [PubMed] [Google Scholar]
- Jacob S, Pienkowski M, Fridberger A. The endocochlear potential alters cochlear micromechanics. Biophys J. 2011;100:2586–2594. doi: 10.1016/j.bpj.2011.05.002. [DOI] [PMC free article] [PubMed] [Google Scholar]
- Jia S, Dallos P, He DZ. Mechanoelectric transduction of adult inner hair cells. The Journal of neuroscience : the official journal of the Society for Neuroscience. 2007;27:1006–1014. doi: 10.1523/JNEUROSCI.5452-06.2007. [DOI] [PMC free article] [PubMed] [Google Scholar]
- Jones GP, Lukashkina VA, Russell IJ, Elliott SJ, Lukashkin AN. Frequency-dependent properties of the tectorial membrane facilitate energy transmission and amplification in the cochlea. Biophys J. 2013;104:1357–1366. doi: 10.1016/j.bpj.2013.02.002. [DOI] [PMC free article] [PubMed] [Google Scholar]
- Kapadia S, Lutman ME. Nonlinear temporal interactions in click-evoked otoacoustic emissions. II Experimental data Hear Res. 2000;146:101–120. doi: 10.1016/s0378-5955(00)00103-9. [DOI] [PubMed] [Google Scholar]
- Karavitaki KD, Mountain DC. Evidence for outer hair cell driven oscillatory fluid flow in the tunnel of Corti. Biophys J. 2007;92:3284–3293. doi: 10.1529/biophysj.106.084087. [DOI] [PMC free article] [PubMed] [Google Scholar]
- Karavitaki KD, Mountain DC. Imaging electrically evoked micromechanical motion within the organ of Corti of the excised gerbil cochlea. Biophys J. 2007;92:3294–3316. doi: 10.1529/biophysj.106.083634. [DOI] [PMC free article] [PubMed] [Google Scholar]
- Karavitaki KD, Mountain DC, Cody AR. Electrically evoked micromechanical movements from the apical turn of the gerbil cochlea. In Lewis ER, Long GR, Lyon RF, Narins PM, Steele CR, Hecht-Poinar E, editors. Diversity in auditory mechanics. World Scientific: Singapore//New Jersy//London//Hong Kong, 1996: 392–7.
- Keiler S, Richter CP. Cochlear dimensions obtained in hemi cochleae of four different strains of mice: CBA/CaJ, 129/CD1, 129/SvEv and C57BL/6 J. Hear Res. 2001;162:91–104. doi: 10.1016/s0378-5955(01)00374-4. [DOI] [PubMed] [Google Scholar]
- Kitani R, Kakehata S, Kalinec F. Motile responses of cochlear outer hair cells stimulated with an alternating electrical field. Hear Res. 2011;280:209–218. doi: 10.1016/j.heares.2011.05.013. [DOI] [PMC free article] [PubMed] [Google Scholar]
- Kolston PJ. The importance of phase data and model dimensionality to cochlear mechanics. Hear Res. 2000;145:25–36. doi: 10.1016/s0378-5955(00)00067-8. [DOI] [PubMed] [Google Scholar]
- Kössl M, Vater M. A tectorial membrane fovea in the cochlea of the mustached bat. Die Naturwissenschaften. 1996;83:89–91. doi: 10.1007/BF01141878. [DOI] [PubMed] [Google Scholar]
- Lamb JS, Chadwick RS. Dual traveling waves in an inner ear model with two degrees of freedom. Phys Rev Lett. 2011;107:088101. doi: 10.1103/PhysRevLett.107.088101. [DOI] [PMC free article] [PubMed] [Google Scholar]
- Legan PK, Lukashkina VA, Goodyear RJ, Kossi M, Russell IJ, Richardson GP. A targeted deletion in alpha-tectorin reveals that the tectorial membrane is required for the gain and timing of cochlear feedback. Neuron. 2000;28:273–285. doi: 10.1016/s0896-6273(00)00102-1. [DOI] [PubMed] [Google Scholar]
- Mammano F, Ashmore JF. Reverse transduction measured in the isolated cochlea by laser Michelson interferometry. Nature. 1993;365:838–841. doi: 10.1038/365838a0. [DOI] [PubMed] [Google Scholar]
- Masaki K, Weiss TF, Freeman DM. Poroelastic bulk properties of the tectorial membrane measured with osmotic stress. Biophys J. 2006;91:2356–2370. doi: 10.1529/biophysj.105.078121. [DOI] [PMC free article] [PubMed] [Google Scholar]
- Masaki K, Gu JW, Ghaffari R, Chan G, Smith RJ, Freeman DM, Aranyosi AJ. Col11a2 deletion reveals the molecular basis for tectorial membrane mechanical anisotropy. Biophys J. 2009;96:4717–4724. doi: 10.1016/j.bpj.2009.02.056. [DOI] [PMC free article] [PubMed] [Google Scholar]
- Meaud J, Grosh K. The effect of tectorial membrane and basilar membrane longitudinal coupling in cochlear mechanics. J Acoust Soc Am. 2010;127:1411–1421. doi: 10.1121/1.3290995. [DOI] [PMC free article] [PubMed] [Google Scholar]
- Meaud J, Grosh K. Coupling active hair bundle mechanics, fast adaptation, and somatic motility in a cochlear model. Biophys J. 2011;100:2576–2585. doi: 10.1016/j.bpj.2011.04.049. [DOI] [PMC free article] [PubMed] [Google Scholar]
- Miller CE. Structural implications of basilar membrane compliance measurements. J Acoust Soc Am. 1985;77:1465–1474. doi: 10.1121/1.392041. [DOI] [PubMed] [Google Scholar]
- Morioka I, Reuter G, Reiss P, Gummer AW, Hemmert W, Zenner HP. Sound-induced displacement responses in the plane of the organ of Corti in the isolated guinea-pig cochlea. Hear Res. 1995;83:142–150. doi: 10.1016/0378-5955(95)00002-l. [DOI] [PubMed] [Google Scholar]
- Müller M, Smolders JW. Shift in the cochlear place-frequency map after noise damage in the mouse. Neuroreport. 2005;16:1183–1187. doi: 10.1097/00001756-200508010-00010. [DOI] [PubMed] [Google Scholar]
- Müller M, von Hunerbein K, Hoidis S, Smolders JW. A physiological place-frequency map of the cochlea in the CBA/J mouse. Hear Res. 2005;202:63–73. doi: 10.1016/j.heares.2004.08.011. [DOI] [PubMed] [Google Scholar]
- Naidu RC, Mountain DC. Measurements of the stiffness map challenge a basic tenet of cochlear theories. Hear Res. 1998;124:124–131. doi: 10.1016/s0378-5955(98)00133-6. [DOI] [PubMed] [Google Scholar]
- Naidu RC, Mountain DC. Longitudinal coupling in the basilar membrane. J Assoc Res Otolaryngol. 2001;2:257–267. doi: 10.1007/s101620010013. [DOI] [PMC free article] [PubMed] [Google Scholar]
- Naidu RC, Mountain DC. Basilar membrane tension calculations for the gerbil cochlea. J Acoust Soc Am. 2007;121:994–1002. doi: 10.1121/1.2404916. [DOI] [PubMed] [Google Scholar]
- Nakamura K, Yuge K. Studies on fibrous tissues of the basilar membrane in inner ear. Auris Nasus Larynx. 1982;9:133–143. doi: 10.1016/s0385-8146(83)80015-7. [DOI] [PubMed] [Google Scholar]
- Nam JH, Fettiplace R. Force transmission in the organ of Corti micromachine. Biophys J. 2010;98:2813–2821. doi: 10.1016/j.bpj.2010.03.052. [DOI] [PMC free article] [PubMed] [Google Scholar]
- Nam JH, Fettiplace R. Optimal electrical properties of outer hair cells ensure cochlear amplification. PLoS One. 2012;7:e50572. doi: 10.1371/journal.pone.0050572. [DOI] [PMC free article] [PubMed] [Google Scholar]
- Nowotny M, Gummer AW. Nanomechanics of the subtectorial space caused by electromechanics of cochlear outer hair cells. Proc Natl Acad Sci U S A. 2006;103:2120–2125. doi: 10.1073/pnas.0511125103. [DOI] [PMC free article] [PubMed] [Google Scholar]
- Olson ES, Mountain DC. In vivo measurement of basilar membrane stiffness. J Acoust Soc Am. 1991;89:1262–1275. doi: 10.1121/1.400535. [DOI] [PubMed] [Google Scholar]
- Olson ES, Mountain DC. Mapping the cochlear partition’s stiffness to its cellular architecture. J Acoust Soc Am. 1994;95:395–400. doi: 10.1121/1.408331. [DOI] [PubMed] [Google Scholar]
- Olson ES, Duifhuis H, Steele CR. Von Bekesy and cochlear mechanics. Hear Res. 2012;293:31–43. doi: 10.1016/j.heares.2012.04.017. [DOI] [PMC free article] [PubMed] [Google Scholar]
- Ren T, Nuttall AL. Fine structure and multicomponents of the electrically evoked otoacoustic emission in gerbil. Hear Res. 2000;143:58–68. doi: 10.1016/s0378-5955(00)00027-7. [DOI] [PubMed] [Google Scholar]
- Reuter G, Gitter AH, Thurm U, Zenner HP. High frequency radial movements of the reticular lamina induced by outer hair cell motility. Hear Res. 1992;60:236–246. doi: 10.1016/0378-5955(92)90025-i. [DOI] [PubMed] [Google Scholar]
- Rhode WS. Basilar membrane mechanics in the 6–9 kHz region of sensitive chinchilla cochleae. J Acoust Soc Am. 2007;121:2792–2804. doi: 10.1121/1.2718397. [DOI] [PubMed] [Google Scholar]
- Richter CP, Edge R, He DZ, Dallos P. Development of the gerbil inner ear observed in the hemi cochlea. J Assoc Res Otolaryngol. 2000;1:195–210. doi: 10.1007/s101620010019. [DOI] [PMC free article] [PubMed] [Google Scholar]
- Richter C-P, Dallos P. Multiple modes of vibration detected in the gerbil hemi cochlea. In Breebaart DJ, Houstma AJM, Kohlrausch A, Prijs VF, Schoonhoven R, editors. Physiological and Psychophysical Bases of Audiory Function. Shaker Publishing: St. Maateslaan, 2001: 44–50.
- Richter CP, Dallos P. Micromechanics in the gerbil hemi cochlea. In Gummer A, editor. Biophysics of the cochela from molecules to models. World Scientific: New Jersy, London, Singapore Hong Kong, 2002: 287.
- Richter C-P, Dallos P. Micromechanics in the gerbil hemi cochlea. . In Gummer T, editor. Meeting on cochlear mechanics, Titisee (Germany), 2003.
- Richter CP, Emadi G, Getnick G, Quesnel A, Dallos P. Tectorial membrane stiffness gradients. Biophys J, 2007. [DOI] [PMC free article] [PubMed]
- Robles L, Ruggero MA. Mechanics of the mammalian cochlea. Pysiological Reviews. 2001;81:1305–1352. doi: 10.1152/physrev.2001.81.3.1305. [DOI] [PMC free article] [PubMed] [Google Scholar]
- Rossing TD, Fletcher NH. Principles of vibration and sound. New York: Springer; 1995. [Google Scholar]
- Ruggero MA, Rich NC, Recio A, Narayan SS, Robles L. Basilar-membrane responses to tones at the base of the chinchilla cochlea. J Acoust Soc Am. 1997;101:2151–2163. doi: 10.1121/1.418265. [DOI] [PMC free article] [PubMed] [Google Scholar]
- Santos-Sacchi J. Cochlear mechanics: no shout but a twist in the absence of prestin. Curr Biol. 2008;18:R304–R306. doi: 10.1016/j.cub.2008.02.019. [DOI] [PubMed] [Google Scholar]
- Shoelson B, Dimitriadis EK, Cai H, Kachar B, Chadwick RS. Evidence and implications of inhomogeneity in tectorial membrane elasticity. Biophys J. 2004;87:2768–2777. doi: 10.1529/biophysj.104.040774. [DOI] [PMC free article] [PubMed] [Google Scholar]
- Steel KP, Brown SD. Genetics of deafness. Curr Opin Neurobiol. 1996;6:520–525. doi: 10.1016/s0959-4388(96)80059-6. [DOI] [PubMed] [Google Scholar]
- Steel KP, Kros CJ. A genetic approach to understanding auditory function. Nat Gen. 2001;27:143–149. doi: 10.1038/84758. [DOI] [PubMed] [Google Scholar]
- Strelioff D, Flock A. Stiffness of sensory-cell hair bundles in the isolated guinea pig cochlea. Hear Res. 1984;15:19–28. doi: 10.1016/0378-5955(84)90221-1. [DOI] [PubMed] [Google Scholar]
- Teudt IU, Richter CP. The hemi cochlea preparation of the guinea pig and other mammalian cochleae. J Neurosci Methods. 2007;162:187–197. doi: 10.1016/j.jneumeth.2007.01.012. [DOI] [PubMed] [Google Scholar]
- Thalmann I. Collagen of accessory structures of organ of Corti. Connect Tissue Res. 1993;29:191–201. doi: 10.3109/03008209309016826. [DOI] [PubMed] [Google Scholar]
- Thalmann I, Thallinger G, Comegys TH, Thalmann R. Collagen—the predominant protein of the tectorial membrane. ORL; journal for oto-rhino-laryngology and its related specialties. 1986;48:107–115. doi: 10.1159/000275855. [DOI] [PubMed] [Google Scholar]
- Van Dijk P, Mason MJ, Schoffelen RL, Narins PM, Meenderink SW. Mechanics of the frog ear. Hear Res. 2011;273:46–58. doi: 10.1016/j.heares.2010.02.004. [DOI] [PMC free article] [PubMed] [Google Scholar]
- Vôldrich L. Mechanical properties of the basilar membrane. Acta Otolaryngol. 1978;86:331–335. doi: 10.3109/00016487809107511. [DOI] [PubMed] [Google Scholar]
- von Békésy G. Description of some mechanical properties of the organ of Corti. J Acoust Soc Am. 1953;25:770–781. [Google Scholar]
- von Békésy G. Experiments in hearing. New York: McGraw-Hill Book Company; 1960. [Google Scholar]
- von Tiedemann M, Fridberger A, Ulfendahl M, de Monvel JB. Brightness-compensated 3-D optical flow algorithm for monitoring cochlear motion patterns. J Biomed Opt. 2010;15:056012. doi: 10.1117/1.3494564. [DOI] [PubMed] [Google Scholar]
- Wangemann P, Schacht J. Homeostatic mechanisms in the cochlea. Springer, 1996: 130–85.
- Zha D, Chen F, Ramamoorthy S, Fridberger A, Choudhury N, Jacques SL, Wang RK, Nuttall AL. In vivo outer hair cell length changes expose the active process in the cochlea. PLoS One. 2012;7:e32757. doi: 10.1371/journal.pone.0032757. [DOI] [PMC free article] [PubMed] [Google Scholar]
- Zhang R, Qian F, Rajagopalan L, Pereira FA, Brownell WE, Anvari B. Prestin modulates mechanics and electromechanical force of the plasma membrane. Biophys J. 2007;93:L07–L09. doi: 10.1529/biophysj.107.107573. [DOI] [PMC free article] [PubMed] [Google Scholar]
- Zheng QY, Johnson KR, Erway LC. Assessment of hearing in 80 inbred strains of mice by ABR threshold analyses. Hear Res. 1999;130:94–107. doi: 10.1016/s0378-5955(99)00003-9. [DOI] [PMC free article] [PubMed] [Google Scholar]
- Zheng J, Deo N, Zou Y, Grosh K, Nuttall AL. Chlorpromazine alters cochlear mechanics and amplification: in vivo evidence for a role of stiffness modulation in the organ of Corti. J Neurophysiol. 2007;97:994–1004. doi: 10.1152/jn.00774.2006. [DOI] [PubMed] [Google Scholar]
- Zwislocki JJ, Cefaratti LK. Tectorial membrane. II: stiffness measurements in vivo. Hear Res. 1989;42:211–227. doi: 10.1016/0378-5955(89)90146-9. [DOI] [PubMed] [Google Scholar]
- Zwislocki JJ, Chamberlain SC, Slepecky NB. Tectorial membrane. I: static mechanical properties in vivo. Hear Res. 1988;33:207–222. doi: 10.1016/0378-5955(88)90151-7. [DOI] [PubMed] [Google Scholar]