Abstract
Background
Mathematical modelling and analysis is now accepted in the engineering design on par with experimental approaches. Computer simulations enable one to perform several 'what-if' analyses cost effectively. High speed computers and low cost of memory has helped in simulating large-scale models in a relatively shorter time frame. The possibility of extending numerical modelling in the area of breast cancer detection in conjunction with medical thermography is considered in this work.
Methods
Thermography enables one to see the temperature pattern and look for abnormality. In a thermogram there is no radiation risk as it only captures the infrared radiation from the skin and is totally painless. But, a thermogram is only a test of physiology, whereas a mammogram is a test of anatomy. It is hoped that a thermogram along with numerical modelling will serve as an adjunct tool. Presently mammogram is the 'gold-standard' in breast cancer detection. But the interpretation of a mammogram is largely dependent on the radiologist. Therefore, a thermogram that looks into the physiological changes in combination with numerical simulation performing 'what-if' analysis could act as an adjunct tool to mammography.
Results
The proposed framework suggested that it could reduce the occurrence of false-negative/positive cases.
Conclusion
A numerical bioheat model of a female breast is developed and simulated. The results are compared with experimental results. The possibility of this method as an early detection tool is discussed.
Keywords: Breast Cancer, Computer Modelling, Early Diagnostic, Thermography, Mammography
Background
Thermography has been in extensively used as a cancer detection tool, but has not been accepted on par with mammography. One of the reasons is the incidence of high false positive cases; also a thermogram only provides a superficial abnormality whereas a mammogram provides the anatomical nature of the abnormality. However, despite this fact, patients with a false positive (abnormal) thermogram are at a higher risk of contracting breast cancer [1,2]. Keyserlingk et al. [3] observed that when a mammogram was conducted on patients with suspicious clinical examinations, the sensitivity was found to be 83%. The combination of mammogram and thermogram increased the sensitivity to 93%. When all three methods (clinical examination, mammogram and thermogram) were considered, the sensitivity was found to be 98%.
The present work is concerned with numerical modelling of a female breast, to re-look if the thermogram results can be augmented and artificial intelligence incorporated to enhance image processing, and thereby minimises the false positive results.
So far, authors have numerically estimated the optimum parametric settings for tumour detection, in order to build-in robustness to the detection process by maximising the tumour signal and minimising the effect of other factors (blood perfusion, metabolic rate and environment) [4]. The numerical model of the female breast was found to agree well with experimental work by Cockburn [5]. Authors previous work [6,7] provided valuable information on the heat transfer profile across tissues and the surface temperature profile for various tumour sizes and locations. It was observed that numerical simulation, although limited by factors such as smaller and deeper tumours, was able to capture the presence of an abnormality. However, the shape of the breast model required further improvement. The finite element grid also required better refinement and structuring. The breast may be imagined to be divided into four quadrants, designated as upper-outer quadrant (armpit), upper-inner quadrant, lower-inner quadrant and lower-outer quadrant. A more realistic model was developed and analysed [8] as compared to the hemispherical model developed earlier [7]. This model, not only had various tissue layer thicknesses, but also modelled as four quadrants. Thus the properties and parameters of the tissues in each quadrant could be changed selectively, providing better control and flexibility in the simulation. Similarly while simulating the presence of tumour the tumour volume takes the properties of tumour and that of a normal tissue while simulating a normal breast.
Methods
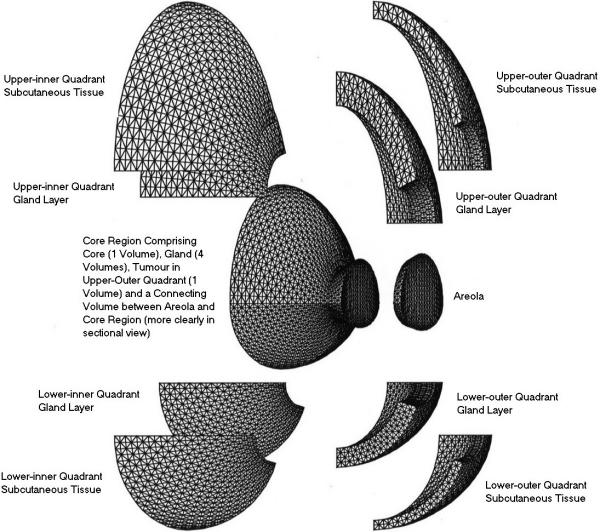
A three-dimensional close-actual-breast model is generated and a numerical grid with tetrahedral elements is generated. The model has four quadrants and four regions namely, skin, gland, muscle and the areola region. The computational grid is shown in (Figure 1). This model has the flexibility for changing the properties of the various layer in the various quadrant to adapt to various breast conditions and for various subjects. For example, the perfusion in the upper outer quadrant of a young lactating mother will be higher and this value can be easily adopted in the present model.
Figure 1.

Computational Grid – Breast Model
This computational model takes the material and blood perfusion properties (as given in Table 1) [9-11]. The parameter (cbwb)1–3 corresponds the magnitude of various blood perfusion terms, which is the product of specific heat capacity and blood mass flow rate, k is the tissue conductivity and qm is the metabolic heat generated by the tissue. The simulation is performed using a CFD (computational fluid dynamics) partial differential equation calculator FASTFLO (Council for Scientific and Industrial Research, Australia). The simulated thermal pattern is then compared with thermograms obtained from volunteers. The simulation was performed on an SGI Octane system, and the thermograms were taken using a high-resolution digital infrared camera (AVIO Thermal Video System TVS-2000 MK II ST). Thirty-four volunteers (age profile between early thirties and late forties) presented themselves for screening in a controlled environment in the pilot study in Nanyang Technological University and over 200 at the Singapore General Hospital. The imaging was taken following strict protocol [5].
Table 1.
| Layers | (cbwb)1 | (cbwb)2 | (cbwb)3 |
k | qm |
| W m-3 °C-1 | W m-3 °C-1 | W m-3 °C-1 | W m-3 °C-1 | W m-3 | |
| Areola | 800 | 1600 | 800 | 0.21 | 400 |
| Lower-inner Subcutaneous | 800 | 1600 | 800 | 0.21 | 400 |
| Lower-outer Subcutaneous | 800 | 1600 | 800 | 0.21 | 400 |
| Upper-outer Subcutaneous | 800 | 1600 | 800 | 0.21 | 400 |
| Upper-inner Subcutaneous | 800 | 1600 | 800 | 0.21 | 400 |
| Lower-inner Gland | 2400 | 2400 | 2400 | 0.48 | 700 |
| Lower-outer Gland | 2400 | 2400 | 2400 | 0.48 | 700 |
| Upper-outer Gland | 2400 | 2400 | 3600 | 0.48 | 700 |
| Upper-inner Gland | 2400 | 2400 | 2400 | 0.48 | 700 |
| Gland Core (All 4 Volumes) | 2400 | 2400 | 2400 | 0.48 | 700 |
| Muscle Core | 2400 | 2400 | 2400 | 0.48 | 700 |
| Tumour (32 mm) | 48 × 103 | 48 × 103 | 48 × 103 | 0.48 | 5.5 × 10³ |
Results and discussion
From the thermograms taken from the volunteers the following three cases were numerically simulated.
Volunteer #1 (38 years) with normal breasts who regularly carries out breast self-examination and undergoes annual clinical-examination.
Volunteer #2 (47 years) who had a lump in the left breast that was diagnosed as benign in 1994, and now has pain in her right breast.
Volunteer #3 (43 years) who had a benign lump removed in 1997 from her right breast.
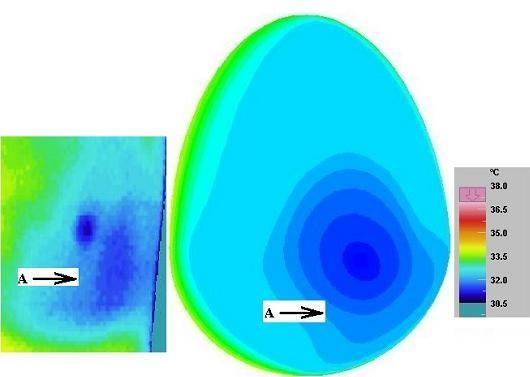
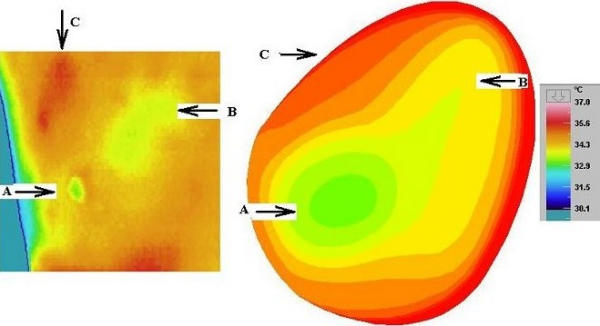
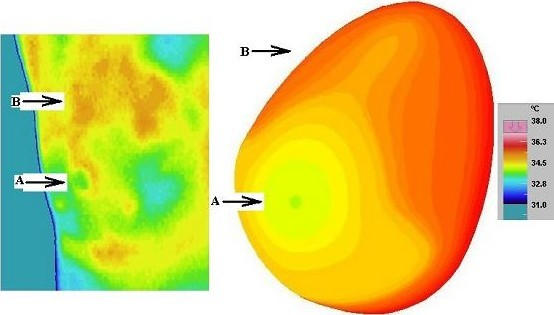
The experimental results and numerical simulations for the above three cases are presented in Figures 2 through 4. It is to be noted that a given model can be used in the computational domain by proper choice of geometric scaling factor [7]. With proper choice of scaling factor and tissue properties one model can represent several models in the physical domain.
Figure 2.

Normal Thermogram of a Left Breast with Numerical Simulation (Volunteer 1, Age 38 years)
Figure 4.

Normal Thermogram of a Right Breast showing a cold area due to lumpectomy with Numerical Simulation (Volunteer 3, Age 43 years)
The thermogram on the left side of a volunteer with the corresponding numerical simulation is presented (Figure 2). This volunteer undergoes regular screening by way of annual clinical examination. It can be seen she has a cold nipple region followed by a slightly warmer lower-outer quadrant (arrow A) and a warm upper quadrant, which is a standard feature for a normal thermogram. The breast base near the thoracic wall is the warmest. It can be seen that the numerical model matches the actual with appropriate choice of perfusion term.
The surface temperature of another volunteer is shown (Figure 3). This volunteer had been diagnosed with a benign lump in her left breast. She complained of pain and a lumpy feeling in her right breast. Interestingly, it can be observed that she has a relatively hot upper inner quadrant (arrow B). It can be seen that the relatively cool areola region (arrow A) and a hot upper breast has been simulated in the current numerical model, by appropriate choice of perfusion term.
Figure 3.

Abnormal Thermogram of a Right Breast with Numerical Simulation (Volunteer 2, Age 47 years) [B points to upper inner quadrant]
The surface temperature on the right breast of a volunteer who had a benign lump removed near the nipple region is presented (Figure 4). It is interesting to note that this lady has a relatively cool region (arrow B) and a warm upper-outer quadrant (arrow C). Diagnosis could mistake this effect as an abnormality in the upper outer quadrant or probably a fluid collection in that region (arrow B). As it is known that the volunteer had undergone a lumpectomy, this region owing to a scar may be at a lower metabolic rate. This could be the reason that a cold spot is seen overlying that area. This analysis can be termed as 'analysis by elimination'. It is to be noted that the patient history puts to rest several misinterpretation in analysis. Just as seen in the previous two cases, here too the numerical model matches the experimental results.
Conclusions
Here it can be seen that the model is very flexible in moulding itself to the required pattern by proper choice of tissue property values, tissue thickness and geometric scaling factor. Although there exists several combinations of parameters, that would fit a particular pattern, nevertheless the simulation would help in 'analysis by elimination' where certain possibilities are eliminated. Although there exists several combinations of parameter to a particular pattern, nevertheless the simulation would help in 'analysis by elimination' where certain false possibilities are eliminated. Clinical examination by feeling the lump along with patient history, and family history might help in choosing the right parameters (i.e. model which has a lump of approximate size at some approximate location). Moreover, it is also necessary to know the length of time the lump existed, the size and history of the lump, history of surgical intervention and/or other treatment for example radiotherapy as well as the current practice of triple assessment method of clinical, ultra sound and mammography [12-14] before conclusion can be made on the imaging modality. However, the time-honoured method of using existing knowledge of specialist doctors will remain for a long time to come. As a consequence the thermogram can be a valuable risk marker and a multidisciplinary approach can bring out the best results. Thus numerical modelling in conjunction with thermogram can be an adjunct tool and not a stand-alone tool for breast cancer detection.
Competing interests
None declared.
Authors' contributions
EN: conceived, coordinated and designed the study and drafted the manuscript. NM: participated in the design of the study and drafted the manuscript. Both authors read and approved the final manuscript.
Pre-publication history
The pre-publication history for this paper can be accessed here:
Contributor Information
Eddie Y-K Ng, Email: mykng@ntu.edu.sg.
NM Sudharsan, Email: sudharsann@asme.org.
References
- Gautherie M, Gros CM. Breast thermography and cancer risk prediction. Cancer. 1980;45:51–56. doi: 10.1002/1097-0142(19800101)45:1<51::aid-cncr2820450110>3.0.co;2-l. [DOI] [PubMed] [Google Scholar]
- Isard JH, Sweitzer CJ, Edelstien GR. Breast thermography: a prognostic indicator for breast cancer survival. Cancer. 1988;62:484–488. doi: 10.1002/1097-0142(19880801)62:3<484::aid-cncr2820620307>3.0.co;2-w. [DOI] [PubMed] [Google Scholar]
- Keyserlingk JR, Ahlgren PD, Yu E, Belliveau N. Infrared imaging of breast: initial reappraisal using high-resolution digital technology in 100 successive cases of stage I and II breast cancer. The Breast Journal. 1998;4:241–251. doi: 10.1046/j.1524-4741.1998.440245.x. [DOI] [PubMed] [Google Scholar]
- Sudharsan NM, Ng EYK. Parametric optimisation for tumour identification: bioheat equation using Anova and Taguchi method. Journal of Engineering in Medicine. 2000;214:505–512. doi: 10.1243/0954411001535534. [DOI] [PubMed] [Google Scholar]
- Cockburn W. Breast thermal imaging: the paradigm shift. Thermologie Oesterreich. 1995;5:49–53. [Google Scholar]
- Sudharsan NM, Ng EYK, Teh SL. Surface temperature distribution of a breast with and without tumour. Computer Methods in Biomechanics and Biomedical Engineering. 1999;2:187–199. doi: 10.1080/10255849908907987. [DOI] [PubMed] [Google Scholar]
- Ng EYK, Sudharsan NM. An improved 3-D direct numerical modelling and thermal analysis of a female breast with tumour. Journal of Engineering in Medicine. 2001;215:25–37. doi: 10.1243/0954411011533508. [DOI] [PubMed] [Google Scholar]
- Ng EYK, Sudharsan NM. Effect of blood flow, tumour and cold stress in a female breast: a novel time-accurate computer simulation. Journal of Engineering in Medicine. 2001;215:393–404. doi: 10.1243/0954411011535975. [DOI] [PubMed] [Google Scholar]
- Werner J, Buse M. Temperature profiles with respect to inhomgenity and geometry of the human body. Journal of Applied Physiology. 1988;65:1110–1118. doi: 10.1152/jappl.1988.65.3.1110. [DOI] [PubMed] [Google Scholar]
- Gautherie M, Quenneville Y, Gros CH. Metabolic heat production, growth rate and prognosis of early breast carcinomas. Biomedicine. 1975;22:328–336. [Google Scholar]
- Gautherie M. Thermopathology of breast cancer: measurement and analysis of in vivo temperature and blood flow. Annals New York Academy of Sciences. 1980;335:383–415. doi: 10.1111/j.1749-6632.1980.tb50764.x. [DOI] [PubMed] [Google Scholar]
- Kobayashi T. Diagnostic ultrasound in breast cancer. Journal of Clinical Ultrasound. 1979;7:471–479. doi: 10.1002/jcu.1870070611. [DOI] [PubMed] [Google Scholar]
- Alagaratnam TT, Wong J. Limitations of mammography in Chinese females. Clinical Radiology. 1985;36:175–177. doi: 10.1016/s0009-9260(85)80104-5. [DOI] [PubMed] [Google Scholar]
- Forrest Committee Report to the Health Ministers of England, Wales, Scotland and Northern Ireland. London: DHSS, HMSO; 1986. Breast Cancer Screening. [Google Scholar]


