. 2014 Aug 29;3:e03125. doi: 10.7554/eLife.03125

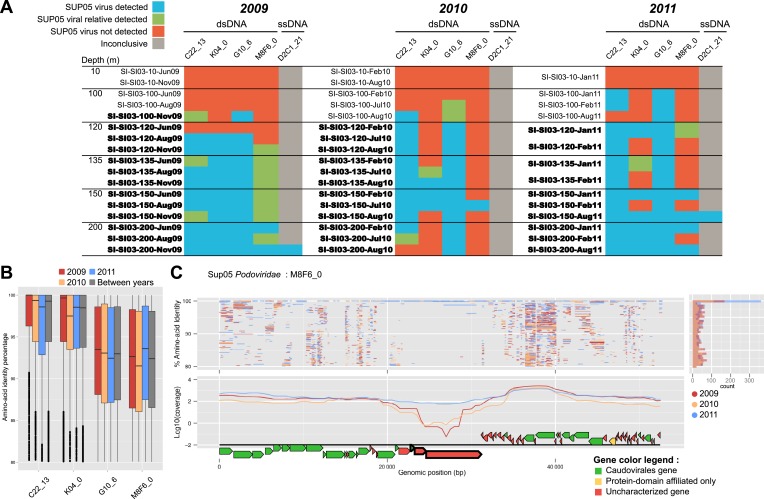
Figure 3. Spatiotemporal dynamics of SUP05 viral reference genomes in Saanich Inlet.

(A) SUP05 viral presence in Saanich Inlet microbial metagenomes with OMZ sample names bolded. Four categories indicate the SUP05 virus was detected (>75% of viral genes detected at >80% amino-acid identity; light blue), a SUP05 viral relative was detected (>75% of viral genes detected at 60–80% amino-acid identity; light green), no SUP05 virus was detected (red) or detection was inconclusive (e.g., Microviridae in HiSeq Illumina data sets that strongly select against ssDNA sequences; gray). (B) SUP05 viral reference genomes had differing sequence conservation among recruited metagenomic reads. Upper and lower ‘hinges’ correspond to the first and third quartiles (the 25th and 75th percentiles), while outliers are displayed as points (values beyond 1.5 * Inter-Quartile Range of the hinge). (C) One SUP05 viral reference genome with low sequence conservation revealed evolution in action whereby a genomic region (see ∼21–30 kb) appears to sweep through the population.

DOI: http://dx.doi.org/10.7554/eLife.03125.013

Figure 3.

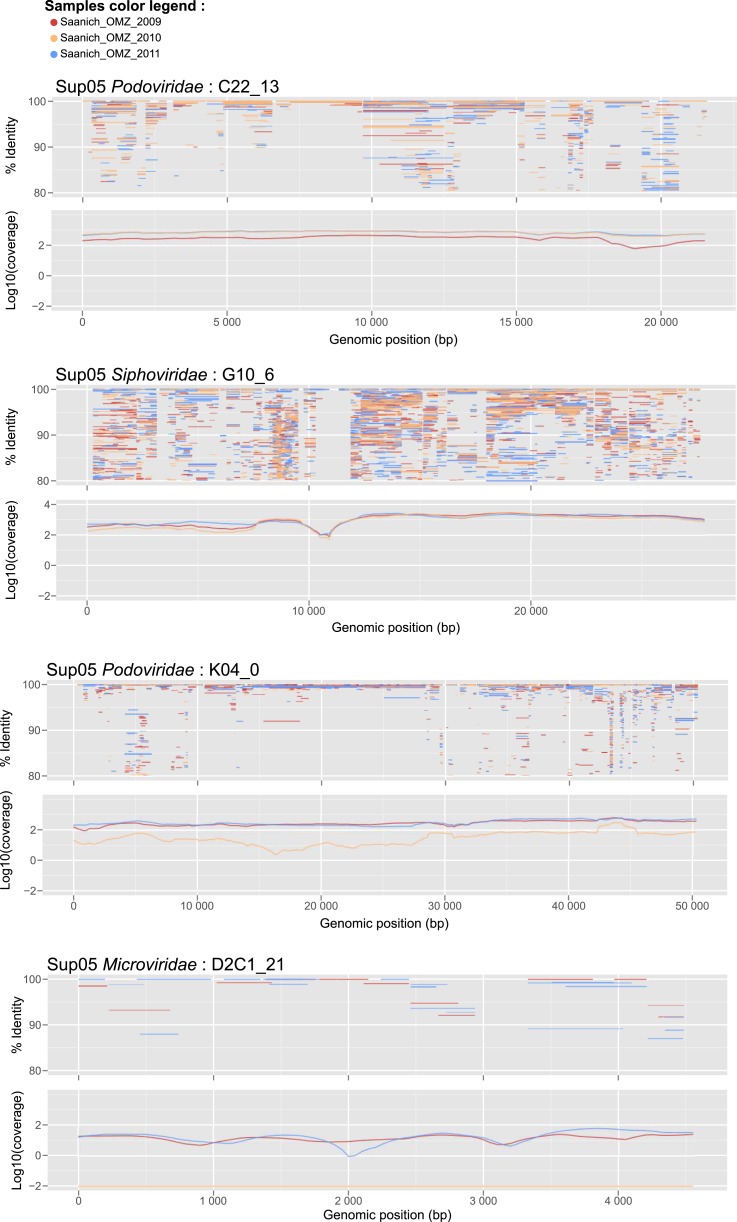
Figure 3—figure supplement 1. Recruitment and coverage plot of SUP05 viral genome fragments by Saanich Inlet datasets sampled in 2009, 2010, and 2011.

Figure 3—figure supplement 1.

Each dot correspond to a match between a metagenome predicted gene and a gene from the SUP05 viral genome fragment, displayed according to the coordinate on the genome (x-axis) and the protein identity percentage (y-axis). For each genome, plots were only generated for data sets in which the genome was detected. Only hits with more than 80% amino-acid identity were considered.
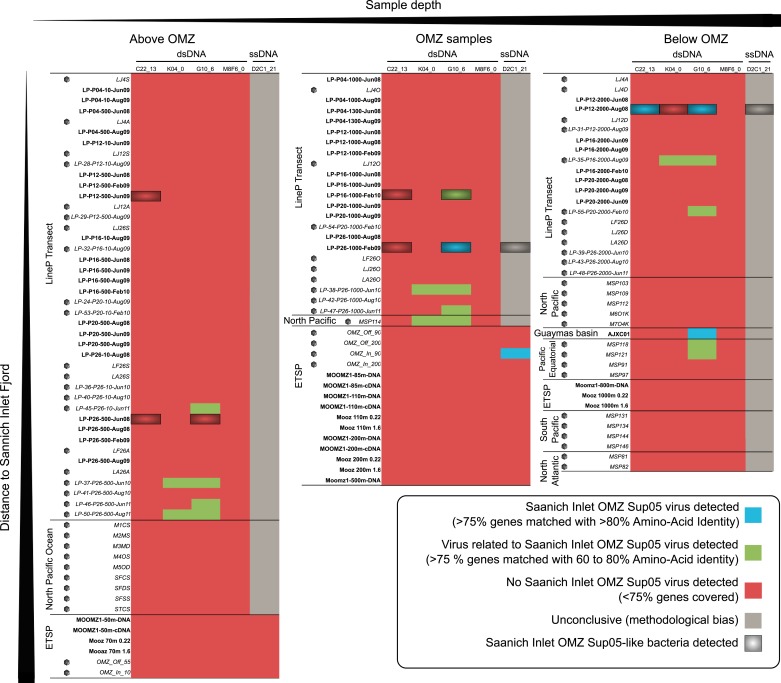
Figure 3—figure supplement 2. Heatmap of detection of SUP05 viruses in oceanic data sets.

Figure 3—figure supplement 2.

Metagenomes are classified from left to right based on the sampling depth as ‘Above the OMZ’, ‘OMZ’, and ‘Below the OMZ’, and vertically ordered based on the geographical sampling region, from the samples closest to Saanich Inlet (on top) to the one farthest from Saanich Inlet (at the bottom). Viral metagenomes are noted with a gray capsid symbol. Each metagenome—viral genome association was classified based on the number of viral genes detected and the amino-acid percentage identity of the BLAST hits associated. The viral genome was thought to be in the sample when more than 75% of the genes were detected at more than 80% of identity in the metagenome (blue cells), when the same ratio of genes detected at lower percentage (60–80%) indicates the presence of a related but distinct virus (green cells). We considered that less than 75% of the genes detected meant that this virus was likely absent from the sample (red cells), except for the detection of the ssDNA Microviridae in HiSeq-Illumina-sequenced viromes, where the procedure used to process samples prior to sequencing is likely to select against the amplification of ssDNA templates (gray cells). Metagenomes in which the associated SUP05 host was detected are highlighted in black (>75% genes on SAG microbial contigs covered with Average Nucleotide Identity > 95%).
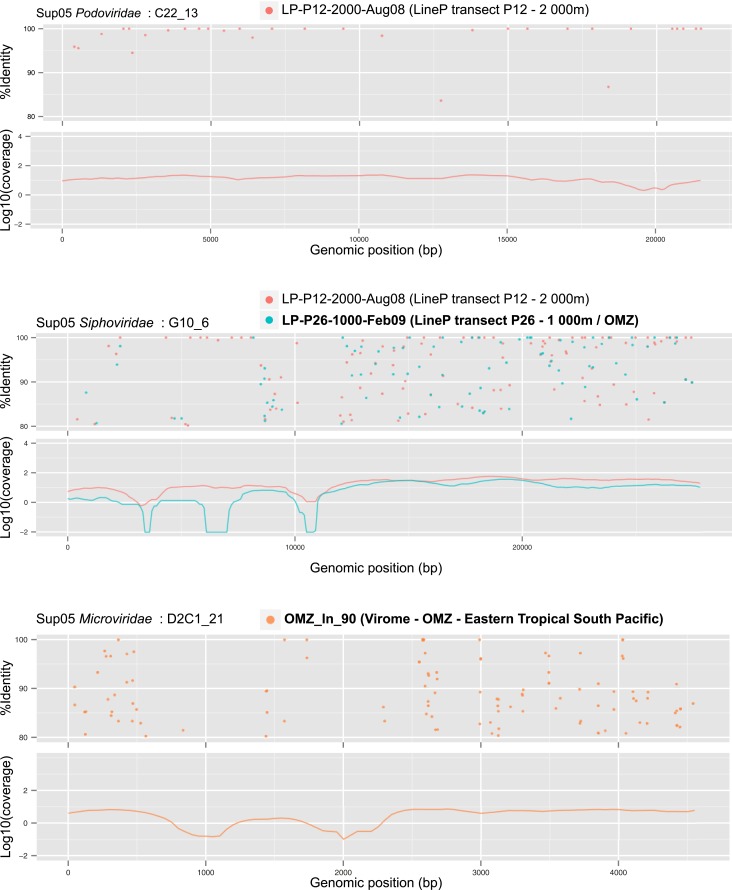
Figure 3—figure supplement 3. Recruitment and coverage plot of SUP05 viral genomes by data sets sampled outside of Saanich Inlet fjord.

Figure 3—figure supplement 3.

Each dot correspond to a match between a metagenome predicted gene and a gene from the SUP05 viral genome fragment, displayed according to the coordinate on the genome (x-axis) and the protein identity percentage (y-axis). For each genome, plots were only generated for data sets in which the genome was detected. Only hits with more than 80% amino-acid identity were considered.