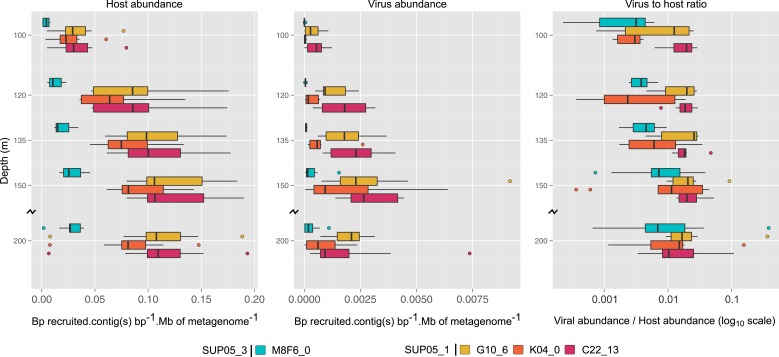
Figure 4. Uncultivated SUP05 lineage-specific virus–host ecology.
Fragment recruitment from Saanich Inlet microbial metagenomes to microbial (95% nucleotide identity) and viral (100% amino-acid identity) reference contigs normalized by contig and metagenome size was used as a proxy for abundance. Hence, the relative abundance of microbial and viral genome is indicated as number of metagenomic bases recruited by contig(s) base pairs (bp) by megabase (Mb) of metagenome. Upper and lower ‘hinges’ of the relative abundance distribution correspond to the first and third quartiles (the 25th and 75th percentiles), while outliers are displayed as points (values beyond 1.5 * Inter-Quartile Range of the hinge). A virus-to-host ratio was then calculated for each SAG (i.e., each virus-host pair) as the ratio of relative abundance of viral contigs to the relative abundance of microbial contigs from the same SAG.

