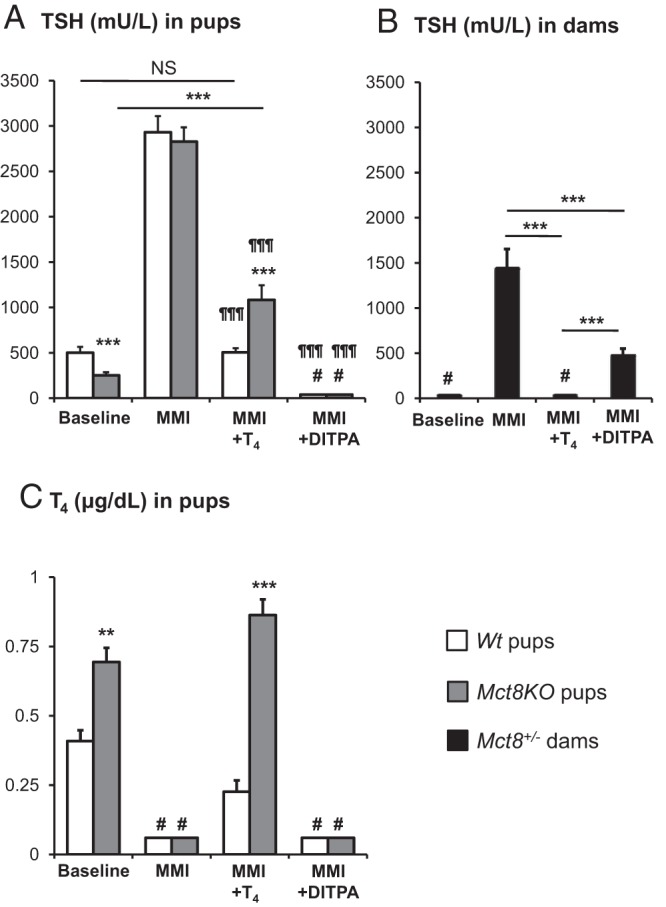
Figure 2.

Comparison of the effect of L-T4 and DITPA on serum TSH concentrations of A, Wt and Mct8KO pups at P0; B, Mct8± dams after delivery; and C, on serum T4 levels of Wt and Mct8KO pups at P0. Data are expressed as mean ± SE. Statistical differences between Wt and Mct8KO pups for each treatment group are indicated by * above the Mct8KO bars. In panel A, statistical differences from the values in Mct8+/− dams; in panel B, are indicated by ¶ above each value bar. The symbol # above bars indicates TSH and T4 values suppressed below limits of the assay sensitivity. Treatment with LoI/MMI/ClO4 is indicated as MMI on the abscissa. **, P < .01; ***, P < .001; ¶¶¶, P < .001. #, below the limit of detection of 20 mU/L for TSH and of 0.1 μg/dl for T4.
