

Abstract
Type 2 diabetes (T2D) incidence in adolescents is rising and may interfere with peak bone mass acquisition. We tested the effects of early-onset T2D on bone mass, microarchitecture, and strength in the TALLYHO/JngJ mouse, which develops T2D by 8 weeks of age. We assessed metabolism and skeletal acquisition in male TALLYHO/JngJ and SWR/J controls (n = 8–10/group) from 4 weeks to 8 and 17 weeks of age. Tallyho mice were obese; had an approximately 2-fold higher leptin and percentage body fat; and had lower bone mineral density vs SWR at all time points (P < .03 for all). Tallyho had severe deficits in distal femur trabecular bone volume fraction (−54%), trabecular number (−27%), and connectivity density (−82%) (P < .01 for all). Bone formation was higher in Tallyho mice at 8 weeks but lower by 17 weeks of age vs SWR despite similar numbers of osteoblasts. Bone marrow adiposity was 7- to 50-fold higher in Tallyho vs SWR. In vitro, primary bone marrow stromal cell differentiation into osteoblast and adipocyte lineages was similar in SWR and Tallyho, suggesting skeletal deficits were not due to intrinsic defects in Tallyho bone-forming cells. These data suggest the Tallyho mouse might be a useful model to study the skeletal effects of adolescent T2D.
The incidence of pediatric type 2 diabetes mellitus (T2D) has risen in parallel with childhood obesity from less than 3% to 45% of new pediatric diabetes cases (1, 2). Of concern for skeletal health, the onset of pediatric T2D at 10–19 years of age coincides with peak skeletal acquisition, when up to 90% of adult bone mass is gained (3–5). Thus, if pediatric T2D impairs skeletal acquisition, affected adolescents may be at risk for future fragility, even if they ultimately achieve diabetes control.
Although clinical data on the effects of pediatric T2D on skeletal acquisition are limited, adults with T2D are at increased risk for fracture, despite normal to high bone mineral density (BMD) (6, 7). Adolescents with type 1 diabetes (T1D) have impaired skeletal acquisition, low peak bone mass, increased fracture risk, and high bone marrow adiposity (8, 9), and adolescents with impaired glucose tolerance have low bone mineral content (10, 11). Although it is not yet known whether adolescents with T2D have high bone marrow adiposity, there is a negative association between marrow adiposity and bone mass in T1D and in healthy subjects (12–14). Furthermore, although the etiologies of T1D and pediatric T2D differ, both involve hyperglycemia, which impairs osteoblast function in vitro (15, 16). In vivo, markers of bone formation increase with improved glycemic control in adults with diabetes (17, 18). Taken together, these data suggest that impaired bone formation in diabetes reflects a noncell autonomous effect (eg, hyperglycemia) rather than a cell autonomous defect, although this hypothesis has not been tested directly.
Here we use a model of polygenic early-onset T2D, the TALLYHO/JngJ mouse (19, 20), to determine how early-onset T2D affects bone acquisition and maintenance. We test two hypotheses: 1) mice with early-onset T2D will exhibit impaired skeletal acquisition secondary to reduced bone formation and increased marrow adipogenesis, and 2) defects in osteoblast function will be noncell autonomous rather than cell autonomous, such that osteoblast activity will normalize when cells are removed from the metabolic environment of diabetes.
Materials and Methods
Mouse model
The Tallyho/JngJ (TH) mouse bears three quantitative trait loci (QTLs) for high body mass and fat pad mass and three QTLs for hyperglycemia (19, 20). Male TH exhibit obesity, hyperinsulinemia, hyperlipidemia, and hyperglycemia, with T2D (fasting blood glucose > 250 mg/dL) by 6 weeks of age (21). Female TH are moderately obese, hyperinsulinemic, and hyperlipidemic, but nondiabetic, and thus were not included in this study (22). The control for TH, the Swiss Webster/J (SWR) mouse, has 86.8% genetic homology without obesity or diabetes (23).
Experimental protocol
We studied male TALLYHO/JngJ and SWR/J mice (Jackson Labs) (n = 8–10/group) from 4 weeks of age to 8 or 17 weeks of age. For the 8-week end point, mice were fed a normal diet ad libitum (Research Diets 12450B, 10% kcal/fat, 50% carbohydrate from sucrose). For the 17-week end point, mice were fed the normal diet ad libitum (n = 5/group) or a high-fat, high-sucrose diet ad libitum (Research Diets 08010907, 20% kcal/fat, 100% carbohydrate from sucrose) (n = 5/group). Diets were purified, phytoestrogen free, and matched for protein and fiber. Body mass and food intake were measured thrice weekly on a digital scale. Body length was measured at 4, 8, 15, and 17 weeks of age. Mice were killed by CO2 inhalation. Experimental protocols were approved by the Beth Israel Deaconess Medical Center Institutional Animal Care and Use Committee.
Glucose tolerance tests
Intraperitoneal glucose tolerance tests were performed at 8 and 12 weeks of age using a OneTouch Ultra blood glucose monitor (LifeScan, Inc). Briefly, after an overnight fast, baseline blood glucose was measured via tail nick, mice were injected ip with sterile glucose solution (1 g/kg), and blood glucose was measured at 15, 30, 60, and 120 minutes after the injection (24).
Peripheral dual-energy X-ray absorptiometry (DXA)
Longitudinal in vivo assessment of whole-body (excluding the head) BMD (WBBMD, grams per square centimeter) and body composition (percentage body fat) was performed at 4, 8, 15, and 17 weeks of age using peripheral DXA (PIXImusII; GE Lunar Corp), as previously described (25).
Serum hormones and bone turnover markers
Blood was collected at the time the animals were killed by cardiac puncture to measure serum leptin, insulin, C-terminal telopeptide of type I collagen (CTX), and procollagen-1 N-peptide (P1NP) as previously described (26).
Specimen harvesting/preparation
At the time the animals were killed, gonadal white adipose depots were harvested and weighed. Femurs, tibiae, and lumbar vertebrae were harvested and defleshed. The right femur and L5 vertebral body were prepared for imaging and biomechanical testing by wrapping in saline-soaked gauze and freezing at −20°C (27). The left femur was immersed in PBS for harvesting of bone marrow. The left tibia was prepared for histology in 100% ethanol at 4°C until processing. The right tibia was fixed in 10% neutral buffered formalin at 4°C overnight and stored in PBS for osmium tetroxide staining.
Trabecular and cortical bone morphology by microcomputed tomography (μCT)
Bone microarchitecture of the distal femur, femoral midshaft, and vertebral body were assessed with high-resolution μCT (μCT40; Scanco Medical), as previously described (28). Scans were acquired using a 12-μm3 isotropic voxel size, 70 kVP, 114 mA, and 200-msec integration time and were subjected to Gaussian filtration and segmentation. At the distal femur, transverse computed tomography slices were evaluated, beginning 360 μm proximal to the growth plate and extending 1800 μm proximally. At the femoral middiaphysis, transverse μCT slices spanning 600 μm were obtained, whereas in the fifth lumbar vertebra, transverse computed tomography slices spanning the entire vertebrae, excluding growth plates, were obtained (2400–3000 μm). Thresholds of 329, 708, and 413 mg/cm3 hydroxyapatite were used to segment bone from soft tissue for the distal femur, femoral diaphysis, and vertebral body, respectively. Terminology and units followed the recommendations of the American Society for Bone and Mineral Research (29).
Osmium tetroxide staining
After fixation in 10% neutral buffered formalin at 4°C, left tibias were decalcified in EDTA, and marrow fat was stained with a 1:1 solution of 2% aqueous osmium tetroxide (OsO4) and 5% potassium dichromate (30–32). Fat volume in the proximal and distal tibia medullary compartments was quantified using high-resolution μCT as described above (μCT40; Scanco Medical). For the proximal tibia, computed tomography slices were evaluated beginning 1 mm below the growth plate and extending 2400 μm distally. In the distal tibia, a 2400-μm region was evaluated beginning at the tibiofibular junction and extending distally. The medullary canal was identified by manually tracing the endocortical border. Osmium-stained marrow fat was segmented from adjacent marrow using a fixed threshold (1134 mg/cm3 hydroxyapatite). Adipose volume (cubic millimeters), marrow volume (cubic millimeters), and adipose/marrow volume fraction (percentage) were measured.
Bone strength testing
After the μCT scanning, biomechanical properties of the femoral midshaft were assessed by three-point bending by applying a flexion moment in the anterior-posterior plane using previously described methods (25). The distance between load supports was 8.0 mm for 8-week-old and 10.0 mm for 17-week-old mice. Force displacement data were used to determine structural properties [ultimate moment, bending stiffness (ultimate moment per millimeter), and postyield displacement (millimeters)]. Data for each specimen were adjusted for femoral midshaft area moment of inertia, as measured by μCT, to derive estimated elastic modulus.
Histology and quantitative histomorphometry
Qualitative histological analysis and quantitative static and dynamic histomorphometry were performed as previously described (33). To examine bone formation rates, calcein (15 mg/kg) was injected ip at 9 days and 2 days prior to the time the animals were killed. Histomorphometric measurements were performed on the secondary spongiosa of the proximal tibial metaphysis using an OsteoMeasure morphometry system (Osteometrics), as previously described (33). The terminology and units followed the recommendations of the American Society for Bone and Mineral Research (34).
Reference point indentation
Cortical bone indentation properties were measured in tibiae of 17-week-old TH and SWR mice (n = 10/group) via reference point indentation (Biodent 1000; Active Life Scientific). The system was equipped with a 90° conical, 2.5 μm radius tip test probe. Indentation tests were conducted at a maximum force of 2 N at 2 Hz for 10 cycles (35). Three indentation measurements of 10 cycles each were taken at the distal end of the tibia in the medial quadrant, a minimum of 500 μm apart, and averaged per specimen. Outcomes included first-cycle indentation distance (micrometers), total indentation distance (micrometers), and indentation distance increase (increase in indentation distance of the last cycle relative to the first cycle, micrometers).
Advanced glycation end-products (AGEs)
Cortical bone samples from the femoral diaphysis were defatted, lyophilized, freeze dried, and hydrolyzed. A fluorometric assay was used to quantify AGEs (36) on a microplate reader (SynergyMX; BioTek). Collagen content was calculated based on the hydroxyproline quantity measured, and total fluorescent AGEs were quantified as nanograms quinine per milligram collagen.
Cell culture
To assess osteogenic differentiation, primary bone marrow stromal cells were harvested from 8-week-old TH and SWR, plated at a density of 1 × 10⁶ cells/cm2 in six-well plates, maintained in growth medium until day 7, and changed to osteoblast differentiation medium (37). Fibroblast colony-forming units (CFU-Fs) were assessed with crystal violet stain on day 5. On day 21, cells were stained for alkaline phosphatase and for mineral with Von Kossa stain to address osteoblast differentiation and function (37). To assess adipogenic differentiation, primary bone marrow stromal cells were plated at a density of 1 × 10⁶ cells/cm2 in six-well plates and maintained in growth medium until confluent, when they were changed to adipocyte differentiation media consisting of DMEM (high glucose + 10% fetal bovine serum + 1% Pen-Strep), with 0.10% rosiglitazone (1 μM); 0.40% isobutylmethylxanthine (0.5 mM); 0.10% insulin (10 μg/mL); and 0.10% dexamethasone (1 μM). On day 2, media were changed to DMEM with 0.10% rosiglitazone and 0.10% insulin, and cultures were maintained on DMEM from day 4 to day 9. On day 9, cells were fixed in 10% formalin and stained for lipid droplets with Oil Red O.
Statistical analyses
Standard descriptive statistics were computed for all outcome variables and data checked for normality. To adjust for body mass differences, we regressed the variable of interest (ie, bone cross-sectional properties) vs body mass and compared residuals (38). The effect of strain on bone variables was evaluated using two-way ANOVA for age and strain, followed by post hoc Fisher's protected least significant difference (PLSD) tests for pairwise comparisons of significant variables. All tests were two tailed, with the significance level for major effects set at α = .05.
Results
High-fat-sucrose diet does not affect skeletal or metabolic phenotype
TH and SWR mice studied from 4 to 8 weeks of age were fed a normal diet, whereas mice studied from 4 to 17 weeks of age were fed either a high-fat-sucrose diet or a normal diet. We observed no significant differences in skeletal or metabolic outcomes, including body mass, percentage fat, glucose tolerance, bone mass, or bone microarchitecture between mice fed the high-fat-sucrose vs the normal diet in either strain. Therefore, for the 17-week end point, high-fat-sucrose and the normal diet groups were pooled within each genotype for subsequent analyses.
TH develop early-onset T2D with obesity, hyperinsulinemia, and hyperleptinemia
TH mice were significantly longer and heavier and consumed 44% more calories per day vs SWR, leading to worsening obesity with age (P < .05 for all, Figure 1, A and B, and Table 1). TH had overt T2D (fasting blood glucose > 250 mg/dL) by 6 weeks of age, with markedly impaired glucose tolerance at 8 and 12 weeks of age (P < .05 for all time points vs SWR, Figure 1, C and D). Body fat (percentage) doubled in TH from 4 to 17 weeks of age, from 18% to 40%, whereas SWR body composition did not change (P < .05 for all time points, Figure 1E). Leptin was 5-fold higher at 8 weeks and 8-fold higher at 17 weeks, whereas insulin was 2-fold higher at 8 weeks and 4-fold higher at 17 weeks of age in TH vs SWR (Table 1, P < .05 for all). Perigonadal white adipose tissue mass at the time the animals were killed was 3- to 4-fold higher in TH vs SWR (P < .05 for both, Table 1).
Figure 1.

A and B, Tallyho became progressively obese (body mass, grams) and hyperphagic (food intake, kilocalories per day). C and D, Tallyho were hyperglycemic (fasting glucose, milligrams per deciliter) and glucose intolerant vs SWR. SWR glucose tolerance did not change from 8 to 12 weeks of age. E and F, Tallyho body fat (percentage) increased sharply from 4 to 8 weeks of age, whereas the WBBMD (grams per square centimeter) was lower vs SWR throughout. Significant differences (P < .05) are indicated by asterisks.
Table 1.
Body Length, Whole-Body Bone Densitometry, Body Fat, and Serum Hormone and Bone Turnover Markers in Male TH and SWR Mice at 8 and 17 Weeks of Age (Mean ± SD)
| 8 Weeks of Age |
17 Weeks of Age |
Pstrain | Pstrainage | |||
|---|---|---|---|---|---|---|
| SWR | TH | SWR | TH | |||
| n | 8 | 8 | 10 | 10 | ||
| Body length, mm | 92.2 (3.9) | 95.6 (1.5)a | 97.9 (2.7) | 102.2 (1.4)a | .0016 | NS |
| WAT, g | 0.30 (0.06) | 1.39 (0.13)a | 0.44 (0.16) | 1.76 (0.38)a | <.001 | NS |
| Serum leptin, ng/mL | 6.22 (4.54) | 32.88 (12.33)a | 5.91 (2.61) | 49.67 (32.91)a | <.001 | NS |
| Serum insulin, ng/mLb | 1.36 (0.69) | 2.95 (1.05)a | 1.11 (0.49) | 4.55 (5.34)a | .0289 | NS |
| P1NP, ng/mL | 50.02 (19.14) | 18.15 (2.59)a | 16.89 (4.35) | 15.41 (3.62) | .0016 | .0034 |
| CTX, ng/mL | 61.42 (55.06) | 86.40 (56.29) | 61.40 (43.35) | 71.19 (37.26) | NS | NS |
Abbreviation: WAT, white adipose tissue.
Bold text indicates significant difference from SWR (P < 0.05, two way ANOVA and Fisher's PLSD).
n = 5–6/group.
TH mice have low WBBMD, severe trabecular deficits, and impaired cortical bone tissue properties
As measured by longitudinal whole-body bone densitometry (DXA), TH had 4%-6% lower WBBMD (grams per square centimeter) from 4- to 17 weeks of age vs SWR (P < .05 for all time points) (Figure 1F). In the distal femur, TH had a severe deficit in trabecular bone volume/total volume (BV/TV) (9% vs 26% in SWR at 8 wk of age, 6% vs 14% in SWR at 17 wk of age), low trabecular number (Tb.N), and connectivity density [(Conn.D); high trabecular separation (Tb.Sp) and structure model index (SMI); [P < .05 for all vs SWR, Figure 2, A–C, and Table 2]; and low trabecular thickness (Tb.Th) only at 8 weeks of age (P < .05 vs SWR, Table 2). However, the cortical shell surrounding the trabecular region was thicker in TH than in SWR at 8 weeks of age, and porosity of the cortical shell was lower at 8 and 17 weeks (P < .05 for all, Table 2).
Figure 2.

In the distal femur, trabecular BV/TV (A; percentage) and Conn.D (B; per millimeter) were markedly lower in Tallyho vs SWR at 8 and 17 weeks of age. C, Overall, Tallyho exhibited severely impaired trabecular microarchitecture at 8 and 17 weeks of age. Significant differences (P < .05) are indicated by brackets.
Table 2.
Trabecular and Cortical Bone Properties in Male TH and SWR Mice at 8 and 17 Weeks of Age (Mean ± SD)
| 8 Weeks of Age |
17 Weeks of Age |
Pstrain | Pstrainage | |||
|---|---|---|---|---|---|---|
| SWR | TH | SWR | TH | |||
| n | 8 | 8 | 10 | 10 | ||
| Distal femur (trabecular) | ||||||
| Tb.N, per mm | 6.73 (0.66) | 3.98 (0.2)a | 3.95 (0.66) | 2.76 (0.33)a | <.0001 | <.0001 |
| Tb.Th, mm | 0.052 (0.002) | 0.047 (0.001)a | 0.051 (0.003) | 0.053 (0.004) | NS | .0003 |
| Tb.Sp, mm | 0.143 (0.020) | 0.250 (0.014)a | 0.262 (0.048) | 0.366 (0.045)a | <.0001 | NS |
| SMI | 1.75 (0.23) | 3.02 (0.08)a | 2.18 (0.15) | 3.13 (0.25)a | <.0001 | <.0001 |
| Cortical porosity, % | 12.04 (3.15) | 7.49 (0.63) | 6.77 (0.32) | 5.14 (0.97) | <.0001 | .0104 |
| Cortical thickness, mm | 0.080 (0.008) | 0.100 (0.008)a | 0.102 (0.007) | 0.111 (0.007) | <.0001 | <.0001 |
| Midshaft femur (cortical) | ||||||
| BA/TA, % | 44.5 (1.9) | 50.4 (2.2)a | 49.5 (3.3) | 56.5 (3.3)a | <.0001 | NS |
| Cortical thickness, mm | 0.180 (0.010) | 0.193 (0.005)a,b | 0.186 (0.015) | 0.218 (0.016)a,b | <.0001b | .0334b |
| Imax, mm4 | 0.201 (0.030) | 0.174 (0.020) | 0.175 (0.023) | 0.205 (0.022) | NS | .0016 |
| Imin, mm4 | 0.115 (0.013) | 0.087 (0.012)a | 0.098 (0.005) | 0.102 (0.011)c | .0016 | <.0001 |
| pMOI, mm4 | 0.316 (0.043) | 0.262 (0.031) | 0.273 (0.028) | 0.307 (0.030) | NS | .0004 |
| Fifth lumbar vertebra (trabecular) | ||||||
| BV/TV, % | 32.5 (2.4) | 27.3 (1.9)a | 28.7 (4.2) | 25.0 (2.5)a | <.0001 | NS |
| Tb.N, per mm | 5.41 (0.26) | 5.03 (0.24) | 4.90 (0.53) | 4.86 (0.18) | NS | NS |
| Tb.Th, mm | 0.056 (0.002) | 0.057 (0.001) | 0.055 (0.002) | 0.054 (0.003) | NS | NS |
| Tb.Sp, mm | 0.192 (0.011) | 0.190 (0.013) | 0.209 (0.023) | 0.197 (0.009) | NS | NS |
| Conn.D, per mm | 340.9 (23.1) | 220.6 (25.0)a | 250.7 (33.7) | 200.2 (17.2)a | <.0001 | .0003 |
| SMI | 0.055 (0.280) | 0.766 (0.218)a | 0.478 (0.437) | 0.965 (0.228)a | <.0001 | NS |
Abbreviation: NS, not significant. Trabecular parameters included BV/TV (percentage), Tb.Th (micrometers), Tb.Sp (micrometers), Tb.N (1/millimeter), Conn.D (1/cubic millimeters), and SMI. Cortical parameters included total cross-sectional area, cortical bone area, and medullary area (TA, BA, and MA, square millimeters); BA/TA (percentage), cortical thickness (micrometers), and area moments of inertia (Imax, Imin, and pMOI, millimeters to the fourth power).
Bold text indicates significant difference from SWR (P < .05, two way ANOVA and Fisher's PLSD).
No longer significant after body mass adjustment.
Statistically significant after body mass adjustment.
At the midshaft femur, TH mice had lower total area (TA) at 8 weeks of age and higher bone area (BA) at 17 weeks of age compared with SWR, such that bone area fraction (percentage) was higher in TH vs SWR at both time points (P < .05 for all, Figure 3, A and B, and Table 2). Cortical thickness was also higher in TH vs SWR at both time points (P < .05 for both, Table 2). However, the differences in BA, TA, and cortical thickness no longer reached significance after the body mass adjustment (Table 2). Despite their similar length, Tallyho femurs had lower maximum moment of inertia (Imax), minimum moment of inertia (Imin), and polar moment of inertia (pMOI) at 8 weeks of age and higher Imax and pMOI at 17 weeks of age compared with SWR femurs, both before and after body mass adjustment (P < .05 vs SWR, Figure 3C and Table 2).
Figure 3.

In the midshaft femur, Tallyho had A. lower unadjusted BA at 17 weeks of age (A; square millimeters) and lower unadjusted TA at 12 weeks of age (B; square millimeters) vs SWR, but these differences were no longer significant after body mass adjustment. C, Overall, bone length was similar in Tallyho and SWR at 8 and 17 weeks of age, but Tallyho had a lower Imax, Imin, and pMOI at 8 weeks of age and a higher Imax and pMOI at 17 weeks of age vs SWR (see Table 2). Significant differences (P < .05) are indicated by brackets.
Vertebral trabecular bone microarchitecture in TH had less severe deficits. In the fifth lumbar vertebra, trabecular BV/TV was 10%-13% lower in TH, with low Conn.D and high SMI at both ages as well as low Tb.N at 8 weeks of age (P < .05 for all vs SWR, Table 2).
More brittleness and less resistance to indentation in TH bone
Three-point bending of the femoral diaphysis revealed that TH had normal to high stiffness and ultimate force vs SWR (Table 3). There were no differences in stiffness or elastic modulus at either age. However, postyield displacement was significantly lower in TH vs SWR, indicating increased brittleness (−59% at 8 wk, −48% at 17 wk, P < .05, Figure 4A). Furthermore, the reference point indentation of the tibia indicated that first-cycle indentation distance and total indentation distance were 34% and 28% greater, respectively, in TH vs SWR at 17 weeks of age (P < .05, Figure 4B and Table 3), suggesting impaired material properties in TH despite normal cortical geometry.
Table 3.
Bone Strength Testing by Three-Point Bending of the Femoral Diaphysis at 8 and 17 Weeks of Age, Reference Point Indentation of the Tibia in Male TH and SWR Mice at 17 Weeks of Age, and Static and Dynamic Histomorphometry of Proximal Tibial Metaphysis in Male TH and SWR Mice at 8 and 17 Weeks of Age (Mean ± SD)
| 8 Weeks of Age |
17 Weeks of Age |
Pstrain | Pstrain*age | |||
|---|---|---|---|---|---|---|
| SWR | TH | SWR | TH | |||
| n | 6–10 | 6–10 | 6–10 | 6–10 | ||
| Femoral three-point bending | ||||||
| Ultimate force, N | 13.64 (1.50) | 13.52 (1.03) | 15.94 (1.37) | 17.84 (1.26)a | .0565 | .0307 |
| Stiffness, N/mm | 42.30 (7.85) | 45.53 (6.79) | 67.19 (7.22) | 69.23 (9.41) | NS | NS |
| Estimated elastic modulus, GPa | 3.27 (0.79) | 5.00 (1.20)* | 8.46 (1.12) | 7.41 (2.03) | NS | .0069 |
| Reference probe indentation | ||||||
| First indentation distance, ID first, μm | NA | NA | 50.23 (8.65) | 67.30 (22.95)a | .0411 | NA |
| Indentation distance increase, last-first, μm | NA | NA | 13.87 (5.67) | 14.03 (4.15) | NS | NA |
| Static and dynamic histomorphometry | ||||||
| MS/BS, % | 8.89 (4.52) | 18.76 (3.37)a | 15.77 (6.89) | 8.83 (7.43) | NS | .0026 |
| MAR, mm/d | 0.92 (0.13) | 1.38 (0.24)a | 0.68 (0.08) | 0.48 (0.40) | <.001 | .0045 |
| BFR/BS, mm3/mm2 · y | 0.086 (0.058) | 0.259 (0.062)a | 0.108 (0.050) | 0.042 (0.031)a | .0292 | <.001 |
| N.Ob/T.Ar, per mm | 2.084 (0.835) | 5.008 (2.022)a | 0.98 (0.615) | 1.359 (1.185) | .0088 | .0363 |
| N.Oc/T.Ar, per mm | 5.403 (1.212) | 3.83 (0.743)a | 3.528 (2.02) | 1.987 (1.332) | .0196 | NS |
| N.Ad/T.Ar, per mm | 0.29 (0.71) | 14.54 (5.18)a | 1.40 (1.04) | 9.96 (6.64) | <.001 | NS |
| BS, mm | 14.45 (2.38) | 7.62 (3.29)a | 4.46 (1.76) | 2.36 (1.22)a | <.001 | .0016 |
Abbreviation: NA, data not available; N.Ad/T.Ar, number of adipocytes per total area; ID, indentation distance; MS, mineralizing surface; N.Ob/T.Ar, number of osteoblasts per total area; N.Oc/T.Ar, number of osteoclasts per total area.
Bold text indicates significant difference from SWR (P < 0.05, two way ANOVA and Fisher's PLSD).
Figure 4.

A, Tallyho femurs showed low postyield displacement by mechanical testing indicating bone brittleness. B, High total indentation distance (TID) confirmed altered material properties in Tallyho vs SWR. C, Accumulation of nonenzymatic AGEs did not differ in Tallyho vs SWR (P = .074). Significant differences (P < .05) are indicated by brackets.
Low bone formation and high bone marrow adiposity with TH diabetes progression
Dynamic histomorphometry in the proximal tibia showed that bone formation rate (BFR)/bone surface (BS) (cubic micrometer per square micrometer per day), mineralizing surface per bone surface (MS/BS) (percentage), and mineral apposition rate (MAR; micrometers per day) were 50%-100% higher in TH vs SWR at 8 weeks of age (P < .05 for all). By 17 weeks of age, BFR/BS was 60% lower (P < .05), and there were trends toward lower MS/BS and MAR in TH vs SWR (Table 3). TH had more osteoblasts but fewer osteoclasts vs SWR at 8 weeks (P < .05 for both) but not at 17 weeks of age (P = NS, Table 3). However, the bone formation marker P1NP was 43% lower in TH at 8 weeks of age (P < .05 vs SWR), whereas the bone resorption marker CTX did not differ (Table 1). We also noted that BS in TH was only about half that of SWR at both 8 and 17 weeks of age (P < .05, Table 3). Thus, higher BFR/BS in TH at 8 weeks of age is due in part to their low bone surface area. There were no significant differences in CTX or P1NP at 17 weeks of age.
Bone marrow adiposity was 50-fold higher at 8 weeks and 7-fold higher at 17 weeks in TH vs SWR (P < .05 for both, Table 3). Osmium tetroxide staining of the tibia at 8 weeks of age confirmed that fat comprised a higher percentage of marrow volume in TH vs SWR (Figure 5, A and B) in both the proximal tibia (16% vs < 0.2%) and distal tibia (24% vs 4%, P < .05 for both).
Figure 5.
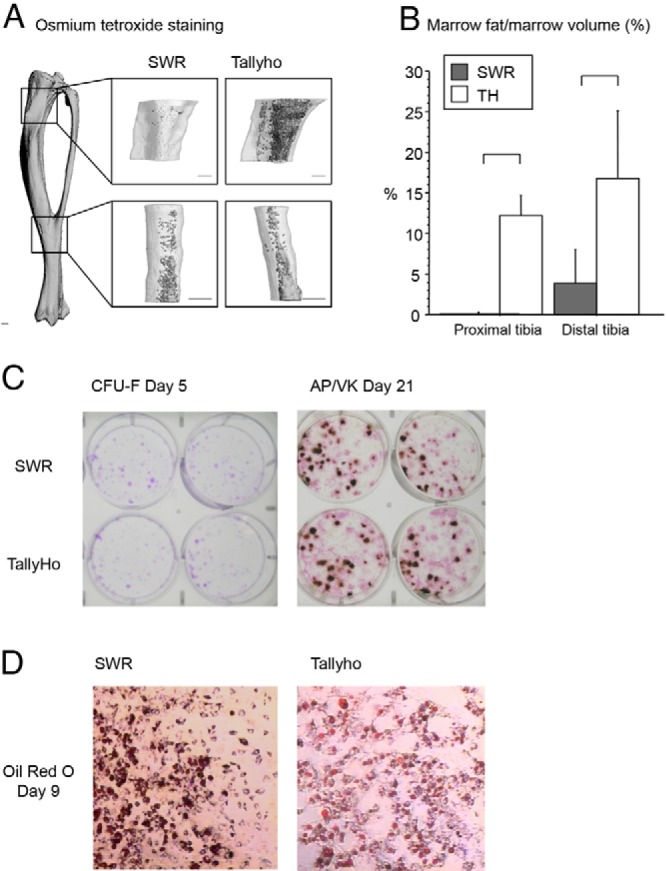
A, Osmium tetroxide staining of the tibia showed high marrow fat per marrow volume in Tallyho at 8 weeks of age. Staining was quantified in a region beginning 1 mm below the proximal growth plate (top images) and a region distal to the inferior tibiofibular joint (bottom images). Scale bars, 0.5 mm. B, Quantification of stained cells confirmed high marrow fat/marrow volume (percentage) in TH vs SWR in both the proximal and distal tibia (P < .05 for both). C, Primary bone marrow stromal cell proliferation and differentiation to the osteoblast lineage was not different between SWR and TH mice. Primary bone marrow stromal cells were plated at a density of 1 × 10⁶ cells/cm2 in six-well plates and maintained in growth medium until day 7, when they were changed to osteoblast differentiation medium. CFU-Fs were assessed with crystal violet stain on day 5. On day 21, cells were stained for alkaline phosphatase and for mineral with Von Kossa stain to address osteoblast differentiation and function. Results are representative of one experiment (performed in duplicate). D, Adipogenic differentiation from primary bone marrow stromal cells was not different between SWR and TH mice. Primary bone marrow stromal cells were plated at a density of 1 × 10⁶ cells/cm2 in six-well plates and maintained in growth medium until confluent, when they were changed to adipocyte differentiation media. Cells were fixed and stained for lipid droplets with Oil Red O on day 9 of adipocyte differentiation. Results are representative of one experiment (performed in duplicate).
Advanced glycation end-products in TH
Levels of AGEs per milligram of collagen, normalized to quinine sulfate, were not significantly different in TH vs SWR (P = .074, Figure 4C).
Normal osteoblast proliferation and differentiation in TH cell culture
Primary bone marrow stromal cell proliferation and differentiation to the osteoblast lineage, assessed by crystal violet staining of CFU-Fs on day 5 and by alkaline phosphatase and Von Kossa staining for mineralization on day 21, respectively, were not different between SWR and TH mice (Figure 5C). There were also no differences in adipogenic differentiation between SWR and TH as shown by Oil Red O staining on day 9 (Figure 5D).
Discussion
In this study, we examined the effects of early-onset T2D on body composition and bone properties in young, rapidly growing male mice. We hypothesized that mice with early-onset T2D would have impaired skeletal acquisition due to reduced bone formation and increased marrow adipogenesis and that defects in bone formation would be cell independent rather than cell autonomous, resulting from the metabolic milieu of diabetes rather than intrinsic differences in osteoblast function. To test these predictions, we compared metabolism and skeletal acquisition in male TALLYHO/JngJ mice, a model of early-onset polygenic T2D, and SWR/J (control) mice from 4 weeks of age to 8 and 17 weeks of age. Tallyho (TH) were obese, hyperleptinemic, hyperinsulinemic, and hyperglycemic by 4 weeks of age, progressing rapidly to T2D by 6 weeks of age and thus were exposed to the metabolic characteristics of T2D throughout subadult growth and peak skeletal acquisition. At 17 weeks of age, TH remained hyperinsulinemic, with higher interindividual variability in insulin production than at 8 weeks of age.
In support of our first hypothesis, TH had a severe trabecular bone deficit, with only one-third of the distal femur bone volume fraction seen in SWR controls. TH also had lower cortical porosity in the distal femur, with thicker cortices at 8 weeks of age, suggesting a potential compensation of the cortical compartment for the reduced trabecular bone properties in growing TH bones. This pattern is in contrast to adult humans, in whom high cortical porosity has been seen in individuals with T2D and a prior history of fracture (39, 40). Longitudinal DXA measurements showed TH had lower whole-body BMD from 4 to 17 weeks of age, suggesting impaired bone mass acquisition. At the midshaft femur, TH exhibited higher cortical bone area fraction and thickness at both 8 and 17 weeks, whereas cross-sectional geometric properties (Imax, Imin, and pMOI) were lower at 8 weeks and higher at 17 weeks of age vs SWR. Three-point bending tests of the midfemoral diaphysis indicated stronger but more brittle bones in TH at 17 weeks of age. At the tissue level, reference point indentation testing of cortical bone revealed that total indentation distance was greater in TH vs SWR, consistent with lower resistance to microfracture in TH bone. Although levels of AGEs initially appeared to be higher in TH bones, particularly in younger-aged mice, these differences did not reach statistical significance (P = .074). The accumulation of AGEs, a central feature in the pathogenesis of diabetes, has been linked to increased fracture risk in individuals with diabetes (41).
Static and dynamic histomorphometry and serum bone turnover markers showed that TH had increased indices of bone formation (ie, more osteoblasts, increased bone formation rate) and fewer osteoclasts but lower serum P1NP compared with SWR at 8 weeks of age. These differences attenuated or reversed by 17 weeks of age. The histological and serum markers of high bone formation seen at 8 weeks of age were not reflected in improved trabecular bone architecture. It is possible that bone formation was high in an attempt to catch up with earlier skeletal deficits and/or that in the microenvironment of high blood glucoses within the marrow, osteoblast function is impaired despite the recruitment of sufficient numbers of bone-forming cells. This finding would be consistent with in vitro studies demonstrating deleterious effects of hyperglycemia on osteoblast function (16).
Marrow adiposity was markedly higher in TH compared with SWR at both time points, as quantified by both histology and osmium tetroxide staining. This pattern is consistent with observations in humans that marrow fat is inversely correlated with bone mass, even in healthy individuals (12, 14). In terms of diabetes, marrow adiposity in pediatric T2D has not been measured to date, but high marrow fat is seen in T1D (42). Adults with T2D have more saturated and less unsaturated marrow fat, and marrow adiposity is positively correlated with glycosylated hemoglobin A1C level, suggesting that bone marrow adipose tissue could be a marker of overall glucose control (43, 44).
In support of our second hypothesis, which predicted that reduced osteoblast function in TH would be cell independent, in vitro cultures of primary bone marrow stromal cells showed no differences in osteogenic and adipogenic differentiation between SWR and TH mice. Primary cultures from each strain generated similar numbers of CFU-Fs and showed similar osteoblast differentiation and mineralization. Despite the high marrow adiposity observed in TH vs SWR in vivo, there were no differences between the strains in in vitro adipogenic differentiation. Thus, bone marrow stromal cells from TH mice exhibited normal osteoblast and adipocyte behavior once they were removed from the metabolic environment of T2D, strongly supporting the hypothesis that impaired bone cell function in TH is not cell autonomous but rather is a consequence of diabetes.
Given these data, our working hypothesis is that the trabecular deficit in the Tallyho mouse is the result of impaired osteoblast function due to pediatric T2D. At 8 weeks of age, TH exhibited higher bone formation rate and more osteoblasts but lower bone surface and lower P1NP, a bone formation marker, compared with SWR. By 17 weeks of age, TH had lower bone formation rate compared with SWR, with lower bone surface but no difference in osteoblast number or P1NP. These data are consistent with a defect in osteoblast function, particularly at 17 weeks of age. Appropriate numbers of osteoblast progenitors are being recruited, but their function may be highly impaired, resulting in a severe defect in trabecular bone volume. A similar pattern of normal or increased osteoblast recruitment but decreased bone output has been observed in other models, including conditional deletion of the IGF-1 receptor in osteoblasts, and in the sml (small) mouse (45, 46). Both hyperglycemia itself and hyperglycemia-induced nonenzymatic glycation have been shown to impede osteoblast activity, thereby mimicking age associated bone loss (16, 42). Another possibility is diversion of bone marrow stromal cells to the adipocyte rather than the osteoblast lineage, a potential cause of T1D-induced bone loss (47). Finally, marrow adipocytes produce the protein adiponectin, which appears to have positive effects on human osteoblasts in vitro (48, 49) but is negatively associated with BMD in clinical studies (50, 51). Both of these mechanisms would be consistent with the increase in marrow adiposity and low bone mass seen in Tallyho.
Comparing our results to prior studies, Won et al (52) studied Tallyho from 4 to 20 weeks of age and reported higher IL-6 and receptor activator of nuclear factor-κB ligand and lower osteoprotegerin activity, concluding that hyperleptinemia-induced up-regulation of receptor activator of nuclear factor-κB ligand via IL-6 and IL-17 led to increased osteoclastogenesis and bone loss in TH. In contrast, we did not observe greater bone resorption or osteoclast number in TH (Table 3). Rather, our data support the hypothesis that low trabecular bone volume in TH is due to impaired bone acquisition rather than accelerated bone loss. This discrepancy may reflect differing experimental approaches. Won et al (52) assessed volumetric BMD (milligrams per cubic centimeter) via microcomputed tomography at 4, 8, and 12 weeks of age and found that TH BMD did not differ from controls at 4 weeks and was lower than controls at 8 and 12 weeks of age but did not report trabecular or cortical microarchitecture or static or dynamic histomorphometry. In the current study, we measured areal BMD (milligrams per square centimeter) longitudinally from 4 to 17 weeks of age and found that BMD increased in both TH and SWR from 4 to 8 weeks of age and was maintained from 8 to 17 weeks of age. Another key difference is that the control strain used by Won et al (52) was C57BL/6J, whereas the controls in this study were SWR/J, the most genetically homologous strain to TH (53).
In terms of T2D and bone health in adolescents, these results suggest that T2D may have serious consequences for peak bone mass acquisition. It remains to be determined whether the skeletal phenotype of adolescents with early-onset T2D is more like that of T1D, with low peak bone mass and high marrow adiposity (8, 9), or more like adult T2D, with normal to high bone mass but elevated fracture risk (6, 7). In T1D, low bone mass has been linked to decreased bone formation and increased bone resorption, in both humans and experimental animals, with potential hormonal mechanisms including low IGF levels during adolescent peak bone mass acquisition (54). T2D in adults, with onset after peak bone mass acquisition is complete, typically involves increased risk of fracture despite normal or even high BMD, with increased fracture risk, possibly involving changes in bone tissue level properties, such as increased nonenzymatic glycation, and/or higher intracortical porosity leading to lower bone strength, with decreased bone turnover (55). If the skeletal phenotype of pediatric T2D is similar to that of the Tallyho mouse, it is likely that affected adolescents will be at elevated risk for osteoporosis and fracture due to impaired bone acquisition.
The experimental approach used here has both strengths and limitations. A major strength is the Tallyho/JngJ model, which recapitulates key features of pediatric T2D including early disease onset, obesity and hyperinsulinemia, and a polygenic origin (1). However, in the current study, we evaluated only males because female Tallyho are obese but nondiabetic (22). Future studies including female Tallyho will provide additional normoglycemic controls to study the effects of adiposity on bone mass and architecture. Another potential limitation is that the Tallyho skeletal phenotype could be a result of the QTLs introduced into the Tallyho genome, rather than a secondary consequence of diabetes metabolism. This possibility seems unlikely, given that Tallyho bone marrow stromal cells behave normally in vitro, suggesting the defect in osteoblast function is due to diabetes metabolism.
Conclusions
The Tallyho mouse is a model of polygenic early-onset T2D that exhibits key clinical correlates of human pediatric T2D, including diabetes onset during peak skeletal acquisition and hyperglycemia with obesity and hyperinsulinemia. Tallyho mice have severe deficits in trabecular bone volume, bone brittleness, altered cortical bone indentation properties, high marrow adiposity, and a trend toward accumulation of advanced glycation endproducts. The defect in Tallyho bone formation is cell independent and likely due to diabetes metabolism. Thus, although more data are needed to establish the effects of pediatric T2D on the human skeleton, the Tallyho mouse is an important model for understanding how T2D affects bone cells in vitro and in vivo. Additional studies are needed to delineate the mechanisms underlying alterations in bone metabolism seen in this model.
Acknowledgments
This work was supported by National Institutes of Health Grants RC1AR058389, F32HD060419, R24DK092759, F32AR061932, S10RR017868, and R01AG040217.
Disclosure Summary: The authors have nothing to disclose.
Footnotes
- AGE
- advanced glycation end-product
- BA
- bone area
- BFR
- bone formation rate
- BMD
- bone mineral density
- BS
- bone surface
- BV/TV
- bone volume/total volume
- CFU-F
- fibroblast colony-forming unit
- Conn.D
- connectivity density
- μCT
- microcomputed tomography
- CTX
- C-terminal telopeptide of type I collagen
- DXA
- dual-energy X-ray absorptiometry
- Imax
- maximum moment of inertia
- Imin
- minimum moment of inertia
- MAR
- mineral apposition rate
- MS/BS
- mineralizing surface per bone surface
- PLSD
- protected least significant difference
- P1NP
- procollagen-1 N-peptide
- pMOI
- polar moment of inertia
- QTL
- quantitative trait loci
- SMI
- structure model index
- SWR
- Swiss Webster/J
- TA
- total area
- Tb.N
- trabecular number
- Tb.Sp
- trabecular separation
- Tb.Th
- trabecular thickness
- T1D
- type 1 diabetes
- T2D
- type 2 diabetes mellitus
- TH
- Tallyho/JngJ
- WBBMD
- whole-body BMD.
References
- 1. Zeitler P, Hirst K, Pyle L, et al. A clinical trial to maintain glycemic control in youth with type 2 diabetes. N Engl J Med. 2012;366:2247–2256 [DOI] [PMC free article] [PubMed] [Google Scholar]
- 2. Pinhas-Hamiel O, Zeitler P. The global spread of type 2 diabetes mellitus in children and adolescents. J Pediatr. 2005;146:693–700 [DOI] [PubMed] [Google Scholar]
- 3. Bailey DA. The Saskatchewan Pediatric Bone Mineral Accrual Study: bone mineral acquisition during the growing years. Int J Sports Med. 1997;18(suppl 3):S191–S194 [DOI] [PubMed] [Google Scholar]
- 4. Bonjour JP, Theintz G, Buchs B, Slosman D, Rizzoli R. Critical years and stages of puberty for spinal and femoral bone mass accumulation during adolescence. J Clin Endocrinol Metab. 1991;73:555–563 [DOI] [PubMed] [Google Scholar]
- 5. Bachrach LK, Katzman DK, Litt IF, Guido D, Marcus R. Recovery from osteopenia in adolescent girls with anorexia nervosa. J Clin Endocrinol Metab. 1991;72:602–606 [DOI] [PubMed] [Google Scholar]
- 6. Schwartz AV, Vittinghoff E, Bauer DC, et al. Study of Osteoporotic Fractures Research Group, Osteoporotic Fractures in Men Research Group, Health A, Body Composition Research Group: association of BMD and FRAX score with risk of fracture in older adults with type 2 diabetes. JAMA. 2011;305:2184–2192 [DOI] [PMC free article] [PubMed] [Google Scholar]
- 7. Yamamoto M, Yamaguchi T, Yamauchi M, Kaji H, Sugimoto T. Diabetic patients have an increased risk of vertebral fractures independent of BMD or diabetic complications. J Bone Miner Res. 2009;24:702–709 [DOI] [PubMed] [Google Scholar]
- 8. Masse PG, Pacifique MB, Tranchant CC, et al. Bone metabolic abnormalities associated with well-controlled type 1 diabetes (IDDM) in young adult women: a disease complication often ignored or neglected. J Am Coll Nutr. 2010;29:419–429 [DOI] [PubMed] [Google Scholar]
- 9. Gunczler P, Lanes R, Paz-Martinez V, et al. Decreased lumbar spine bone mass and low bone turnover in children and adolescents with insulin dependent diabetes mellitus followed longitudinally. J Pediatr Endocrinol Metab. 1998;11:413–419 [DOI] [PubMed] [Google Scholar]
- 10. Pollock NK, Bernard PJ, Wenger K, et al. Lower bone mass in prepubertal overweight children with prediabetes. J Bone Miner Res. 2010;25:2760–2769 [DOI] [PMC free article] [PubMed] [Google Scholar]
- 11. Afghani A, Cruz ML, Goran MI. Impaired glucose tolerance and bone mineral content in overweight Latino children with a family history of type 2 diabetes. Diabetes Care. 2005;28:372–378 [DOI] [PubMed] [Google Scholar]
- 12. Di Iorgi N, Mo AO, Grimm K, Wren TA, Dorey F, Gilsanz V. Bone acquisition in healthy young females is reciprocally related to marrow adiposity. J Clin Endocrinol Metab. 2010;95:2977–2982 [DOI] [PMC free article] [PubMed] [Google Scholar]
- 13. McCabe LR. Understanding the pathology and mechanisms of type I diabetic bone loss. J Cell Biochem. 2007;102:1343–1357 [DOI] [PubMed] [Google Scholar]
- 14. Shen W, Chen J, Gantz M, et al. MRI-measured pelvic bone marrow adipose tissue is inversely related to DXA-measured bone mineral in younger and older adults. Eur J Clin Nutr. 2012;66:983–988 [DOI] [PMC free article] [PubMed] [Google Scholar]
- 15. Garcia-Hernandez A, Arzate H, Gil-Chavarria I, Rojo R, Moreno-Fierros L. High glucose concentrations alter the biomineralization process in human osteoblastic cells. Bone. 2012;50:276–288 [DOI] [PubMed] [Google Scholar]
- 16. Botolin S, McCabe LR. Chronic hyperglycemia modulates osteoblast gene expression through osmotic and non-osmotic pathways. J Cell Biochem. 2006;99:411–424 [DOI] [PubMed] [Google Scholar]
- 17. Sayinalp S, Gedik O, Koray Z. Increasing serum osteocalcin after glycemic control in diabetic men. Calcif Tissue Int. 1995;57:422–425 [DOI] [PubMed] [Google Scholar]
- 18. Rosato MT, Schneider SH, Shapses SA. Bone turnover and insulin-like growth factor I levels increase after improved glycemic control in noninsulin-dependent diabetes mellitus. Calcif Tissue Int. 1998;63:107–111 [DOI] [PubMed] [Google Scholar]
- 19. Kim JH, Stewart TP, Soltani-Bejnood M, et al. Phenotypic characterization of polygenic type 2 diabetes in TALLYHO/JngJ mice. J Endocrinol. 2006;191:437–446 [DOI] [PubMed] [Google Scholar]
- 20. Kim JH, Sen S, Avery CS, et al. Genetic analysis of a new mouse model for non-insulin-dependent diabetes. Genomics. 2001;74:273–286 [DOI] [PubMed] [Google Scholar]
- 21. Clee SM, Attie AD. The genetic landscape of type 2 diabetes in mice. Endocr Rev. 2007;28:48–83 [DOI] [PubMed] [Google Scholar]
- 22. Kim JH, Saxton AM. The TALLYHO mouse as a model of human type 2 diabetes. Methods Mol Biol. 2012;933:75–87 [DOI] [PubMed] [Google Scholar]
- 23. Mathews CE, Leiter EH. Rodent models for the study of diabetes. In: Kahn CR, Weir GC, King GL, Jacobson AM, Moses AC, Smith RJ, eds. Joslin's Diabetes Mellitus. 14th ed Philadelphia: Lippincott Williams, Willkins; 2005:292–328 [Google Scholar]
- 24. Heikkinen S, Argmann CA, Champy MF, Auwerx J. Evaluation of glucose homeostasis. Curr Protoc Mol Biol 2007;Chapter 29:Unit 29B 23 [DOI] [PubMed] [Google Scholar]
- 25. Bouxsein ML, Devlin MJ, Glatt V, Dhillon H, Pierroz DD, Ferrari SL. Mice lacking β-adrenergic receptors have increased bone mass, but are not protected from deleterious skeletal effects of ovariectomy. Endocrinology. 2009;150:144–152 [DOI] [PMC free article] [PubMed] [Google Scholar]
- 26. Rosen CJ, Ackert-Bicknell CL, Adamo ML, et al. Congenic mice with low serum IGF-I have increased body fat, reduced bone mineral density, and an altered osteoblast differentiation program. Bone. 2004;35:1046–1058 [DOI] [PubMed] [Google Scholar]
- 27. Devlin MJ, Cloutier AM, Thomas NA, et al. Caloric restriction leads to high marrow adiposity and low bone mass in growing mice. J Bone Miner Res. 2010;25:2078–2088 [DOI] [PMC free article] [PubMed] [Google Scholar]
- 28. Glatt V, Canalis E, Stadmeyer L, Bouxsein ML. Age-related changes in trabecular architecture differ in female and male C57BL/6J mice. J Bone Miner Res. 2007;22:1197–1207 [DOI] [PubMed] [Google Scholar]
- 29. Bouxsein ML, Boyd SK, Christiansen BA, Guldberg RE, Jepsen KJ, Muller R. Guidelines for assessment of bone microstructure in rodents using micro-computed tomography. J Bone Miner Res. 2010;25:1468–1486 [DOI] [PubMed] [Google Scholar]
- 30. Turello R, Snyder D, Hartman HA. A modification the osmium tetroxide post-fixation technique for the demonstration of extracellular lipid in paraffin-embedded tissue sections. J Histotechnol. 1984;7:75–77 [Google Scholar]
- 31. Fretz JA, Nelson T, Xi Y, Adams DJ, Rosen CJ, Horowitz MC. Altered metabolism and lipodystrophy in the early B-cell factor 1-deficient mouse. Endocrinology. 2010;151:1611–1621 [DOI] [PMC free article] [PubMed] [Google Scholar]
- 32. Scheller EL, Troiano N, Vanhoutan JN, et al. Use of osmium tetroxide staining with microcomputerized tomography to visualize and quantify bone marrow adipose tissue in vivo. Methods Enzymol. 2014;537:123–139 [DOI] [PMC free article] [PubMed] [Google Scholar]
- 33. Gazzerro E, Pereira RC, Jorgetti V, Olson S, Economides AN, Canalis E. Skeletal overexpression of gremlin impairs bone formation and causes osteopenia. Endocrinology. 2005;146:655–665 [DOI] [PubMed] [Google Scholar]
- 34. Dempster DW, Compston JE, Drezner MK, et al. Standardized nomenclature, symbols, and units for bone histomorphometry: a 2012 update of the report of the ASBMR Histomorphometry Nomenclature Committee. J Bone Miner Res. 2013;28:2–17 [DOI] [PMC free article] [PubMed] [Google Scholar]
- 35. Roberts B, Thomas N, Brimer D, Proctor A, Bouxsein ML. Use of a novel microindentation system demonstrates age- and strain related differences in cortical bone material properties in C3H/HeJ and C57Bl6/J mice. J Bone Miner Res. 2009;24 (Suppl 1). [Google Scholar]
- 36. Karim L, Vashishth D. Heterogeneous glycation of cancellous bone and its association with bone quality and fragility. PloS One. 2012;7:e35047. [DOI] [PMC free article] [PubMed] [Google Scholar]
- 37. DeMambro VE, Clemmons DR, Horton LG, et al. Gender-specific changes in bone turnover and skeletal architecture in igfbp-2-null mice. Endocrinology. 2008;149:2051–2061 [DOI] [PMC free article] [PubMed] [Google Scholar]
- 38. Lang DH, Sharkey NA, Lionikas A, et al. Adjusting data to body size: a comparison of methods as applied to quantitative trait loci analysis of musculoskeletal phenotypes. J Bone Miner Res. 2005;20:748–757 [DOI] [PMC free article] [PubMed] [Google Scholar]
- 39. Patsch JM, Burghardt AJ, Yap SP, et al. Increased cortical porosity in type 2 diabetic postmenopausal women with fragility fractures. J Bone Miner Res. 2013;28:313–324 [DOI] [PMC free article] [PubMed] [Google Scholar]
- 40. Burghardt AJ, Issever AS, Schwartz AV, et al. High-resolution peripheral quantitative computed tomographic imaging of cortical and trabecular bone microarchitecture in patients with type 2 diabetes mellitus. J Clin Endocrinol Metab. 2010;95:5045–5055 [DOI] [PMC free article] [PubMed] [Google Scholar]
- 41. Schwartz AV, Garnero P, Hillier TA, et al. Pentosidine and increased fracture risk in older adults with type 2 diabetes. J Clin Endocrinol Metab. 2009;94:2380–2386 [DOI] [PMC free article] [PubMed] [Google Scholar]
- 42. McCabe L, Zhang J, Raehtz S. Understanding the skeletal pathology of type 1 and 2 diabetes mellitus. Crit Rev Eukaryot Gene Expr. 2011;21:187–206 [DOI] [PubMed] [Google Scholar]
- 43. Patsch JM, Li X, Baum T, et al. Bone marrow fat composition as a novel imaging biomarker in postmenopausal women with prevalent fragility fractures. J Bone Miner Res. 2013;28(8):1721–1728 [DOI] [PMC free article] [PubMed] [Google Scholar]
- 44. Baum T, Yap SP, Karampinos DC, et al. Does vertebral bone marrow fat content correlate with abdominal adipose tissue, lumbar spine bone mineral density, and blood biomarkers in women with type 2 diabetes mellitus? J Magn Reson Imag. 2012;35:117–124 [DOI] [PMC free article] [PubMed] [Google Scholar]
- 45. Doniach D. Possible stimulation of thermogenesis in brown adipose tissue by thyroid-stimulating hormone. Lancet. 1975;2:160–161 [DOI] [PubMed] [Google Scholar]
- 46. DeMambro VE, Kawai M, Clemens TL, et al. A novel spontaneous mutation of Irs1 in mice results in hyperinsulinemia, reduced growth, low bone mass and impaired adipogenesis. J Endocrinol. 2010;204:241–253 [DOI] [PMC free article] [PubMed] [Google Scholar]
- 47. Botolin S, Faugere MC, Malluche H, Orth M, Meyer R, McCabe LR. Increased bone adiposity and peroxisomal proliferator-activated receptor-γ2 expression in type I diabetic mice. Endocrinology. 2005;146:3622–3631 [DOI] [PMC free article] [PubMed] [Google Scholar]
- 48. Luo XH, Guo LJ, Yuan LQ, et al. Adiponectin stimulates human osteoblasts proliferation and differentiation via the MAPK signaling pathway. Exp Cell Res. 2005;309:99–109 [DOI] [PubMed] [Google Scholar]
- 49. Luo XH, Guo LJ, Xie H, et al. Adiponectin stimulates RANKL and inhibits OPG expression in human osteoblasts through the MAPK signaling pathway. J Bone Miner Res.. 2006;21:1648–1656 [DOI] [PubMed] [Google Scholar]
- 50. Richards JB, Valdes AM, Burling K, Perks UC, Spector TD. Serum adiponectin and bone mineral density in women. J Clin Endocrinol Metab. 2007;92:1517–1523 [DOI] [PubMed] [Google Scholar]
- 51. Jurimae J, Jurimae T. Plasma adiponectin concentration in healthy pre- and postmenopausal women: relationship with body composition, bone mineral, and metabolic variables. Am J Physiol Endocrinol Metab. 2007;293:E42–E47 [DOI] [PubMed] [Google Scholar]
- 52. Won HY, Lee JA, Park ZS, et al. Prominent bone loss mediated by RANKL and IL-17 produced by CD4+ T cells in TallyHo/JngJ mice. PloS One. 2011;6:e18168. [DOI] [PMC free article] [PubMed] [Google Scholar]
- 53. Linder CC. The influence of genetic background on spontaneous and genetically engineered mouse models of complex diseases. Lab Anim. 2001;30:34–39 [PubMed] [Google Scholar]
- 54. Moyer-Mileur LJ, Slater H, Jordan KC, Murray MA. IGF-1 and IGF-binding proteins and bone mass, geometry, and strength: relation to metabolic control in adolescent girls with type 1 diabetes. J Bone Miner Res.. 2008;23:1884–1891 [DOI] [PMC free article] [PubMed] [Google Scholar]
- 55. Reyes-Garcia R, Rozas-Moreno P, Lopez-Gallardo G, et al. Serum levels of bone resorption markers are decreased in patients with type 2 diabetes. Acta Diabetol. 2013;50:47–52 [DOI] [PubMed] [Google Scholar]