

Abstract
Primary objective
This study examined long-term alterations in white matter microstructure following TBI in adolescence using diffusion tensor imaging (DTI). It was hypothesized that white matter integrity would be compromised in adolescents with TBI and would correlate with measures of executive functioning and cognitive abilities.
Research design
This study employed whole-brain, voxel-wise, statistical comparison of DTI indices in youth of 12–17 years old (mean = 15.06) with TBI vs an age- and gender-matched cohort (mean age = 15.37).
Methods and procedures
This study scanned 17 adolescents with complicated-mild-to-severe TBI, 1–3 years after injury, and 13 healthy adolescents. Tract-Based Spatial Statistics (TBSS) was employed for DTI analysis.
Main outcomes and results
Overall diffusivity elevations were found in the TBI group with increases in axial diffusivity in the right hemisphere. White matter integrity was associated with word reading, planning and processing times in the TBI group, but not healthy controls.
Conclusions
The detected abnormalities in axial diffusivity may reflect neuronal regeneration and cerebral reorganization after injury. These findings provide tentative evidence of persistent white matter alteration following TBI in adolescence. Associations of DTI indices with cognitive performance following TBI provide tentative support for links between white matter integrity and performance post-TBI.
Keywords: Traumatic brain injury, adolescents, executive functioning, diffusion tensor imaging, diffuse axonal injury
Introduction
Paediatric traumatic brain injury (TBI), a common cause of acquired disability in youth [1], occurs mostly in adolescence and young adulthood [2, 3]. While basic cognitive functions such as motor and sensory processing mature in childhood, adolescence is a crucial period for development of higher level processing [4]. Executive function (EF) processing deficits are common after childhood TBI [5–8] with many studies demonstrating deficits in measures of working memory, attention, inhibition and cognitive control linked to injury severity [9–11].
Although the neuropsychological and behavioural consequences of paediatric TBI have been well documented, the neural substrates of these cognitive and behavioural deficits are less well understood. The rotational and shearing forces associated with TBI often result in multi-focal and diffuse axonal injuries which are not evident on Computed Tomography (CT) scans [12] or conventional T1 or T2 weighted magnetic resonance (MR) imaging. Diffusion tensor imaging (DTI) is an advanced MRI imaging technique that quantifies microstructural changes in white matter based on the mapping of in-vivo patterns of water diffusion using scalar maps of fractional anisotropy (FA), mean diffusivity (MD), axial diffusivity (AD) and radial diffusivity (RD). Evidence from combined histological and DTI studies utilizing animal models of acute and subacute brain insult suggest that DTI variables can identify the primary axotomy and secondary demyelination arising from TBI [13–17]. Acutely, decreased FA was related to decreased white matter fibre directional coherence and decreased AD was associated with axon degeneration [13, 14, 16, 17]. In the sub-acute phase of TBI, AD returned to pseudo-baseline but increased RD was associated with secondary demyelination [14, 16, 17]. In the chronic phase of TBI, decreased FA and increased RD and MD have been consistently reported [18–21]. DTI variables have also been shown to be related to behavioural measures of executive functioning in chronic human TBI in both adult [20, 22] and paediatric [23–25] populations. In adult populations, relatively low FA [22] and high RD [20] in frontal white matter regions have been related to executive dysfunction. FA and MD values were predictive of executive and memory functioning in acute and chronic TBI [26]. Additionally, FA in the fornix has been associated with memory functioning [20, 27]. In paediatric populations, frontal white matter tract integrity was also associated with behaviour and planning [25], inhibition and switching [23], and prospective memory [24] performance. These works are part of a growing body of evidence showing that relationships between microstructural integrity of frontal white matter and EF performance can be mapped with DTI (see Zappalàet al. [28] for a review).
The objectives of this study were: (1) to characterize persistent deficits in white matter organization in adolescents between 1–3 years following complicated-mild-to-severe TBI using DTI and Tract-Based Spatial Statistics (TBSS) [29] and (2) to examine the relationship between white matter tract integrity and executive functioning skills. Previous reports with a similar cohort noted specific executive functioning deficits, despite otherwise normal cognitive performance [30]. It is hypothesized that the TBI group would exhibit lower levels of white matter organization and higher diffusivity compared to age-matched controls. It is also hypothesized that DTI measures in affected white matter tracts would correlate with measures of cognitive and executive function performance [20].
Patients and methods
Adolescents between the ages of 12–17 who had been hospitalized overnight with confirmed TBI were recruited. The injury classifications were defined by values of the Glasgow Coma Scale (GCS), where severe TBI was GCS <9, moderate TBI was GCS 9–12 and complicated-mild TBI was GCS 13–15, with evidence of abnormalities on imaging. The participants with TBI were recruited from a pool of families that had participated in ongoing research studies on adolescent TBI at a tertiary care children’s hospital. All participants were at least 12-months post-injury to ensure that acute recovery was complete. A comparison group of typically-developing adolescents with no history of TBI or other neurological insults was recruited from the community. Groups were matched on age, gender and maternal education. Exclusion criteria included significant developmental delay, significant psychiatric or behaviour disturbance prior to injury and extreme vision or hearing impairments.
Study neuropsychological data and MR imaging were acquired in the chronic phase (mean time since injury: 1.94 years, range: 1.1–3.5 years). After obtaining informed consent, participants completed neuropsychological testing followed by the study MRI session. The study was approved by the local Institutional Review Board.
Clinical and structural imaging evaluation
All patients had a clinical CT scan at the time of injury (initial presentation) performed in standard fashion using axial plane and 5 mm slice thickness. Patients with identified injury on initial CT had follow-up CT exams between 24 hours and 1 week after injury. Clinical MRI examinations were performed in selected patients at variable intervals after injury (2 days –13 months). All available imaging (clinically obtained and study obtained, see below) was reviewed by a board-certified radiologist with experience with paediatric traumatic brain injury (JL).
Neuropsychological measures
General cognitive ability was estimated using the Word Reading sub-test of the Wide Range Achievement Test, Fourth Edition (WRAT-4) and the Peabody Picture Vocabulary Test, Fourth Edition (PPVT-4), respectively. Executive functioning domains of working memory, processing speed, inhibition, planning, reasoning and impulsivity as well as behavioural manifestations of executive abilities were also evaluated. The Working Memory (WMI) and Processing Speed (PSI) Indices from the Wechsler Intelligence Scale for Children, Fourth Edition (WISC-IV) [31] were administered to assess domains of executive abilities known to be vulnerable to TBI [25]. The Colour-Word Interference Test from the Delis-Kaplan Executive Function System [32] was used to assess verbal inhibition. The Tower sub-test from the Delis–Kaplan Executive Function System (D-KEFS [32]) was used to test the flexibility of thinking, inhibition, problem-solving, planning, impulse control, concept formation, abstract thinking and creativity in the spatial modality. The Behaviour Rating Inventory of Executive Function (BRIEF) [33] and self-report (BRIEF-SR) [34] questionnaires provided ratings of behavioural manifestations of EF in everyday contexts.
Study MR imaging
MRI scans were obtained using a 3T (Philips Medical Systems, Cleveland, OH) scanner. The imaging session lasted 50 minutes and involved acquisition of a T1-weighted anatomical scan, a DTI scan and four fMRI scans (the fMRI results were reported elsewhere [30]). High-resolution T1-weighted anatomical images were acquired with a 3D MPRAGE compatible sequence with the following imaging parameters: TR 8.1 ms, TE 3.7 ms, flip angle: 8°, in-plane resolution: 0.98 × 0.98 mm2, slice thickness: 1 mm, matrix size: 252 × 250 (reconstructed to 256 × 256), 180 contiguous slices. Diffusion-weighted images were acquired with an EPI sequence with the following imaging parameters: TR 8799 ms, TE 88 ms, flip angle: 90°, slice thickness 2 mm, 72 contiguous slices. The geometry for data acquisition was slightly variable with Field-of-view ranging from 180 × 180 mm2 to 201.6 × 201.6 mm2 and in-plane resolution ranging from 1.73 × 1.73 mm2 to 1.96 × 1.96 mm2. A total of 33 volumes were acquired, consisting of one diffusion insensitive volume and 32 diffusion weighted volumes with gradients applied in non-collinear directions with a single b-value (b = 1000 s mm−2).
DTI analysis
TBSS was utilized for voxel-wise analysis of the DTI variables across the white matter. Voxel-based analysis requires accurate correspondence of voxels between subjects. By projecting the DTI values from the estimated local centres of major white matter onto a ‘skeleton’ that is used as the basis of voxel-wise analysis, TBSS attempts to overcome the requirement of accurate alignment and smoothing issues of conventional voxel-based analysis. The TBSS pipeline consists of multiple pre-processing steps that optimize the correspondence between voxels at the centre of major white matter tracts. First, eddy current correction was performed by affine registration of the diffusion images with a non-diffusion-weighted reference scan. At each brain voxel a tensor, a symmetric 3 × 3 matrix of apparent diffusion coefficients along the Cartesian axes, was computed using standard linear least squares estimation [35] to model the directionality of water movement. Eigen decomposition of the tensor yields the eigenvalues λ1 > λ2 > λ3, which are used tocompute scalar maps of (AD = λ1), (MD = (λ1+λ2+λ3)/3),
and (RD = (λ2+λ3)/2) [36]. Voxel-wise registration is performed by exhaustive pairwise non-linear registration, using FNIRT [37, 38], of FA images to select the ‘most typical’ subject’s FA image as the registration target [29]. We chose a study-specific template in order to minimize the amount of nonlinear distortion applied to the images. Additionally, using a real FA image as opposed to a blurred version of multiple subjects should preserve the sharpness of edges. The images were then linearly aligned to MNI152 space. Skeletonization of the major white matter tracts was performed by thinning the mean FA image, which was thresholded at FA > 0.2 in order to remove highly variable white matter tracts. Residual misregistration of the tract centres in the FA images with the skeleton was corrected by projecting maximal FA values onto the skeleton; the projected values were used for voxel-wise statistical comparison.
Non-parametric voxel-wise statistical comparisons were performed using permutation testing implemented by the ‘Randomize’ tool [39]; 5000 permutations were generated, leading to confidence limits on p = 0.05 of ±0.0062. After Family-Wise Error (FWE) correction for multiple comparisons and application of the Threshold-Free Cluster Enhancement (TFCE) method [40], voxels were considered statistically significant if p <0.05. The localization of significant voxels to white matter regions and tracts was performed by referencing the John Hopkins University (JHU) and International Consortium of Brain Mapping (ICBM) atlases [41], respectively. Cortical regions in close proximity to significant voxels in white matter were identified using a Montreal Neurological Institute (MNI) space Talairach atlas [42].
Multivariate linear regression using permutation testing with the ‘Randomize’ tool [39] was used to examine the relationships between DTI variables and the neuropsychological variables (as listed in Table I) within the TBI group, the control group and across both groups. Participant age at the time of the MRI scan was included in the linear models as a covariate to control for known variations of DTI parameters with age at scan [43, 44].
Table I.
Neuropsychological performance by group.
| Measure | Direction of score | TBI (n =17) | CTL (n = 13) | t | p (unc.) | Cohen’s d |
|---|---|---|---|---|---|---|
| PPVT-4 | ↑ | 101.29 (13.47) | 105.15 (7.97) | −0.92 | 0.37 | 0.35 |
| WRAT-4 | ↑ | 102.41 (16.73) | 113.31 (17.46) | −1.74 | 0.09 | 0.66 |
| DKEFS-Tower | ↑ | 10.24 (2.25) | 9.54 (2.79) | 0.76 | 0.45 | 0.29 |
| DKEFS-ISvCb | ↑ | 9.94 (2.14) | 9.54 (1.13) | 0.62 | 0.54 | 0.23 |
| WISC-IV WMI | ↑ | 99.19 (8.84) | 103.00 (14.09) | −0.89 | 0.38 | 0.35 |
| WISC-IV PSI | ↑ | 104.00 (15.62) | 107.31 (15.52) | −0.57 | 0.57 | 0.22 |
| BRIEF-SR GEC | ↓ | 51.71 (11.37) | 50.69 (11.21) | 0.24 | 0.81 | 0.09 |
| BRIEF GEC | ↓ | 55.24 (15.16) | 43.23 (8.08) | 2.58 | 0.02* | 0.98 |
In the ‘Direction of score’ column, ↑ denotes that a higher score means better performance, ↓ denotes that a lower score means better performance.
TBI, Traumatic Brain Injury group; CTL, Control group; PPVT, Peabody Picture Vocabulary Test Version 4; WRAT, Wide Range Achievement Test 4th Edition word reading sub-test; DKEFS, Delis-Kaplan Executive Function System; Tower, Tower Total Achievement Score; ISvCb, Interference/Switching minus colour baseline; WISC, Wechsler Intelligence Scale for Children 4th Edition; PSI, Processing Speed Index; WMI, Working Memory Index; BRIEF, Behaviour Rating Inventory of Executive Function; GEC, Global Executive Composite; SR, Self-Report.
Results
Seventeen adolescents with TBI (mean age at scan = 15.06, range = 12–17) and 13 controls (CTL) (mean age at scan = 15.37, range 13–17) consented and produced usable imaging data. The groups did not differ significantly on ages at scan (t = −0.54, p = 0.59) or gender (χ2 = 0.002, p = 0.96). Age at scan, GCS scores, mechanisms of injury and image findings for the TBI group are displayed in Table II.
Table II.
Clinical characteristics and imaging findings for the TBI group.
| Age (years)
|
||||||
|---|---|---|---|---|---|---|
| ID | GCS | At injury | When imaged | Classification | Mechanism of injury | Imaging findings |
| 1 | 15 | 14.08 | 16.50 | CM | Sport | Small R EDH haematoma, Normal brain |
| 2 | 13 | 12.11 | 15.59 | CM | Fall | Small L SDH, Normal brain |
| 3 | 11 | 11.01 | 13.83 | M | Fall | Normal |
| 4 | 11 | 14.17 | 16.08 | M | MVC | Normal |
| 5 | 15 | 14.92 | 17.00 | CM | Fall | Normal |
| 6 | 15 | 14.00 | 16.00 | CM | Fall | Bilateral anterior temporal contusions, R > L. Bilateral frontal contusions, R > L (inferior and orbital frontal) |
| 7 | 11 | 12.50 | 14.25 | M | Fall | L inferior frontal and right anterior temporal haemorrhagic contusions |
| 8 | 8 | 16.33 | 17.59 | M | MVC | Small R SDH, Normal brain |
| 9 | 14 | 14.92 | 16.08 | CM | Sport | R frontal haemorrhagic contusion, R > L superior frontal lobe, R temporal and R splenium haemorrhagic shear injuries |
| 10 | 15 | 14.02 | 16.17 | CM | MVC | Bilateral frontal, R > L haemorrhagic shear injury |
| 11 | 15 | 14.02 | 16.08 | CM | Fall | Small L EDH, Normal brain |
| 12 | 13 | 12.05 | 14.33 | CM | Fall | Bilateral temporal, L > R, and R frontal haemorrhagic contusions |
| 13 | 10 | 13.10 | 14.83 | M | Fall | Small R temporal contusion |
| 14 | 3 | 12.02 | 13.59 | S | Sport | Normal |
| 15 | 15 | 10.90 | 12.00 | CM | Fall | Small L SDH. Bilateral L > R inferior frontal contusions and temporal contusions |
| 16 | 15 | 12.02 | 13.30 | CM | Sport | R posterior temporal haemorrhagic contusion |
| 17 | 13 | 11.06 | 12.90 | CM | Ped vs MVA | Subarachnoid haemorrhage. Normal brain |
MVC, motor vehicle collision; MVA, motor vehicle accident; SDH, subdural haematoma; EDH, epidural haematoma. All subjects had CT and research T1-weighted MPRAGE MRI sequences. Subjects 2, 6, 9, 10, 12, 13 and 15 had clinical MRI examinations. CM, Complicated-mild; M, moderate; S, severe.
The TBI and CTL groups did not differ on measures of general intellectual ability, although there was a trend for poorer performance for word reading (WRAT-4) in the TBI group (see Table I). Adolescents with TBI had significantly higher behavioural ratings of executive dysfunction [BRIEF-GEC (p = 0.02, uncorrected)].
Group differences in DTI variables
Group comparison of the DTI variables (TBI vs CTL) identified several regions of elevated AD in the TBI group (TBI > CTL; p < 0.05, corrected) across the white matter on the TBSS skeleton (Figure 1). All clusters were lateralized to the right hemisphere. Regions of affected white matter tracts include the right anterior corona radiata (rACR), genu of the corpus callosum (gCC), body of the corpus callosum (bCC), right superior corona radiata (rSCR), right posterior limb of the internal capsule (rPLIC), right cerebral peduncle (rCP) and white matter in close proximity to the medial frontal gyrus and precuneus in the right hemisphere. Further, trend-level differences in AD (TBI > CTL, p < 0.1 corrected) were also apparent in white matter in the left hemisphere, including portions of the bCC and lPCR. No group differences were identified in FA, MD or RD at corrected level.
Figure 1.
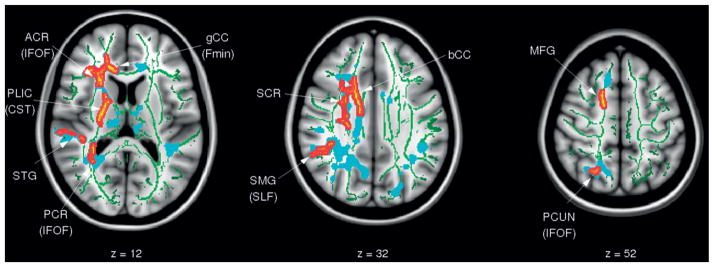
Results of TBSS analysis comparing axial diffusivity (AD) between adolescents with TBI (TBI) and an age-gender matched control group (CTL)., Voxels with significant differences (TBI > CTL) are shown in red/yellow (p < 0.05 corrected) and blue (p <0.1 corrected); the significant regions were ‘‘thickened’’ to enhance visualization. The results are overlaid onto the MNI152 T1 template and the white matter tract skeleton is shown in green.
Using the voxels identified as having abnormally high AD in the TBSS analysis, mean values for AD, MD, RD and FA were extracted for each participant. Figure 2 depicts the group-wise mean values for all DTI variables and shows a statistically significant increase in AD (as expected) and MD in the TBI group with non-significant differences for RD and FA. It should be noted that the p-value for FA (TBI > CTL) was significant prior to correction.
Figure 2.

Comparison of the DTI variables (i) AD, (ii) MD, (iii) RD, and (iv) FA between TBI and CTL groups using subject-wise mean values across all voxels in the significant cluster for AD (TBI >CTL) (see Figure 1) Group-wise mean values are denoted by horizontal lines. Significant differences between groups after correction for multiple comparisons are denoted by *(p < 0.05), **(p < 0.01). Note that AD (TBI > CTL) (i) is bound to be significant given that the ROI was chosen from voxels of significantly increased AD in the TBI group as determined by TBSS.
To more fully understand the genesis of the right lateralized findings, this study examined the pattern of white and gray matter injuries found in the imaging review (Table II). Of the eight participants that had identifiable parenchymal damage, each had at least one site of damage in the right hemisphere at either the sub-acute or late stage of TBI.
Associations of DTI abnormalities with cognitive ability and executive functioning
To investigate associations between white matter microstructure and neuropsychological performance, this study performed linear regression of the DTI variables with the neuropsychological variables (see Table I) across the skeleton and found no significant relationships between any pairs of variables. To assess the potential association with a less stringent level of correction for multiple comparisons, the data were re-analysed using the regions of the skeleton that contained significantly higher AD in the TBI group (see Figure 1). Figure 3(a) shows a significant correlation between FA and word reading score (WRAT-4) in the gCC/ rACR (558 voxels). Figure 3(b) reveals significant negative correlations of RD with the DKEFS Tower Total Achievement score (DKEFS-TOW-TAS) in the right SCR (42 voxels). Figure 3(c) shows a cluster with trend-level significance (150 voxels) that indicates a positive correlation between AD and WISC-IV PSI in the rACR. All of these associations were found only in the TBI group, but not in the CTL or combined group.
Figure 3.

Results of the TBSS regression analysis of FA with the WRAT-4 word reading subtest (p < 0.05, corrected) (i), RD with the DKEFS Tower Total Achievement Score (p < 0.05, corrected) (ii), and AD with the WISC-IV PSI score (p < 0.1, corrected) (iii) in the TBI group (positive correlation: red, negative correlation: blue). The significantly correlated regions were ‘‘thickened’’ to enhance visualization. The results are overlaid onto the MNI152 T1 template and the white matter tract skeleton is shown in green. The p-values are thresholded at p < 0.05 corrected over voxels that were reported as significant for AD (TBI > CTL) (see Figure 1).
The other neuropsychological variables (PPVT-4, WISC-IV WMI, DKEFS-Colour word, BRIEF GEC, BRIEF-SR GEC) were not correlated to the DTI variables in the TBI, CTL or across both groups.
Discussion
This study used non-invasive neuroimaging techniques to investigate the magnitude of persistent white matter microstructure abnormalities in an adolescent cohort with TBI and to relate DTI measures of white matter microstructure organization to performance on measures of cognitive ability and executive functioning.
Consistent with the hypothesis, regions of elevated white matter diffusivity were found in adolescents with TBI more than 12 months after the initial injury. The finding of increased MD in the TBI group is suggestive of demyelination and axonal death that occurs with TBI [45]. The increase of AD for adolescents with chronic TBI agrees with cross-sectional studies of chronic injury that reported increased AD in patients compared to controls [20, 22]. However, longitudinal studies showed that recovery of AD only reached control levels after an initial decrease in the acute phase [46]. Expected decreases in FA and increases in RD compared to healthy controls were also observed but did not reach statistical significance in the present study. The weaker significance of these differences is perhaps not surprising given that the cohort sustained mostly mild injuries, whereas recent evidence suggests that significant decreases in FA may only be found following moderate-to-severe TBI [18].
Contrary to expectations, regions of increased AD following TBI found in the present study were predominantly evident in the right hemisphere. Most previous TBI studies have identified bilateral white matter damage [20, 22], although some studies of adult TBI have detected certain level of laterality [18, 47, 48]. One possible explanation for the current finding is the prevalence of shear injuries or contusions in the right hemisphere on initial scans (see Table II). This heterogeneous pattern of lateralized lesions, along with the potential influence of small sample size, may have contributed to the right lateralization of the TBSS findings. It should be noted that the clusters with significantly higher AD in TBI were located in deep white matter, while the lesions tended to be isolated in superficial white matter in closer proximity to the cerebral cortex. Thus, DTI may be sensitive to white matter microstructure abnormalities that are remote from the site of injury and resulting lesions identified by CT.
Statistically significant increases were observed in AD and MD in the TBI group and with no statistically significant increases of FA or RD. For a possible interpretation of the biological basis of these findings, this study turns to the literature on animal studies using DTI. Animal studies suggest that increased AD may reflect neuroplasticity mechanisms including peri-lesional cortical reorganization, dendritic or axonal sprouting and neurosynaptogenesis [49–51]. These neuroplasticity factors, particularly axonal sprouting, may explain the increased levels of AD following TBI compared to controls found here. An alternate explanation of the increased AD and MD is gliosis without neuronal regeneration. A study examining the recovery of peri-lesional tissue after stroke revealed proliferation of astrocytes (gliosis), in the cortex as well as in white matter, with no evidence of axonal regeneration [15]. Directionally coherent glial cells cause increases in FA (increased AD compared to RD) [13]. Although the mechanism of stroke is different to TBI and this was not a human study, the stroke model does demonstrate the brain recovery pathway from insult. The lack of axonal regeneration could explain the increase in MD and RD, while the gliosis may be the cause of the profound increase in AD, with the lack of axons contributing to the increased MD values. Alternatively, the simultaneous increases of AD and MD values may be caused by the preferential death of fibre populations orthogonal to the primary diffusion directions within voxels. It should be noted that the tensor model sometimes is insufficient to model crossing fibre populations presented in the majority of the white matter [52]. Further DTI-based TBI studies and investigation of crossing fibres using a non-tensor based model, e.g. Q-ball or HARDI, may be required to ascertain whether axonal regrowth or death is more plausible. In conclusion, the complex relationships between the DTI variables, neuropathology precludes one from making categorical statements about the underlying biological causes of the results. However, the fact that DTI is able to detect significant differences even in children with mild TBI that does not produce poor academic and neurocognitive outcomes, despite conservative corrections, is evidence for the high sensitivity of the method.
The second objective was to examine the potential relationships between DTI variables and measures of cognitive functioning and EF. Due to the severe FWE correction applied across the whole skeleton and the small sample size, no significant associations were found between measures of cognitive functioning and EF and white matter integrity across the sample as a whole. In order to alleviate the severity of the multiple comparison correction, this study re-analysed the neuropsychological variables in the regions of elevated AD in the TBI group. Significant correlations were found between abnormal DTI indices and poor performance on several neuropsychological measures using this regionally specific analysis strategy. A positive correlation between FA and word-reading score (WRAT-4), where higher score means better performance, was found in the rACR and gCC. In general, word reading is not typically adversely affected by TBI and for this reason it is considered a ‘hold skill’ that may provide a possible measure of pre-injury functioning or cognitive reserve. As language skills, including reading, are primarily sub-served by the left hemisphere, it is likely that the correlations in the right hemisphere are driven mainly by the site of injury. As such, it is likely that the association between FA and word reading could be more diffuse and left-sided with a larger and more representative sample of adolescents with TBI.
Consistent with this hypothesis, lower RD was associated with higher DKEFS-TOW-TAS, which assesses problem-solving and planning, where a higher score means a better performance, across all subjects in the rSCR. Although a relationship was not seen with FA, as per the literature, a decrease in RD is indicative of increased myelination [17] and is often coupled with increased FA, which could have explained the relationship between white matter microstructure and performance on this task.
A positive correlation of AD with WISC-IV PSI was observed in the TBI group at trend-level significance. Processing speed has been shown to be impaired in TBI [25]. In this study, the cluster is located in the rCing, which contains projections to the frontal cortex. This finding may demonstrate the influence white matter microstructure has on performance, specifically in TBI patients, despite normal neuropsychological performance and mild injuries. However, given that the finding was not significant with correction, it must be interpreted with caution; recognizing the potential for a false positive finding.
Associations between the integrity of white matter microstructure based on DTI and neuropsychological functioning reported here should be treated with caution given the sample size and methodological limitations of the study. Despite these limitations on specific interpretations of the relationship of neuro-cognitive outcome measures to the DTI data, this study demonstrates the sensitivity of DTI as a non-invasive imaging tool in detecting subtle residual WM abnormalities in chronic stage TBI in adolescents. The results presented in this study are preliminary and yet promising and add new value to the field. If such findings can be substantiated by a larger comprehensive study, then the DTI parameters examined here might collectively serve as an imaging biomarker to be translated into a clinical method for assessing WM damage from TBI. The tool could help clinicians for determining critical timing of intervention and for predicting outcome related to WM recovery at various stages of patient management.
Conclusion
This study augments the existing literature of DTI study of TBI by reporting abnormal white matter microstructure determined by DTI matrices as well as their association with cognitive functioning in a cohort of adolescents who sustained mostly complicated mild or moderate TBI. Consistent with the hypotheses, elevated diffusivity was observed in a series of WM regions in the TBI group. This study also presented evidence for the association between the elevated AD and the processing speed and executive function in the TBI group providing a snapshot of white matter tract recovery and its relationship with neuropsychological variables in chronic TBI.
Abbreviations White matter region abbreviations
- ACR
anterior corona radiate
- ALIC
anterior limb of the internal capsule
- CP
cerebral peduncle
- Cing
Cingulum
- ExCAP
external capsule
- gCC
bCC, sCC, genu, body, splenium of the corpus callosum
- PCR
right posterior corona radiate
- PLIC
posterior limb of the internal capsule
- PTR
posterior thalamic radiation
- RetroIC
retrolenticular part of the internal capsule
- SCR
superior corona radiata
- SS
sagittal stratum
- TAP
tapetum. These regions in the left and right hemispheres were denoted using l or r prefixes, respectively. e.g
- lPLIC
left posterior limb of the internal capsule
White matter tract abbreviations
- ATR
anterior thalamic radiation
- CST
cortico-spinal tract
- Fmin
forceps minor
- IFOF
inferior fronto-occipital fasciculus
- SLF
superior longitudinal fasciculus
- UF
uncinate fasciculus. These tracts in the left and right hemispheres were denoted using l or r prefixes e.g
- lSLF
left superior longitudinal fasciculus
Magnetic Resonance Imaging abbreviations
- EPI
Echo Planar Imaging
- FSE
Fast Spin Echo
- GRE
Gradient Echo
- MPRAGE
Magnetization Prepared Rapid Gradient Echo
- TE
echo time
- TI
inversion time
- TR, repetition time. Neuropsychological tests
PPVT, Peabody Picture Vocabulary Test Version 4
- WRAT
Wide Range Achievement Test 4th Edition word reading sub-test
- DKEFS
Delis-Kaplan Executive Function System
- Tower
Tower Total Achievement Score
- ISvCb
Interference/Switching minus colour baseline
- WISC
Wechsler Intelligence Scale for Children 4th Edition
- PSI
Processing Speed Index
- WMI
Working Memory Index
- BRIEF
Behaviour Rating Inventory of Executive Function
- GEC
Global Executive Composite
- SR
Self-Report
Other abbreviations
- CT
Computed Tomography
- FEW
Family-Wise Error
- GCS
Glasgow Coma Score
- ICBM
International Consortium of Brain Mapping
- JHU
John Hopkins University
- MNI
Montreal Neurological Institute
- TBSS
Tract-Based Spatial Statistics
- TFCE
Threshold-Free Cluster Enhancement
Footnotes
Declaration of Interest: The authors report no conflicts of interest. The authors alone are responsible for the content and writing of the paper.
References
- 1.Keenan HT, Bratton SL. Epidemiology and outcomes of pediatric traumatic brain injury. Developmental Neuroscience. 2006;26:256–263. doi: 10.1159/000094152. [DOI] [PubMed] [Google Scholar]
- 2.Access Economics. The economic cost of spinal cord injury and traumatic brain injury in Australia. [accessed 1 May 2011];The Victorian Neurotrauma Initiative. 2009 Available online at: http://www.accesseconomics.com.au/publicationsreports/getreport.php?report=209&id=301.
- 3.Langlois JA, Rutland-Brown W, Thomas KE. TBI in the US: emergency department visits, hospitalizations, and deaths. Centers for Disease Control and Prevention; Atlanta, GA: National Center for Injury Prevention and Control (NCIPC); 2006. [accessed 1 June 2011]. Available online at: < http://www.cdc.gov/ncipc/pub-res/TBI_in_US_04/TBI%20in%20the%20US_Jan_2006.pdf>. [Google Scholar]
- 4.Casey BJ, Tottenham N, Liston C, Durston S. Imaging the developing brain: What have we learned about cognitive development? Trends in Cognitive Sciences. 2005;9:104–110. doi: 10.1016/j.tics.2005.01.011. [DOI] [PubMed] [Google Scholar]
- 5.Gioia GA, Isquith PK. Ecological assessment of executive function in traumatic brain injury. Developmental Neuropsychology. 2004;25:135–158. doi: 10.1080/87565641.2004.9651925. [DOI] [PubMed] [Google Scholar]
- 6.Mangeot S, Armstrong K, Colvin AN, Yeates KO, Taylor HG. Long-term executive function deficits in children with traumatic brain injuries: Assessment using the Behavior Rating Inventory of Executive Function (BRIEF) Child Neuropsychology: A Journal on Normal and Abnormal Development in Childhood and Adolescence. 2002;8:271–284. doi: 10.1076/chin.8.4.271.13503. [DOI] [PubMed] [Google Scholar]
- 7.Max JE, Levin HS, Landis J, Schachar R, Saunders A, Ewing-Cobbs L, Chapman SB, Dennis M. Predictors of personality change due to traumatic brain injury in children and adolescents in the first six months after injury. Journal of the American Academy of Child & Adolescent Psychiatry. 2005;44:434–442. doi: 10.1097/01.chi.0000156280.66240.61. [DOI] [PubMed] [Google Scholar]
- 8.Max JE, Schachar RJ, Levin HS, Ewing-Cobbs L, Chapman SB, Dennis M, Saunders A, Landis J. Predictors of attention-deficit/hyperactivity disorder within 6 months after pediatric traumatic brain injury. Journal of the American Academy of Child & Adolescent Psychiatry. 2005;44:1032–1040. doi: 10.1097/01.chi.0000173293.05817.b1. [DOI] [PubMed] [Google Scholar]
- 9.Anderson V, Catroppa C, Morse S, Haritou F, Rosenfeld J. Attentional and processing skills following traumatic brain injury in early childhood. Brain Injury. 2005;19:699–710. doi: 10.1080/02699050400025281. [DOI] [PubMed] [Google Scholar]
- 10.Anderson V, Fenwick T, Manly T, Robertson I. Attentional skills following traumatic brain injury in childhood: A componential analysis. Brain Injury. 1998;12:937–949. doi: 10.1080/026990598121990. [DOI] [PubMed] [Google Scholar]
- 11.Yeates KO, Armstrong K, Janusz J, Taylor HG, Wade S, Stancin T, Drotar D. Long-term attention problems in children with traumatic brain injury. Journal of the American Academy of Child and Adolescent Psychiatry. 2005;44:574–584. doi: 10.1097/01.chi.0000159947.50523.64. [DOI] [PubMed] [Google Scholar]
- 12.Gennarelli TA, Thibault LE, Graham DI. Diffuse axonal injury: An important form of traumatic brain damage. The Neuroscientist. 1998;4:202–215. [Google Scholar]
- 13.Budde MD, Janes L, Gold E, Turtzo LC, Frank JA. The contribution of gliosis to diffusion tensor anisotropy and tractography following traumatic brain injury: Validation in the rat using Fourier analysis of stained tissue sections. Brain. 2011;134:2248–2260. doi: 10.1093/brain/awr161. [DOI] [PMC free article] [PubMed] [Google Scholar]
- 14.Li J, Li XY, Feng DF, Gu L. Quantitative evaluation of microscopic injury with diffusion tensor imaging in a rat model of diffuse axonal injury. European Journal of Neuroscience. 2011;33:933–945. doi: 10.1111/j.1460-9568.2010.07573.x. [DOI] [PubMed] [Google Scholar]
- 15.Li Y, Chen J, Zhang CL, Wang L, Lu D, Katakowski M, Gao Q, Shen LH, Zhang J, Lu M, et al. Gliosis and brain remodeling after treatment of stroke in rats with marrow stromal cells. Glia. 2005;49:407–417. doi: 10.1002/glia.20126. [DOI] [PubMed] [Google Scholar]
- 16.Mac Donald CL, Dikranian K, Song SK, Bayly PV, Holtzman DM, Brody DL. Detection of traumatic axonal injury with diffusion tensor imaging in a mouse model of traumatic brain injury. Experimental neurology. 2007;205:116–131. doi: 10.1016/j.expneurol.2007.01.035. [DOI] [PMC free article] [PubMed] [Google Scholar]
- 17.Song S-K, Sun S-W, Ju W-K, Lin S-J, Cross AH, Neufeld AH. Diffusion tensor imaging detects and differentiates axon and myelin degeneration in mouse optic nerve after retinal ischemia. NeuroImage. 2003;20:1714–1722. doi: 10.1016/j.neuroimage.2003.07.005. [DOI] [PubMed] [Google Scholar]
- 18.Cubon VA, Putukian M, Boyer C, Dettwiler A. A diffusion tensor imaging study on the white matter skeleton in individuals with sports-related concussion. Journal of Neurotrauma. 2011;28:189–201. doi: 10.1089/neu.2010.1430. [DOI] [PMC free article] [PubMed] [Google Scholar]
- 19.Inglese M, Makani S, Johnson G, Cohen BA, Silver JA, Gonen O, Grossman RI. Diffuse axonal injury in mild traumatic brain injury: A diffusion tensor imaging study. Journal of Neurosurgery. 2005;103:298–303. doi: 10.3171/jns.2005.103.2.0298. [DOI] [PubMed] [Google Scholar]
- 20.Kinnunen KM, Greenwood R, Powell JH, Leech R, Hawkins PC, Bonnelle V, Patel MC, Counsell SJ, Sharp DJ. White matter damage and cognitive impairment after traumatic brain injury. Brain. 2011;134:449–463. doi: 10.1093/brain/awq347. [DOI] [PMC free article] [PubMed] [Google Scholar]
- 21.Levin HS, Wilde EA, Chu Z, Yallampalli R, Hanten GR, Li X, Chia J, Vasquez AC, Hunter JV. Diffusion tensor imaging in relation to cognitive and functional outcome of traumatic brain injury in children. The Journal of Head Trauma Rehabilitation. 2008;23:197–208. doi: 10.1097/01.HTR.0000327252.54128.7c. [DOI] [PMC free article] [PubMed] [Google Scholar]
- 22.Kraus MF, Susmaras T, Caughlin BP, Walker CJ, Sweeney JA, Little DM. White matter integrity and cognition in chronic traumatic brain injury: A diffusion tensor imaging study. Brain: A Journal of Neurology. 2007;130:2508–2519. doi: 10.1093/brain/awm216. [DOI] [PubMed] [Google Scholar]
- 23.Kurowski B, Wade SL, Cecil KM, Walz NC, Yuan W, Rajagopal A, Holland SK. Correlation of diffusion tensor imaging with executive function measures after early childhood traumatic brain injury. Journal of Pediatric Rehabilitation Medicine. 2009;2:273–283. doi: 10.3233/PRM-2009-0093. [DOI] [PMC free article] [PubMed] [Google Scholar]
- 24.McCauley SR, Wilde EA, Bigler ED, Chu Z, Yallampalli R, Oni MB, Wu TC, Ramos MA, Pedroza C, Vásquez AC, et al. Diffusion tensor imaging of incentive effects in prospective memory after pediatric traumatic brain injury. Journal of Neurotrauma. 2011;28:503–516. doi: 10.1089/neu.2010.1555. [DOI] [PMC free article] [PubMed] [Google Scholar]
- 25.Wozniak JR, Krach L, Ward E, Mueller BA, Muetzel R, Schnoebelen S, Kiragu A, Lim KO. Neurocognitive and neuroimaging correlates of pediatric traumatic brain injury: A diffusion tensor imaging (DTI) study. Archives of Clinical Neuropsychology: The Official Journal of the National Academy of Neuropsychologists. 2007;22:555–568. doi: 10.1016/j.acn.2007.03.004. [DOI] [PMC free article] [PubMed] [Google Scholar]
- 26.Wang JY, Bakhadirov K, Abdi H, Devous MD, Marquez de la Plata CD, Moore C, Madden CJ, Diaz-Arrastia R. Longitudinal changes of structural connectivity in traumatic axonal injury. Neurology. 2011;77:818–826. doi: 10.1212/WNL.0b013e31822c61d7. [DOI] [PMC free article] [PubMed] [Google Scholar]
- 27.Palacios EM, Fernandez-Espejo D, Junque C, Sanchez-Carrion R, Roig T, Tormos JM, Bargallo N, Vendrell P. Diffusion tensor imaging differences relate to memory deficits in diffuse traumatic brain injury. BMC Neurology. 2011;11:24–34. doi: 10.1186/1471-2377-11-24. [DOI] [PMC free article] [PubMed] [Google Scholar]
- 28.Zappalà G, Thiebaut de Schotten M, Eslinger PJ. Traumatic brain injury and the frontal lobes: What can we gain with diffusion tensor imaging? Cortex. 2011;48(2):156–165. doi: 10.1016/j.cortex.2011.06.020. [DOI] [PubMed] [Google Scholar]
- 29.Smith SM, Jenkinson M, Johansen-Berg H, Rueckert D, Nichols TE, Mackay CE, Watkins KE, Ciccarelli O, Cader MZ, Matthews PM, et al. Tract-based spatial statistics: Voxelwise analysis of multi-subject diffusion data. NeuroImage. 2006;31:1487–1505. doi: 10.1016/j.neuroimage.2006.02.024. [DOI] [PubMed] [Google Scholar]
- 30.Tlustos SJ, Chiu CYP, Walz NC, Holland SK, Bernard L, Wade SL. Neural correlates of interference control in adolescents with traumatic brain injury: Functional magnetic resonance imaging study of the counting stroop task. Journal of the International Neuropsychological Society. 2011;17:181–189. doi: 10.1017/S1355617710001414. [DOI] [PMC free article] [PubMed] [Google Scholar]
- 31.Wechsler D. Wechsler Intelligence Test for Children (WISC-IV) San Antonio, TX: Psychological Corporation; 2004. [Google Scholar]
- 32.Delis DC, Kaplan E, Kramer JH. Delis Kaplan Executive Function System (D-KEFS) San Antonio, TX: Psychological Corporation; 2001. [Google Scholar]
- 33.Gioia GA, Isquith PK, Guy SC, Kenworthy L. Behavior Rating Inventory of Executive Function. Child Neuropsychology (Neuropsychology, Development and Cognition: Section C) 2000;6:235–238. doi: 10.1076/chin.6.3.235.3152. [DOI] [PubMed] [Google Scholar]
- 34.Guy SC, Isquith PK, Gioia GA. BRIEF-SR: Behavior Rating Inventory Of Executive Function - Self-Report version. Lutz, FL: Psychological Assessment Resources; 2004. [Google Scholar]
- 35.Behrens TEJ, Woolrich MW, Jenkinson M, Johansen-Berg H, Nunes RG, Clare S, Matthews PM, Brady JM, Smith SM. Characterization and propagation of uncertainty in diffusion-weighted MR imaging. Magnetic Resonance in Medicine: Official Journal of the Society of Magnetic Resonance in Medicine/Society of Magnetic Resonance in Medicine. 2003;50:1077–1088. doi: 10.1002/mrm.10609. [DOI] [PubMed] [Google Scholar]
- 36.Basser PJ, Pierpaoli C. Microstructural and physiological features of tissues elucidated by quantitative-diffusion-tensor MRI. Journal of Magnetic Resonance Series B. 1996;111:209–219. doi: 10.1006/jmrb.1996.0086. [DOI] [PubMed] [Google Scholar]
- 37.Andersson JLR, Jenkinson M, Smith S. Non-linear optimisation. Oxford, United Kingdom: FMRIB; 2007. [Google Scholar]
- 38.Andersson JLR, Jenkinson M, Smith S. Non-linear registration, aka Spatial normalisation. Oxford, United Kingdom: FMRIB; 2007. Report nr TR07JA2. [Google Scholar]
- 39.Nichols TE, Holmes AP. Nonparametric permutation tests for functional neuroimaging: A primer with examples. Human Brain Mapping. 2002;15:1–25. doi: 10.1002/hbm.1058. [DOI] [PMC free article] [PubMed] [Google Scholar]
- 40.Smith SM, Nichols TE. Threshold-free cluster enhancement: Addressing problems of smoothing, threshold dependence and localisation in cluster inference. NeuroImage. 2009;44:83–98. doi: 10.1016/j.neuroimage.2008.03.061. [DOI] [PubMed] [Google Scholar]
- 41.Mori S, Oishi K, Jiang H, Jiang L, Li X, Akhter K, Hua K, Faria AV, Mahmood A, Woods R, et al. Stereotaxic white matter atlas based on diffusion tensor imaging in an ICBM template. NeuroImage. 2008;40:570–582. doi: 10.1016/j.neuroimage.2007.12.035. [DOI] [PMC free article] [PubMed] [Google Scholar]
- 42.Lancaster JL, Woldorff MG, Parsons LM, Liotti M, Freitas CS, Rainey L, Kochunov PV, Nickerson D, Mikiten SA, Fox PT. Automated Talairach atlas labels for functional brain mapping. Human Brain Mapping. 2000;10:120–131. doi: 10.1002/1097-0193(200007)10:3<120::AID-HBM30>3.0.CO;2-8. [DOI] [PMC free article] [PubMed] [Google Scholar]
- 43.Schmithorst VJ, Holland SK, Dardzinski BJ. Developmental differences in white matter architecture between boys and girls. Human Brain Mapping. 2008;29:696–710. doi: 10.1002/hbm.20431. [DOI] [PMC free article] [PubMed] [Google Scholar]
- 44.Westlye LT, Walhovd KB, Dale AM, Bjørnerud A, Due-Tønnessen P, Engvig A, Grydeland H, Tamnes CK, Østby Y, Fjell AM. Life-span changes of the human brain white matter: Diffusion Tensor Imaging (DTI) and volumetry. Cerebral Cortex. 2010;20:2055–2068. doi: 10.1093/cercor/bhp280. [DOI] [PubMed] [Google Scholar]
- 45.Smith DH, Meaney DF. Axonal damage in traumatic brain injury. The Neuroscientist. 2000;6:483–495. [Google Scholar]
- 46.Sidaros A, Engberg AW, Sidaros K, Liptrot MG, Herning M, Petersen P, Paulson OB, Jernigan TL, Rostrup E. Diffusion tensor imaging during recovery from severe traumatic brain injury and relation to clinical outcome: A longitudinal study. Brain. 2008;131:559–572. doi: 10.1093/brain/awm294. [DOI] [PubMed] [Google Scholar]
- 47.Rutgers DR, Toulgoat F, Cazejust J, Fillard P, Lasjaunias P, Ducreux D. White matter abnormalities in mild traumatic brain injury: A Diffusion Tensor Imaging Study. AJNR Am J Neuroradiol. 2008;29(3):514–519. doi: 10.3174/ajnr.A0856. [DOI] [PMC free article] [PubMed] [Google Scholar]
- 48.Singh M, Jeong J, Hwang D, Sungkarat W, Gruen P. Novel diffusion tensor imaging methodology to detect and quantify injured regions and affected brain pathways in traumatic brain injury. Magnetic Resonance Imaging. 2010;28:22–40. doi: 10.1016/j.mri.2009.05.049. [DOI] [PMC free article] [PubMed] [Google Scholar]
- 49.Nudo RJ, Plautz EJ, Frost SB. Role of adaptive plasticity in recovery of function after damage to motor cortex. Muscle & Nerve. 2001;24:1000–1019. doi: 10.1002/mus.1104. [DOI] [PubMed] [Google Scholar]
- 50.Schallert T, Leasure JL, Kolb B. Experience-associated structural events, subependymal cellular proliferative activity, and functional recovery after injury to the central nervous system. Journal of Cerebral Blood Flow and Metabolism: Official Journal of the International Society of Cerebral Blood Flow and Metabolism. 2000;20:1513–1528. doi: 10.1097/00004647-200011000-00001. [DOI] [PubMed] [Google Scholar]
- 51.Keyvani K, Schallert T. Plasticity-associated molecular and structural events in the injured brain. Journal of Neuropathology and Experimental Neurology. 2002;61:831–840. doi: 10.1093/jnen/61.10.831. [DOI] [PubMed] [Google Scholar]
- 52.Jeurissen B, Leemans A, Tournier J-D, Jones DK, Sijbers J. Estimating the number of fiber orientations in diffusion MRI voxels: A Constrained Spherical Deconvolution Study. Stockholm: 2010. [Google Scholar]