

Abstract
Drug-metabolizing enzymes within enterocytes constitute a key barrier to xenobiotic entry into the systemic circulation. Furanocoumarins in grapefruit juice are cornerstone examples of diet-derived xenobiotics that perpetrate interactions with drugs via mechanism-based inhibition of intestinal CYP3A4. Relative to intestinal CYP3A4-mediated inhibition, alternate mechanisms underlying dietary substance–drug interactions remain understudied. A working systematic framework was applied to a panel of structurally diverse diet-derived constituents/extracts (n = 15) as inhibitors of intestinal UDP-glucuronosyl transferases (UGTs) to identify and characterize additional perpetrators of dietary substance–drug interactions. Using a screening assay involving the nonspecific UGT probe substrate 4-methylumbelliferone, human intestinal microsomes, and human embryonic kidney cell lysates overexpressing gut-relevant UGT1A isoforms, 14 diet-derived constituents/extracts inhibited UGT activity by >50% in at least one enzyme source, prompting IC50 determination. The IC50 values of 13 constituents/extracts (≤10 μM with at least one enzyme source) were well below intestinal tissue concentrations or concentrations in relevant juices, suggesting that these diet-derived substances can inhibit intestinal UGTs at clinically achievable concentrations. Evaluation of the effect of inhibitor depletion on IC50 determination demonstrated substantial impact (up to 2.8-fold shift) using silybin A and silybin B, two key flavonolignans from milk thistle (Silybum marianum) as exemplar inhibitors, highlighting an important consideration for interpretation of UGT inhibition in vitro. Results from this work will help refine a working systematic framework to identify dietary substance–drug interactions that warrant advanced modeling and simulation to inform clinical assessment.
Introduction
The gastrointestinal tract represents the first portal to xenobiotics taken orally, including myriad drugs and diet-derived substances. Consequently, such xenobiotics must traverse the intestinal epithelial barrier before entering the hepatic venous, and eventually systemic, circulation. This barrier is composed primarily of enterocytes that, like hepatocytes, express a plethora of biotransformation enzymes that can influence significantly the extent of presystemic (first-pass) xenobiotic metabolism (Won et al., 2012). Accordingly, inhibition of intestinal enzymes can lead to an increase in hepatic and systemic exposure to the “victim” xenobiotic with the subsequent potential for unwanted effects. A well studied “perpetrator” diet-derived substance is grapefruit juice, which contains furanocoumarins that inhibit intestinal CYP3A4 via mechanism-based inhibition with subsequent protein degradation (Paine and Oberlies, 2007). More than 85 medications are vulnerable to the “grapefruit juice effect,” of which the labeling for several includes cautionary statements (Bailey et al., 2013).
Relative to intestinal CYP3A4-mediated inhibition, other mechanisms underlying dietary substance–drug interactions remain understudied. Many drugs and diet-derived constituents, particularly polyphenolic molecules, undergo extensive presystemic phase II metabolism in both the gut and the liver, with glucuronidation typically predominating in humans (Ritter, 2007; Wu et al., 2011). Drug molecules seldom inhibit this process with sufficient potency to overcome the low affinity and high capacity of the UDP-glucuronosyl transferases (UGTs). Accordingly, drugs rarely perpetrate clinically relevant UGT-mediated interactions (Williams et al., 2004). In contrast, diet-derived constituents have shown greater inhibitory potency toward UGT activity than most drugs, including those considered prototypic UGT inhibitors, such as some nonsteroidal anti-inflammatory agents, benzodiazepines, and immunosuppressants (Kiang et al., 2005; Mohamed et al., 2010; Mohamed and Frye, 2011a,b; Li et al., 2012).
Diet-derived constituent concentrations in enterocytes typically are much higher than systemic concentrations, especially when considering unconjugated constituents. This contention was demonstrated following oral administration of the semipurified milk thistle (Silybum marianum) extract silibinin (1400 mg), of which mean colorectal tissue concentrations were >50-fold higher than systemic concentrations (∼140 versus 2.5 μM) (Hoh et al., 2006). High enteric concentrations, coupled with the high inhibitory potencies of diet-derived constituents/extracts toward enteric glucuronidation, raise concern for clinically relevant dietary substance–drug interactions mediated via inhibition of intestinal UGTs.
Despite growing recognition of the potential for dietary substance–drug interactions, systematic approaches to identify and characterize the risk of these interactions remain elusive (Won et al., 2012; Brantley et al., 2014a). Considerations unique to evaluation of UGT inhibition, including luminal orientation of UGT proteins requiring detergents or pore-forming agents to reduce latency, limited availability of authentic glucuronide standards, and a lack of isoform-selective probe substrates and inhibitors, have further hampered efforts to correlate in vitro inhibitory potency with in vivo interaction risk. Rapid clearance of UGT substrates, as well as inhibitors, likely violates assumptions applicable to inhibitory assay conditions developed using enzyme systems with lower metabolic capacity and higher affinity, such as cytrochrome P450 enzymes (i.e., minimal substrate and inhibitor depletion). As such, traditional approaches used to evaluate drug interaction liability may not be applicable to UGT-mediated interactions. In addition to experimental considerations, the highly variable composition and structural diversity of dietary substances further complicates evaluation of drug interaction liability. Interaction risk is compounded by the relative lack of regulatory oversight to guide dosing recommendations, safety assessment, and chronic use of dietary substances. As proposed, examination of isolated constituents would facilitate development of systematic approaches (Brantley et al., 2013). A systematic evaluation of isolated dietary substance constituents as inhibitors of intestinal UGTs, including gut-specific isoforms, has not been reported.
The objective of this study was to evaluate selected diet-derived constituents/extracts as inhibitors of intestinal glucuronidation. The aims were to 1) test a panel of dietary constituents and extracts using the nonspecific UGT probe substrate 4-methylumbelliferone (4-MU), human intestinal microsomes (HIMs), and UGT1A-overexpressing human embryonic kidney (HEK293) cell lysates; 2) determine the inhibition potency (IC50) of selected constituents/extracts; and 3) prioritize constituents/extracts for further evaluation. Results will help refine a working systematic framework for identification of dietary substance–drug interactions that warrant advanced modeling and simulation to inform clinical assessment. Ultimately, these efforts will help to provide evidence-based recommendations to both clinicians and consumers about the safety or risk of taking certain dietary substances with conventional medications.
Materials and Methods
Human liver microsomes (HLMs) (pooled from 50 donors, mixed gender) and HIMs (pooled from 13 donors, mixed gender) were purchased from Xenotech, LLC (Lenexa, KS). HEK293 cells overexpressing individual UGT1A enzymes were harvested and homogenates prepared as described previously (Sun et al., 2013). Alamethicin, bovine serum albumin, diclofenac, epigallocatechin gallate (EGCG), magnesium chloride, 4-MU, naringin, nicardipine, saccharolactone, silibinin, and UDP-glucuronic acid (UDPGA) were purchased from Sigma-Aldrich (St. Louis, MO). Apigenin, kaempferol, naringenin, and quercetin were purchased from Cayman Chemical Company (Ann Arbor, MI). Silymarin was obtained from Euromed S.A. (Barcelona, Spain) and consisted of the flavonolignans silybin A (16%), silybin B (24%), isosilybin A (6.4%), isosilybin B (4.4%), silydianin (17%), silychristin (12%), and isosilychristin (2.2%); the remainder consisted of the flavonoid taxifolin (1.6%) and uncharacterized polyphenols and aliphatic fatty acids (Davis-Searles et al., 2005). The individual flavonolignans were purified as described previously (Graf et al., 2007) and were >97% pure as determined by ultra-high-performance liquid chromatography (UHPLC) (Napolitano et al., 2013). Methanol (liquid chromatography–mass spectrometry grade), ethanol, Tris-HCl, Tris base, and formic acid were purchased from Fisher Scientific (Waltham, MA).
Evaluation of Milk Thistle Flavonolignans and Other Diet-Derived Constituents as Inhibitors of Intestinal UGT Activity
Milk thistle flavonolignans (silybin A, silybin B, isosilybin A, isosilybin B, silychristin, isosilychristin, and silydianin) and associated extracts (silibinin and silymarin) and other, structurally diverse diet-derived constituents (naringin, naringenin, apigenin, kaempferol, quercetin, and EGCG) (Supplemental Fig. 1) were evaluated as inhibitors of intestinal UGT activity using 4-MU, HIMs, and HEK293 cell lysates overexpressing the gut-relevant UGT isoforms UGT1A1, UGT1A8, and UGT1A10. Inhibition of hepatic glucuronidation by HLMs was evaluated as a comparator for the intestinal systems, as well as literature values obtained from hepatic systems. 4-MU, diclofenac, nicardipine, and each dietary constituent/extract were dissolved in methanol to yield 40 mM stock solutions. UDPGA was prepared fresh in Tris-HCl buffer (100 mM; pH 7.5) to yield a 40 mM stock solution. Incubation conditions were optimized for linearity with respect to time, substrate concentration, and protein concentration based on a previous report (Uchaipichat et al., 2004).
Initial Testing.
Incubation mixtures (150 μl total volume) consisted of HIMs (0.2 mg/ml), HLMs (0.4 mg/ml), or UGT1A-overexpressing HEK293 cell lysates (0.05, 0.025, or 0.02 mg/ml for UGT1A1, UGT1A8, and UGT1A10, respectively); 4-MU [100 μM (HIMs and HLMs) or 75 μM (HEK293 lysates)]; dietary constituent (10 or 100 μM) or the prototypic UGT inhibitor nicardipine (400 μM) (Lapham et al., 2012); bovine serum albumin (0.05%); alamethicin (50 μg/mg protein; mixtures containing HIMs and cell lysates); saccharolactone (100 μM); and Tris-HCl buffer supplemented with magnesium chloride (5 mM). The selected dietary constituent concentrations were based on a reasonable approximation of the anticipated range of concentrations in the gut (Brantley et al., 2010, 2013) and were used to plan subsequent IC50 determination experiments (see below). HIMs and cell lysates were activated by incubating with alamethicin on ice for 15 minutes. Mixtures were equilibrated at 37°C for 10 minutes before initiating the reactions with UDPGA (4 mM final concentration). 4-MU depletion was monitored via fluorescence (365 nm excitation, 450 nm emission) at predetermined intervals from 0–20 minutes with a Synergy H1M monochromator-based multimode microplate reader (BioTek, Winooski, VT). 4-MU concentrations were quantified using Gen5 data analysis software (v. 2.0; BioTek) by interpolation from matrix-matched calibration curves. Measurement time intervals were optimized for each protein source to capture the linear phase of 4-MU depletion and to minimize incubation times (data not shown).
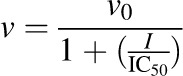
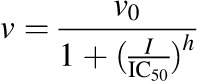
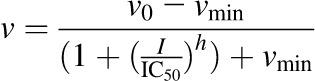
Apparent IC50 Determination.
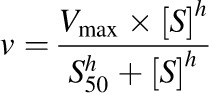
Constituents/extracts demonstrating >50% inhibition at 100 μM (microsomes) or 10 μM (cell lysates) were selected for IC50 determination. Incubation conditions mirrored those detailed for initial testing except that a range of inhibitor concentrations (n = 7) was tested. The prototypic UGT inhibitors diclofenac and nicardipine were included as comparators. Initial estimates were determined by visual inspection of the velocity of 4-MU depletion versus the natural logarithm of inhibitor concentration. Final parameter estimates were recovered by fitting eqs. 1, 2 (DeLean et al., 1978), or 3 (Pietsch et al., 2009) to untransformed data via nonlinear least-squares regression using Phoenix WinNonlin (v. 6.3; Certara, St. Louis, MO):
 |
(1) |
 |
(2) |
 |
(3) |
where v denotes the velocity of 4-MU depletion, v0 denotes the initial velocity of 4-MU depletion in the absence of inhibitor, I denotes the nominal inhibitor concentration, h denotes the Hill coefficient, and vmin denotes the velocity of 4-MU depletion in the presence of infinite inhibitor concentration. The best-fit equation was determined by visual inspection of the observed versus predicted data, randomness of the residuals, Akaike information criteria, and S.E.’s of the parameter estimates.
Silybin A, Silybin B, and Silibinin Microsomal Intrinsic Clearance Determination
Rapid clearance of dietary substance constituents may impact the determination of UGT inhibition potency. Silibinin, a semipurified milk thistle extract composed of a 1:1 mixture of silybin A and silybin B (Kroll et al., 2007), was selected previously as a model herbal product perpetrator of dietary substance–drug interactions (Brantley et al., 2013, 2014b). Microsomal intrinsic clearances of silybin A and silybin B were determined to assess the impact of inhibitor depletion on the recovery of apparent IC50 using pooled HIMs and HLMs.
Microsomal Incubations.
Conditions mirrored those described above. Silybin A and silybin B concentration ranges encompassing the Km or S50 (estimated from the IC50) for each enzyme source were used to recover kinetic parameters (Km or S50, Vmax) via the multiple depletion curves method (Sjögren et al., 2009). Silybin A and silybin B concentration was measured at seven predefined time points from triplicate incubations of six initial concentrations. Reactions were initiated by addition of UDPGA (4 mM) and terminated at predetermined intervals by removing 100 μl from the incubation and diluting into 300 μl of ice-cold methanol containing internal standard (naringin, 1 μM). Samples were centrifuged (3000g, 10 minutes, 4°C), and 125 μl of supernatant was removed and transferred to clean 96-well plates for analysis by UHPLC–tandem mass spectrometry (UHPLC-MS/MS).
Quantification of Silybin A and Silybin B by UHPLC-MS/MS.
Chromatographic separation was achieved using an HSS T3 column (1.8 μM, 2.1 × 100 mm) with a VanGuard Pre-Column (2.1 × 5 mm) (Waters Corporation, Waltham, MA) heated to 50°C and a binary gradient at a flow rate of 0.6 ml/min. The gradient elution started at 70:30 water/methanol (each with 0.1% formic acid) and increased linearly to 45:55 of phase A to B over 5 minutes before returning to initial conditions over 0.1 minute and holding for 0.9 minute; the total run time was 6 minutes. Samples were analyzed (3 μl injection volume) using the QTRAP 6500 UHPLC-MS/MS system (AB Sciex, Framingham, MA) with turbo electrospray source operated in negative ion mode. The declustering potential and collision energy were set at −25 V and −32 mV, respectively. Silybin A and silybin B (481.1 → 125.1 m/z), monoglucuronide conjugates (657.1 → 481.1 m/z), and naringin (579.0 → 271.0 m/z) were monitored in multiple reaction monitoring mode. Silybin A and silybin B concentrations were quantified using MultiQuant software (v. 2.1.1; AB Sciex) by interpolation from matrix-matched calibration curves and quality controls with a linear range of 0.8–200 μM. The calibration standards and quality controls were judged for batch quality based on the 2013 Food and Drug Administration guidance for industry regarding bioanalytical method validation (http://www.fda.gov/downloads/Drugs/GuidanceComplianceRegulatoryInformation/Guidances/UCM368107.pdf). Peak area ratios were used to assess glucuronide formation qualitatively, as authentic standards were not available.
Calculation of Intrinsic Clearance.
Km or S50 and Vmax were obtained by fitting the simple Michaelis-Menten (eq. 4) or Hill (eq. 5) equation to [substrate] versus depletion velocity data using Phoenix WinNonlin:
 |
(4) |
 |
(5) |
where v denotes the velocity of substrate depletion, S denotes nominal substrate concentration, and S50 denotes the substrate concentration corresponding to 50% of Vmax.
Impact of Inhibitor Depletion on Apparent IC50 Determination
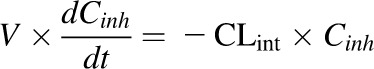
The apparent IC50 values were recovered initially using nominal inhibitor concentration as described above. The impact of inhibitor depletion was determined using predicted inhibitor concentrations present at each time point during the 20-minute incubation period. Inhibitor depletion at each concentration was described by eq. 6:
 |
(6) |
where V is the volume of the incubation per milligram of microsomal protein, Cinh is the concentration of inhibitor in the incubation, t is time, and CLint is the intrinsic clearance of the inhibitor calculated as the ratio of Vmax to Km. Maximum clearance (CLmax) was calculated for an inhibitor described by the Hill equation using eq. 7 (Houston and Kenworthy, 2000) and input into eq. 6 in place of CLint:
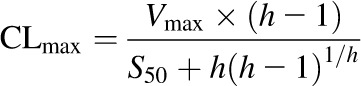 |
(7) |
Model equations were input into Phoenix WinNonlin. The IC50 fold-shift was calculated as the ratio of the apparent IC50 using nominal concentration to the shifted IC50 using predicted inhibitor concentrations at 10 or 20 minutes.
Statistical Analysis
Data are presented as mean ± S.D. of triplicate incubations unless indicated otherwise. IC50 values are presented as the estimates ± S.E. Concentration-dependent inhibition was evaluated by a paired Student’s t test using untransformed data. A P < 0.05 was considered significant.
Results
Diet-Derived Constituents Differentially Inhibit Intestinal 4-MU Glucuronidation.
All dietary constituents/extracts inhibited 4-MU glucuronidation in a concentration-dependent manner (10 versus 100 μM) in HIMs (with the exception of isosilybin A) (Fig. 1, A and B) and in HLMs (Fig. 1, C and D). Constituents/extracts that inhibited activity by >50% at 100 μM relative to vehicle were selected for IC50 determination (HIMs: silybin A, silybin B, isosilybin B, silymarin, kaempferol, quercetin, and EGCG; HLMs: silybin B, silymarin, kaempferol, quercetin, and EGCG). Compared with the UGT activity in HIMs and HLMs, activity in UGT1A-overexpressing HEK293 cell lysates was generally more sensitive to inhibition by the tested constituents/extracts, particularly the milk thistle flavonolignans toward UGT1A8 (Fig. 2). The lack of concentration-dependent inhibition by several constituents/extracts reflected potent inhibition (>50%) at 10 μM and minimal changes in 4-MU depletion rate at 100 μM, a sensitivity limitation inherent to the substrate depletion method. Constituents/extracts that inhibited 4-MU glucuronidation by >50% at 10 μM for individual UGTs were selected for IC50 determination [UGT1A1: silybin A, isosilybin B, isosilychristin, silydianin, silibinin, naringin, kaempferol, and EGCG (Fig. 2, A and B); UGT1A8: silybin A, silybin B, isosilybin A, isosilybin B, silychristin, isosilychristin, silydianin, silibinin, silymarin, naringin, and kaempferol (Fig. 2, C and D); UGT1A10: silybin A, isosilybin B, silychristin, silydianin, naringin, naringenin, kaempferol, and quercetin (Fig. 2, E and F)]. Silybin B also was selected for testing with UGT1A1 based on its contribution to silibinin composition (Kroll et al., 2007).
Fig. 1.

Initial testing of milk thistle flavonolignans and other diet-derived constituents as inhibitors of 4-MU glucuronidation in HIMs (A and B) and HLMs (C and D) at 10 μM (green) and 100 μM (black) compared with vehicle control (0.1% methanol) (white). Hatched black bars denote the prototypic UGT inhibitor nicardipine (400 μM). Dashed lines denote 50% inhibition. Control activity was 4.4 ± 0.5 and 12 ± 0.5 nmol/min/mg microsomal protein for HIMs and HLMs, respectively. Bars and error bars denote means and S.D.’s, respectively, of triplicate incubations. *P < 0.05, 10 versus 100 μM (paired Student’s t test using untransformed data).
Fig. 2.

Initial testing of milk thistle flavonolignans/extracts and other diet-derived constituents as inhibitors of 4-MU glucuronidation in HEK293 cell lysates overexpressing UGT1A1 (A and B), UGT1A8 (C and D), or UGT1A10 (E and F) at 10 μM (green) and 100 μM (black) compared with vehicle control (0.1% methanol) (white). Hatched black bars denote the prototypic UGT inhibitor nicardipine (400 μM). Dashed lines denote 50% inhibition. Control activity was 13 ± 1.1, 20 ± 5.6, and 56 ± 7.0 nmol/min per mg microsomal protein for UGT1A1, UGT1A8, and UGT1A10, respectively. Bars and error bars denote means and S.D.’s, respectively, of triplicate incubations. *P < 0.05, 10 versus 100 μM (paired Student’s t test using untransformed data).
Diet-Derived Constituents Inhibit Intestinal UGTs at Clinically Achievable Concentrations.
The IC50 values of the majority of the constituents/extracts (13 of 15) were ≤10 μM with at least one enzyme source (Table 1). Intestinal microsomal activity was more sensitive to inhibition than hepatic microsomal activity; the IC50 values for silybin B, silymarin, kaempferol, quercetin, and EGCG were lower with HIMs than with HLMs. Kaempferol was the most potent inhibitor of UGT activity in both HIMs and HLMs. The IC50 values of all constituents toward UGT1A8 and UGT1A10 activity were <11 μM. Silydianin was the most potent inhibitor of both UGT1A1 and UGT1A8 activity, whereas kaempferol was the most potent inhibitor of UGT1A10 activity. Dietary constituents/extracts were more potent than prototypic drug inhibitors, consistent with a previous report (Uchaipichat et al., 2004). The IC50 of diclofenac with HLMs was described best by eq. 3, indicating a lack of inhibitory potency toward one or more isoforms catalyzing 4-MU glucuronidation.
TABLE 1.
IC50 values of milk thistle constituents and extracts and other diet-derived constituents toward 4-MU glucuronidation
Apparent IC50 values were determined by fitting eqs. 1, 2, or 3 to observed 4-MU depletion velocities versus nominal inhibitor concentration. Values represent the IC50 estimate ± S.E. via nonlinear least-squares regression using Phoenix WinNonlin (v. 6.3). UGT1A1, UGT1A8, and UGT1A10 refer to HEK293 cell lysates overexpressing respective individual isoforms.
| Constituent/Extract | Enzyme Source (IC50) | ||||
|---|---|---|---|---|---|
| HLMs | HIMs | UGT1A1 | UGT1A8 | UGT1A10 | |
| μM | |||||
| Milk thistle flavonolignans | |||||
| Silybin A | – | 64.8 ± 6.3 | 28.8 ± 5.5 | 5.9 ± 1.4 | 2.7 ± 0.6 |
| Silybin B | 87.3 ± 7.1 | 46.9 ± 6.0 | 27.5 ± 5.7 | 5.8 ± 1.8 | – |
| Isosilybin A | – | – | – | 6.7 ± 1.5 | – |
| Isosilybin B | – | 187 ± 30.9 | 51.1 ± 18.2 | 7.2 ± 1.4 | 5.9 ± 0.9 |
| Silychristin | – | – | – | 2.5 ± 0.6 | 6.0 ± 1.1 |
| Isosilychristin | – | – | 53.5 ± 15.3 | 2.0 ± 0.3 | – |
| Silydianin | 97.7 ± 8.4 | – | 5.3 ± 1.7 | 1.1 ± 0.3 | 6.8 ± 2.2 |
| Milk thistle extracts | |||||
| Silibinin | – | – | 11.1 ± 3.0 | 3.9 ± 1.7 | – |
| Silymarin | 106 ± 7.0 | 40.5 ± 5.3 | – | 4.8 ± 1.6 | – |
| Other diet-derived constituents | |||||
| Naringin | – | – | 14.8 ± 1.8 | 6.3 ± 1.3 | 3.4 ± 0.8 |
| Naringenin | – | – | – | – | 2.8 ± 1.2 |
| Apigenin | – | – | – | – | – |
| Kaempferol | 25.2 ± 2.7 | 11.6 ± 2.9 | 7.9 ± 2.2 | 10.6 ± 1.6 | 0.9 ± 0.4 |
| Quercetin | 70.0 ± 2.4 | 23.4 ± 2.6 | – | – | 8.2 ± 3.3 |
| EGCG | 105 ± 3.6 | 45.8 ± 8.2 | 26.2 ± 5.4 | – | – |
| Prototypic UGT inhibitors | |||||
| Diclofenac | 160 ± 11.3 | 334 ± 74.4 | – | – | – |
| Nicardipine | 160 ± 10.0 | – | – | – | 1.5 ± 0.4 |
–, not determined.
The Multiple Depletion Curves Method Enabled Recovery of Silybin A and Silybin B Microsomal Intrinsic Clearance Parameters.
UHPLC separation coupled with the AB Sciex QTRAP 6500 platform facilitated rapid separation (6 minute total run time) and sensitive detection (lower limit of quantitation, 0.8 μM) of silybin A, silybin B, and respective monoglucuronides (Fig. 3). Silybin A and silybin B were cleared rapidly by both HIMs and HLMs. Silybin A glucuronidation by HIMs was described best by the Hill equation (eq. 5), whereas glucuronidation by HLMs was described best by the simple Michaelis-Menten equation (eq. 4) (Fig. 4A; Table 2). Silybin B glucuronidation by both HIMs and HLMs was described best by the simple Michaelis-Menten equation (Fig. 4B; Table 2). Solubility limitations with silybin B precluded use of higher substrate concentrations for accurate recovery of Vmax (Fig. 4). Qualitative assessment of glucuronide formation indicated two monoglucuronide metabolites for both silybin A and silybin B (Fig. 3). Both compounds appeared to generate one metabolite (monoglucuronide 1) with higher affinity than the other (monoglucuronide 2), consistent with a previous report of regioselective silibinin metabolism (Jančová et al., 2011) (Fig. 5; Table 2).
Fig. 3.

Representative UHPLC-MS/MS chromatograms for silybin A (SA; 481.1 → 125.1 m/z), silybin A monoglucuronides (SA-glucs; 657.1 → 481.1 m/z), silybin B (SB; 481.1 → 125.1 m/z), silybin B monoglucuronides (SB-glucs; 657.1 → 481.1 m/z), and internal standard (IS; 579.0 → 271.0 m/z). Retention times were 4.6 minutes (SA), 2.1 minutes (SA monoglucuronide 1), 2.9 minutes (SA monoglucuronide 2), 4.8 minutes (SB), 2.2 minutes (SB monoglucuronide 1), 3.3 minutes (SB monoglucuronide 2), and 2.6 minutes (IS, naringin). A background peak (3.1 minutes) was consistently present in the glucuronide traces that did not demonstrate time or concentration dependence. CPS, counts per second.
Fig. 4.

Michaelis-Menten plots for glucuronidation of silybin A (A) and silybin B (B) by HIMs (green) and HLMs (gray) recovered using the multiple depletion curves method. Symbols and error bars denote means and S.D.’s, respectively, of observed values. Curves denote model-generated values.
TABLE 2.
Enzyme kinetic parameters for glucuronidation of silybin A and silybin B
Enzyme kinetic parameters (Km or S50, Vmax) for glucuronidation of silybin A and silybin B were determined by fitting eq. 4 (Km, Vmax) or eq. 5 (S50, Vmax) to [substrate] versus substrate depletion (silybin A and silybin B) or metabolite formation (monoglucuronide) velocity data using Phoenix WinNonlin. Values represent the parameter estimate ± S.E. Intrinsic clearance (CLint) was calculated as the ratio of Vmax to Km; maximum clearance (CLmax) was calculated using eq. 6.
| Enzyme Source | ||||||
|---|---|---|---|---|---|---|
| HIMs | HLMs | |||||
| Km or S50 | Vmax | CLint or CLmax | Km | Vmax | CLint | |
| μM | nmol/min/mg | ml/min/mg | μM | nmol/min/mg | ml/min/mg | |
| Silybin A | 55 ± 9.3a | 7.6 ± 1.3a | 0.071a | 33 ± 5.2 | 20 ± 1.1 | 0.62 |
| Monoglucuronide 1 | 4.2 ± 0.4 | – | – | 2.0 ± 0.4 | – | – |
| Monoglucuronide 2 | 27 ± 2.9 | – | – | 19 ± 2.9 | – | – |
| Silybin B | 39 ± 14 | 94 ± 14 | 2.4 | 81 ± 9.4 | 140 ± 8.5 | 1.7 |
| Monoglucuronide 1 | 6.7 ± 1.0 | – | – | 3.5 ± 0.5 | – | – |
| Monoglucuronide 2 | 9.8 ± 1.6 | – | – | 7.6 ± 1.5 | – | – |
–, not determined.
Described best by the Hill equation (eq. 5).
Fig. 5.

Michaelis-Menten plots for glucuronidation of silybin A by HIMs (A) and HLMs (B) and of silybin B by HIMs (C) and HLMs (D) recovered using glucuronide metabolite formation [peak area ratios (PAR) over time]. Monoglucuronide 1 (left column) and monoglucuronide 2 (right column) designations were based on UHPLC retention time. Symbols and error bars denote means and S.D.’s, respectively, of observed values. Curves denote model-generated values.
Inhibitor Depletion Can Impact Apparent IC50 Determination for Rapidly Cleared UGT Inhibitors.
Relatively slow clearance of silybin A by HIMs resulted in minimal changes in IC50 (<1.1-fold shift at 10 and 20 minutes, respectively) (Fig. 6A). The IC50 of silybin B with HIMs shifted 1.3- and 1.9-fold at 10 and 20 minutes, respectively (Fig. 6B). The ∼1.5-fold more rapid clearance of silybin B by HLMs (compared with silybin B by HIMs) resulted in a 1.6- and 2.8-fold shift in IC50 at 10 and 20 minutes, respectively (Fig. 6C).
Fig. 6.

Impact of inhibitor depletion on the recovery of apparent IC50 of silybin A (A) or silybin B (B) by pooled HIMs and of silybin B by pooled HLMs (C). Curves denote nonlinear least-squares regression of observed 4-MU depletion data versus nominal inhibitor concentration (black) or predicted inhibitor concentration at 10 minutes (dashed) or 20 minutes (dotted) using Phoenix WinNonlin (v. 6.3).
Discussion
Clinicians and consumers are becoming increasingly aware of the potential for interactions between diet-derived substances and conventional medications. However, definitive evidence supporting the risk or safety of certain dietary substance–drug combinations remains scarce. This deficiency is due in part to the complex composition of dietary substances, precluding application of established paradigms used to assess drug-drug interaction risk. A working framework to elucidate potential mechanisms underlying dietary substance–drug interactions has been proposed (https://nccam.nih.gov/sites/nccam.nih.gov/files/HerbDrugInteractionsWorkshopSummary.pdf; Won et al., 2012; Brantley et al., 2013, 2014a,b). This framework centers on the evaluation of isolated constituents to ascertain the relative contribution of each constituent to the mixture, as well as to identify marker constituents that can be used to predict the likelihood and magnitude of these interactions. As an extension of previous studies focused on cytochrome P450–mediated inhibition (Brantley et al., 2010, 2013, 2014b; Kim et al., 2011), this framework was applied to 13 isolated constituents and 2 extracts as inhibitors of glucuronidation with a focus on gut-relevant enzymes.
Initial testing, involving two concentrations (10 and 100 μM) of each constituent/extract, demonstrated HIMs and HEK293 cell lysates overexpressing gut-relevant UGT1A isoforms (UGT1A1, UGT1A8, and UGT1A10) to be more sensitive to inhibition than HLMs (Figs. 1 and 2). Dietary substance–drug interactions mediated via inhibition of hepatic UGT1A have been deemed unlikely based on in vitro inhibition constants (Ki and IC50 values) of selected individual constituents that were well above maximum plasma concentrations (Cmax) observed in human pharmacokinetic studies (micromolar versus nanomolar) (Mohamed and Frye, 2011a; Gurley et al., 2012; Li et al., 2012). Clinical evaluation of diet-derived substances as inhibitors of systemic drug glucuronidation, including garlic (Gwilt et al., 1994) and milk thistle (van Erp et al., 2005), confirmed minimal or no interaction risk with the UGT1A substrates acetaminophen and irinotecan, respectively. Consistent with previous reports, the IC50 values obtained with HLMs in the current work exceeded maximum systemic concentrations typically observed in vivo for milk thistle flavonolignans, kaempferol, quercetin, or EGCG (>25 μM versus ≤1 μM) (Manach et al., 2005; Ude et al., 2013; Zhu et al., 2013). These data reinforce the assertion that diet-derived constituents are unlikely to perpetrate clinically relevant interactions with conventional medications via inhibition of hepatic UGTs. However, nanoparticle formulations (Nair et al., 2010), prodrug strategies (Biasutto and Zoratti, 2014), phytosome complexes (Kidd, 2009), and other approaches to enhance systemic exposure of diet-derived constituents may alter future interpretation.
Compared with the liver, the intestine does not express the same complement of UGTs in terms of both abundance and isoform diversity (Court et al., 2012; Fallon et al., 2013), which may explain why HIMs were more sensitive to inhibition by diet-derived constituents than HLMs. Initial testing with HEK293 cell lysates showed that UGT1A8 and UGT1A10 were the most sensitive to inhibition by diet-derived constituents/extracts, suggesting that drug substrates for these isoforms may carry increased risk of interactions mediated by inhibition of enteric glucuronidation. Based on a predefined criterion of >50% inhibition of UGT activity in any enzyme source (Figs. 1 and 2), 14 constituents/extracts were selected for IC50 determination.
The IC50 values of the milk thistle flavonolignans and extracts, naringin, naringenin, kaempferol, and quercetin toward intestinal UGT activity (Table 1) were well below concentrations measured in intestinal tissue or citrus juices. For example, the IC50 values of silibinin and isolated constituents silybin A and silybin B (<10 μM) were more than 10 times lower than mean colorectal tissue concentrations following oral administration of 1400 mg silibinin to cancer patients (∼140 μM) (Hoh et al., 2006). Likewise, the IC50 values of naringin and naringenin (<10 μM) were at least 30 times lower than concentrations in citrus juices (>300 μM) (Erlund et al., 2001; Vandermolen et al., 2013). Finally, the IC50 values of kaempferol and quercetin, which are present in myriad foods, were below estimated concentrations in the intestinal lumen (<10 μM versus 15–20 μM) (Mohamed and Frye, 2010). Potent inhibition of enteric UGTs by these constituents/extracts at clinically achievable intestinal concentrations warrants their further evaluation as potential perpetrators of clinically relevant dietary substance–drug interactions via dynamic pharmacokinetic modeling and simulation techniques (http://www.fda.gov/downloads/Drugs/GuidanceComplianceRegulatoryInformation/Guidances/ucm292362.pdf; Won et al., 2012; Brantley et al., 2014b).
UGT1A-overexpressing HEK293 cell lysates enabled investigation of isoform-selective inhibition using a nonselective probe substrate to provide additional insight into inhibitory behavior observed with pooled microsomes. For example, kaempferol was shown previously to inhibit glucuronidation of the immunosuppressant mycophenolic acid (MPA) by both HIMs and HLMs, with a Ki of 4.5 ± 1.2 and 33.6 ± 2.5 μM, respectively (Mohamed and Frye, 2010). Inhibition of activity in HLMs could be attributed to inhibition of UGT1A9, as MPA is believed to be a UGT1A9-selective probe in HLMs (Court, 2005). The isoforms associated with inhibition of MPA glucuronidation in HIMs may include UGT1A8 and UGT1A10, which are expressed in intestinal tissue (Tukey and Strassburg, 2000) and known to catalyze the metabolism of MPA in vitro (Picard et al., 2005). The potent inhibition of UGT1A8 and UGT1A10 by kaempferol observed in the current work (IC50, 0.9 ± 0.4 and 10.6 ± 1.6 μM, respectively) supports this contention.
Clinically relevant intestinal UGT substrates include the anticancer agent raloxifene and the cholesterol-lowering agent ezetimibe (Kemp et al., 2002; Ghosal et al., 2004; Sun et al., 2013). Raloxifene intestinal glucuronidation is catalyzed predominately by both UGT1A8 and UGT1A10 (Sun et al., 2013). Inhibition of these enzymes could increase raloxifene bioavailability, increasing systemic exposure and the risk of adverse effects, including hot flashes and venous thromboembolism. Conversely, inhibition of intestinal glucuronidation could attenuate formation of the pharmacologically active glucuronide of ezetimibe, reducing therapeutic efficacy. Ezetimibe glucuronidation is mediated by multiple UGTs, including members of both the UGT1A and UGT2B families (Ghosal et al., 2004). Structure-activity relationships suggest that compounds containing the flavonol backbone, a common structural feature of many diet-derived constituents, are candidate substrates and inhibitors of the UGT1A family (Tripathi et al., 2013). Potent inhibition of intestinal UGT1As by dietary substances may impact the in vivo disposition of ezetimibe, but the potential exists for compensation by other UGTs, including UGT2B7 and UGT2B15. Although not investigated in the current work, diet-derived constituents may be potent inhibitors of these isoforms, particularly constituents containing a steroidal backbone, such as the saponins present in ginseng preparations (Fang et al., 2013). This observation raises the possibility of dietary substance–drug interactions mediated by inhibition of intestinal UGT2B7 and UGT2B15.
The immense chemical diversity of diet-derived constituents and the potential for interactions mediated via inhibition of several UGT isoforms highlight the need for an efficient and systematic approach to identify candidate inhibitors for further evaluation. A plate reader–based assay involving the nonspecific UGT probe substrate 4-MU and pooled microsomal and isoform-specific enzyme systems was used as a cost-effective means to screen multiple diet-derived constituents/extracts as inhibitors of intestinal glucuronidation and prioritize for further investigation. This assay enabled real-time kinetic measurement of substrate depletion and eliminated the need for extended incubation times. Short incubation times should minimize artifacts due to excessive (>20%) inhibitor or substrate depletion, as well as reduce the potential inhibition by UDP generated by these processes (Fujiwara et al., 2008). The impact of inhibitor depletion on the apparent IC50 recovered for an exemplar diet-derived constituent, silybin B, with HLMs (Fig. 6C) further highlights the importance of minimizing incubation times. Results imply that using nominal inhibitor concentrations may underpredict the potency of rapidly cleared inhibitors, resulting in a less conservative estimate of interaction risk. Such an underprediction may be concerning while interpreting screening data when inhibitors are binned into risk categories based on apparent IC50 values recovered using nominal concentrations. UGT substrates, especially polyphenolic, diet-derived constituents, tend to be cleared rapidly, making consideration of inhibitor depletion (in addition to substrate depletion) particularly important when evaluating candidate UGT inhibitors.
In summary, using a time- and cost-efficient assay, multiple diet-derived constituents/extracts from structurally diverse chemical classes were identified as potent inhibitors of intestinal UGT1A isoforms, particularly UGT1A8 and UGT1A10. Although inhibition potency toward 4-MU glucuronidation may not be predictive of the effects on enteric glucuronidation of clinically relevant substrates (Dong et al., 2012; Chengcheng et al., 2013), these dietary substances could be evaluated further as inhibitors of the glucuronidation of such substrates, including ezetimibe, MPA, and raloxifene, using a similar systematic approach. Results would prioritize for advanced modeling and simulation techniques that integrate in vitro inhibitory potency (Ki) with available clinical pharmacokinetic data to provide quantitative predictions of dietary substance–drug interaction risk (Brantley et al., 2014b). Modeling and simulation can be used to prioritize for clinical evaluation and to guide the design of clinical interaction studies, with the ultimate goal of providing conclusive evidence about the risk or safety of certain dietary substance–drug combinations.
Supplementary Material
Acknowledgments
M.F.P. dedicates this article to Dr. David P. Paine.
Abbreviations
- EGCG
epigallocatechin gallate
- HEK
human embryonic kidney
- HIM
human intestinal microsome
- HLM
human liver microsome
- MPA
mycophenolic acid
- 4-MU
4-methylumbelliferone
- UDPGA
UDP-glucuronic acid
- UGT
UDP-glucuronosyl transferase
- UHPLC
ultra-high-performance liquid chromatography
- UHPLC-MS/MS
ultra-high-performance liquid chromatography–tandem mass spectrometry
Authorship Contributions
Participated in research design: Gufford, Paine, Lazarus.
Conducted experiments: Gufford.
Contributed new reagents or analytic tools: Graf, Oberlies, Lazarus, Chen.
Performed data analysis: Gufford, Paine.
Wrote or contributed to the writing of the manuscript: Gufford, Graf, Chen, Lazarus, Oberlies, Paine.
Footnotes
This work was supported by the National Institutes of Health National Institute of General Medical Sciences [Grant R01-GM077482-S1]. B.T.G. was supported by a fellowship awarded by the American Foundation for Pharmaceutical Education.
 This article has supplemental material available at dmd.aspetjournals.org.
References
- Bailey DG, Dresser G, Arnold JM. (2013) Grapefruit-medication interactions: forbidden fruit or avoidable consequences? CMAJ 185:309–316 [DOI] [PMC free article] [PubMed] [Google Scholar]
- Biasutto L, Zoratti M. (2014) Prodrugs of quercetin and resveratrol: a strategy under development. Curr Drug Metab 15:77–95 [DOI] [PubMed] [Google Scholar]
- Brantley SJ, Argikar AA, Lin YS, Nagar S, Paine MF. (2014a) Herb-drug interactions: challenges and opportunities for improved predictions. Drug Metab Dispos 42:301–317 [DOI] [PMC free article] [PubMed] [Google Scholar]
- Brantley SJ, Graf TN, Oberlies NH, Paine MF. (2013) A systematic approach to evaluate herb-drug interaction mechanisms: investigation of milk thistle extracts and eight isolated constituents as CYP3A inhibitors. Drug Metab Dispos 41:1662–1670 [DOI] [PMC free article] [PubMed] [Google Scholar]
- Brantley SJ, Gufford BT, Dua R, Fediuk DJ, Graf TN, Scarlett YV, Frederick KS, Fisher MB, Oberlies NH, Paine MF. (2014b) Physiologically based pharmacokinetic modeling framework for quantitative prediction of an herb-drug interaction. CPT Pharmacometrics Syst Pharmacol 3:e107. [DOI] [PMC free article] [PubMed] [Google Scholar]
- Brantley SJ, Oberlies NH, Kroll DJ, Paine MF. (2010) Two flavonolignans from milk thistle (Silybum marianum) inhibit CYP2C9-mediated warfarin metabolism at clinically achievable concentrations. J Pharmacol Exp Ther 332:1081–1087 [DOI] [PMC free article] [PubMed] [Google Scholar]
- Chengcheng G, Rui X, Tianheng M, Wei Y, Liqun P. (2013) Probe substrate and enzyme source-dependent inhibition of UDP-glucuronosyltransferase (UGT) 1A9 by wogonin. Afr Health Sci 13:551–555 [DOI] [PMC free article] [PubMed] [Google Scholar]
- Court MH. (2005) Isoform-selective probe substrates for in vitro studies of human UDP-glucuronosyltransferases. Methods Enzymol 400:104–116 [DOI] [PubMed] [Google Scholar]
- Court MH, Zhang X, Ding X, Yee KK, Hesse LM, Finel M. (2012) Quantitative distribution of mRNAs encoding the 19 human UDP-glucuronosyltransferase enzymes in 26 adult and 3 fetal tissues. Xenobiotica 42:266–277 [DOI] [PubMed] [Google Scholar]
- Davis-Searles PR, Nakanishi Y, Kim NC, Graf TN, Oberlies NH, Wani MC, Wall ME, Agarwal R, Kroll DJ. (2005) Milk thistle and prostate cancer: differential effects of pure flavonolignans from Silybum marianum on antiproliferative end points in human prostate carcinoma cells. Cancer Res 65:4448–4457 [DOI] [PubMed] [Google Scholar]
- DeLean A, Munson PJ, Rodbard D. (1978) Simultaneous analysis of families of sigmoidal curves: application to bioassay, radioligand assay, and physiological dose-response curves. Am J Physiol 235:E97–E102 [DOI] [PubMed] [Google Scholar]
- Dong RH, Fang ZZ, Zhu LL, Liang SC, Ge GB, Yang L, Liu ZY. (2012) Investigation of UDP-glucuronosyltransferases (UGTs) inhibitory properties of carvacrol. Phytother Res 26:86–90 [DOI] [PubMed] [Google Scholar]
- Erlund I, Meririnne E, Alfthan G, Aro A. (2001) Plasma kinetics and urinary excretion of the flavanones naringenin and hesperetin in humans after ingestion of orange juice and grapefruit juice. J Nutr 131:235–241 [DOI] [PubMed] [Google Scholar]
- Fallon JK, Neubert H, Goosen TC, Smith PC. (2013) Targeted precise quantification of 12 human recombinant uridine-diphosphate glucuronosyl transferase 1A and 2B isoforms using nano-ultra-high-performance liquid chromatography/tandem mass spectrometry with selected reaction monitoring. Drug Metab Dispos 41:2076–2080 [DOI] [PMC free article] [PubMed] [Google Scholar]
- Fang ZZ, Cao YF, Hu CM, Hong M, Sun XY, Ge GB, Liu Y, Zhang YY, Yang L, Sun HZ. (2013) Structure-inhibition relationship of ginsenosides towards UDP-glucuronosyltransferases (UGTs). Toxicol Appl Pharmacol 267:149–154 [DOI] [PubMed] [Google Scholar]
- Fujiwara R, Nakajima M, Yamanaka H, Katoh M, Yokoi T. (2008) Product inhibition of UDP-glucuronosyltransferase (UGT) enzymes by UDP obfuscates the inhibitory effects of UGT substrates. Drug Metab Dispos 36:361–367 [DOI] [PubMed] [Google Scholar]
- Ghosal A, Hapangama N, Yuan Y, Achanfuo-Yeboah J, Iannucci R, Chowdhury S, Alton K, Patrick JE, Zbaida S. (2004) Identification of human UDP-glucuronosyltransferase enzyme(s) responsible for the glucuronidation of ezetimibe (Zetia). Drug Metab Dispos 32:314–320 [DOI] [PubMed] [Google Scholar]
- Graf TN, Wani MC, Agarwal R, Kroll DJ, Oberlies NH. (2007) Gram-scale purification of flavonolignan diastereoisomers from Silybum marianum (Milk Thistle) extract in support of preclinical in vivo studies for prostate cancer chemoprevention. Planta Med 73:1495–1501 [DOI] [PubMed] [Google Scholar]
- Gurley BJ, Fifer EK, Gardner Z. (2012) Pharmacokinetic herb-drug interactions (part 2): drug interactions involving popular botanical dietary supplements and their clinical relevance. Planta Med 78:1490–1514 [DOI] [PubMed] [Google Scholar]
- Gwilt PR, Lear CL, Tempero MA, Birt DD, Grandjean AC, Ruddon RW, Nagel DL. (1994) The effect of garlic extract on human metabolism of acetaminophen. Cancer Epidemiol Biomarkers Prev 3:155–160 [PubMed] [Google Scholar]
- Hoh C, Boocock D, Marczylo T, Singh R, Berry DP, Dennison AR, Hemingway D, Miller A, West K, Euden S, et al. (2006) Pilot study of oral silibinin, a putative chemopreventive agent, in colorectal cancer patients: silibinin levels in plasma, colorectum, and liver and their pharmacodynamic consequences. Clin Cancer Res 12:2944–2950 [DOI] [PubMed] [Google Scholar]
- Houston JB, Kenworthy KE. (2000) In vitro-in vivo scaling of CYP kinetic data not consistent with the classical Michaelis-Menten model. Drug Metab Dispos 28:246–254 [PubMed] [Google Scholar]
- Jančová P, Siller M, Anzenbacherová E, Křen V, Anzenbacher P, Simánek V. (2011) Evidence for differences in regioselective and stereoselective glucuronidation of silybin diastereomers from milk thistle (Silybum marianum) by human UDP-glucuronosyltransferases. Xenobiotica 41:743–751 [DOI] [PubMed] [Google Scholar]
- Kemp DC, Fan PW, Stevens JC. (2002) Characterization of raloxifene glucuronidation in vitro: contribution of intestinal metabolism to presystemic clearance. Drug Metab Dispos 30:694–700 [DOI] [PubMed] [Google Scholar]
- Kiang TK, Ensom MH, Chang TK. (2005) UDP-glucuronosyltransferases and clinical drug-drug interactions. Pharmacol Ther 106:97–132 [DOI] [PubMed] [Google Scholar]
- Kidd PM. (2009) Bioavailability and activity of phytosome complexes from botanical polyphenols: the silymarin, curcumin, green tea, and grape seed extracts. Altern Med Rev 14:226–246 [PubMed] [Google Scholar]
- Kim E, Sy-Cordero A, Graf TN, Brantley SJ, Paine MF, Oberlies NH. (2011) Isolation and identification of intestinal CYP3A inhibitors from cranberry (Vaccinium macrocarpon) using human intestinal microsomes. Planta Med 77:265–270 [DOI] [PMC free article] [PubMed] [Google Scholar]
- Kroll DJ, Shaw HS, Oberlies NH. (2007) Milk thistle nomenclature: why it matters in cancer research and pharmacokinetic studies. Integr Cancer Ther 6:110–119 [DOI] [PubMed] [Google Scholar]
- Lapham K, Bauman JN, Walsky RL, Niosi M, Orozco CC, Bourcier K, Giddens G, Obach RS, Hyland R. (2012) Digoxin and tranilast as novel isoform selective inhibitors of human UDP glucuronosyltransferase 1A9. Drug Metab Rev 44(Suppl):74–75 [Google Scholar]
- Li L, Hu H, Xu S, Zhou Q, Zeng S. (2012) Roles of UDP-glucuronosyltransferases in phytochemical metabolism of herbal medicines and the associated herb-drug interactions. Curr Drug Metab 13:615–623 [DOI] [PubMed] [Google Scholar]
- Manach C, Williamson G, Morand C, Scalbert A, Rémésy C. (2005) Bioavailability and bioefficacy of polyphenols in humans. I. Review of 97 bioavailability studies. Am J Clin Nutr 81 (1 Suppl):230S–242S [DOI] [PubMed] [Google Scholar]
- Mohamed MF, Frye RF. (2010) Inhibition of intestinal and hepatic glucuronidation of mycophenolic acid by Ginkgo biloba extract and flavonoids. Drug Metab Dispos 38:270–275 [DOI] [PubMed] [Google Scholar]
- Mohamed ME, Frye RF. (2011a) Effects of herbal supplements on drug glucuronidation. Review of clinical, animal, and in vitro studies. Planta Med 77:311–321 [DOI] [PubMed] [Google Scholar]
- Mohamed ME, Frye RF. (2011b) Inhibitory effects of commonly used herbal extracts on UDP-glucuronosyltransferase 1A4, 1A6, and 1A9 enzyme activities. Drug Metab Dispos 39:1522–1528 [DOI] [PMC free article] [PubMed] [Google Scholar]
- Mohamed MF, Tseng T, Frye RF. (2010) Inhibitory effects of commonly used herbal extracts on UGT1A1 enzyme activity. Xenobiotica 40:663–669 [DOI] [PubMed] [Google Scholar]
- Nair HB, Sung B, Yadav VR, Kannappan R, Chaturvedi MM, Aggarwal BB. (2010) Delivery of antiinflammatory nutraceuticals by nanoparticles for the prevention and treatment of cancer. Biochem Pharmacol 80:1833–1843 [DOI] [PMC free article] [PubMed] [Google Scholar]
- Napolitano JG, Lankin DC, Graf TN, Friesen JB, Chen SN, McAlpine JB, Oberlies NH, Pauli GF. (2013) HiFSA fingerprinting applied to isomers with near-identical NMR spectra: the silybin/isosilybin case. J Org Chem 78:2827–2839 [DOI] [PMC free article] [PubMed] [Google Scholar]
- Paine MF, Oberlies NH. (2007) Clinical relevance of the small intestine as an organ of drug elimination: drug-fruit juice interactions. Expert Opin Drug Metab Toxicol 3:67–80 [DOI] [PubMed] [Google Scholar]
- Picard N, Ratanasavanh D, Prémaud A, Le Meur Y, Marquet P. (2005) Identification of the UDP-glucuronosyltransferase isoforms involved in mycophenolic acid phase II metabolism. Drug Metab Dispos 33:139–146 [DOI] [PubMed] [Google Scholar]
- Pietsch M, Christian L, Inhester T, Petzold S, Gütschow M. (2009) Kinetics of inhibition of acetylcholinesterase in the presence of acetonitrile. FEBS J 276:2292–2307 [DOI] [PubMed] [Google Scholar]
- Ritter JK. (2007) Intestinal UGTs as potential modifiers of pharmacokinetics and biological responses to drugs and xenobiotics. Expert Opin Drug Metab Toxicol 3:93–107 [DOI] [PubMed] [Google Scholar]
- Sjögren E, Lennernäs H, Andersson TB, Gråsjö J, Bredberg U. (2009) The multiple depletion curves method provides accurate estimates of intrinsic clearance (CLint), maximum velocity of the metabolic reaction (Vmax), and Michaelis constant (Km): accuracy and robustness evaluated through experimental data and Monte Carlo simulations. Drug Metab Dispos 37:47–58 [DOI] [PubMed] [Google Scholar]
- Sun D, Jones NR, Manni A, Lazarus P. (2013) Characterization of raloxifene glucuronidation: potential role of UGT1A8 genotype on raloxifene metabolism in vivo. Cancer Prev Res (Phila) 6:719–730 [DOI] [PMC free article] [PubMed] [Google Scholar]
- Tripathi SP, Bhadauriya A, Patil A, Sangamwar AT. (2013) Substrate selectivity of human intestinal UDP-glucuronosyltransferases (UGTs): in silico and in vitro insights. Drug Metab Rev 45:231–252 [DOI] [PubMed] [Google Scholar]
- Tukey RH, Strassburg CP. (2000) Human UDP-glucuronosyltransferases: metabolism, expression, and disease. Annu Rev Pharmacol Toxicol 40:581–616 [DOI] [PubMed] [Google Scholar]
- Uchaipichat V, Mackenzie PI, Guo XH, Gardner-Stephen D, Galetin A, Houston JB, Miners JO. (2004) Human UDP-glucuronosyltransferases: isoform selectivity and kinetics of 4-methylumbelliferone and 1-naphthol glucuronidation, effects of organic solvents, and inhibition by diclofenac and probenecid. Drug Metab Dispos 32:413–423 [DOI] [PubMed] [Google Scholar]
- Ude C, Schubert-Zsilavecz M, Wurglics M. (2013) Ginkgo biloba extracts: a review of the pharmacokinetics of the active ingredients. Clin Pharmacokinet 52:727–749 [DOI] [PubMed] [Google Scholar]
- van Erp NP, Baker SD, Zhao M, Rudek MA, Guchelaar HJ, Nortier JW, Sparreboom A, Gelderblom H. (2005) Effect of milk thistle (Silybum marianum) on the pharmacokinetics of irinotecan. Clin Cancer Res 11:7800–7806 [DOI] [PubMed] [Google Scholar]
- Vandermolen KM, Cech NB, Paine MF, Oberlies NH. (2013) Rapid quantitation of furanocoumarins and flavonoids in grapefruit juice using ultra-performance liquid chromatography. Phytochem Anal 24:654–660 [DOI] [PMC free article] [PubMed] [Google Scholar]
- Williams JA, Hyland R, Jones BC, Smith DA, Hurst S, Goosen TC, Peterkin V, Koup JR, Ball SE. (2004) Drug-drug interactions for UDP-glucuronosyltransferase substrates: a pharmacokinetic explanation for typically observed low exposure (AUCi/AUC) ratios. Drug Metab Dispos 32:1201–1208 [DOI] [PubMed] [Google Scholar]
- Won CS, Oberlies NH, Paine MF. (2012) Mechanisms underlying food-drug interactions: inhibition of intestinal metabolism and transport. Pharmacol Ther 136:186–201 [DOI] [PMC free article] [PubMed] [Google Scholar]
- Wu B, Kulkarni K, Basu S, Zhang S, Hu M. (2011) First-pass metabolism via UDP-glucuronosyltransferase: a barrier to oral bioavailability of phenolics. J Pharm Sci 100:3655–3681 [DOI] [PMC free article] [PubMed] [Google Scholar]
- Zhu HJ, Brinda BJ, Chavin KD, Bernstein HJ, Patrick KS, Markowitz JS. (2013) An assessment of pharmacokinetics and antioxidant activity of free silymarin flavonolignans in healthy volunteers: a dose escalation study. Drug Metab Dispos 41:1679–1685 [DOI] [PMC free article] [PubMed] [Google Scholar]
Associated Data
This section collects any data citations, data availability statements, or supplementary materials included in this article.