

Summary
Multiple drug resistance, mediated by the expression and activity of ABC-transporters, is a major obstacle to antineoplastic therapy. Normal tissue stem cells and their malignant counterparts share MDR transporter activity as a major mechanism of self-protection. Although MDR activity is upregulated in response to substrate chemotherapeutic agents, it is also constitutively expressed on both normal tissue stem cells and a subset of tumor cells prior to the initiation of therapy, representing a built-in obstacle to therapeutic ratio. Constitutive and induced MDR activity can be detected in cellular subsets of disaggregated tissues, using the fluorescent substrates Rhodamine 123 and Hoechst 33342 for ABCB1 (also known as P-gp and MDR1) and ABCG2 (BCRP1). In this chapter, we will describe the complete procedure for the detection of MDR activity, including: (1) Preparing single-cell suspensions from tumor and normal tissue specimens; (2) An efficient method to perform cell surface marker staining on large numbers of cells; (3) Flow cytometer setup and controls; (4) Simultaneous measurement of Hoechst 33342 and Rhodamine123 transport; and (5) Data acquisition and analysis.
Keywords: Pre-existing multiple drug resistance, ABCB1 activity, ABCG2 activity, Hoechst 33342, Rhodamine 123, Epithelial tumors, Cancer stem cells, Flow cytometry
1. Introduction
1.1. MDR in Stem Cell
Multiple drug resistance (MDR) is mediated chiefly by a group of transmembrane transporter glycoproteins known as ATP-binding cassette (ABC) proteins. These energy-dependent cellular pumps are highly conserved in eukaryotes. Because they preferentially transport lipophilic cationic molecules, a single transporter can act on structurally dissimilar substrates. Biologically, they have been adapted to serve a wide variety of functions. In the central nervous system they are expressed by capillary endothelial cells, forming the blood brain barrier (1). In the gut they are expressed by villus tip enterocytes of the small intestine (2), limiting the bioavailability of substrate drugs. In stem cells, MDR transporters, principally ABCG2 (also known as breast cancer resistance protein 1 (BCRP1)) and ABCB1 (also known as P-glycoprotein (P-gp) and multiple drug resistance protein 1 (MDR1)), operate at the single cell level, rather than at the tissue level, excluding xenobiotics and other toxins and making stem cells among the most resilient cells in the body. ABC transporters may be constitutively expressed, as they are in some stem cell populations (3), or may be induced by exposure to substrate, as they are in memory T lymphocytes (4).
MDR activity can be detected and quantified by exclusion of fluorescent substrates. The association of constitutive MDR expression with normal tissue stem cells (sometimes called adult stem cells) was first demonstrated by Lansdorp, who showed that the most primitive hematopoietic cells could be isolated from the bone marrow (BM) by sorting for cells which excluded the lipophilic, cationic dye rhodamine 123 (5). Years later, this phenomenon was rediscovered by Goodell while sorting BM cells on the basis of DNA content (cell cycle). After staining BM cells with the membrane permeant DNA stain Hoechst 33342 she noted, in addition to the usual cell cycle populations, a very small population of viable cells which excluded the Hoechst dye. In very careful experiments, she determined that this population was highly enriched for cells capable of reconstituting hematopoiesis in radiation-ablated mice (3). She called these cells Side Population cells because of their location on the far left side of blue fluorescence vs. red fluorescence histograms. Today, Hoechst 33342 excluding cells are commonly referred to as side population cells. Such cells can be found in a wide variety of tissues, and the side population strategy has been useful for isolating cells with high regenerative capacity from hematopoietic (3, 5, 6), airway (7), pituitary (8), small intestine (9), and testicular (10) tissues. However, given the wide array of biological functions that ABC transporters serve, and the fact that they are sometimes induced in transporter-negative cells by substrate exposure, the caveat must be given that MDR expression does not unequivocally identify stem cells and conversely, its absence does not rule out the self-renewing capacity most characteristic of stemness.
1.2. MDR in Cancer
Multiple drug resistance transporters are so named because they were first discovered in the context of antineoplastic therapy (11). Their discovery solved the conundrum posed by the observation that cancer cells which developed resistance to a particular chemotherapeutic agent became simultaneously resistant to a wide variety of unrelated agents, including drugs with entirely different mechanisms of action. Today we know that MDR is constitutively expressed by a subset (usually a small subset) of neoplastic cells prior to treatment with substrate drugs. Treatment results in selection for drug excluding MDR active cells by a number of mechanisms, including regional gene activation (12), gene amplification (13), and modification of histone acetylation at the ABCG2 locus (14). Recently it has been suggested that MDR activity in some cancers is regulated by the hedgehog signaling pathway (15, 16), a key pathway in embryonic morphogenesis (17). Further, although the mechanism remains unclear, there are data linking MDR expression to radiation resistance (18).
MDR activity has been investigated in multiple types of cancer as a possible means of identifying the cancer stem cell. The vast majority of work has been done in cell lines, which have undergone generations of selection for characteristics favorable to in vitro growth in the absence of host- and therapy-mediated selective pressures. Not all tumorigenic cancer cell lines exhibit a side population. Investigators working with SP + cell lines derived from ovarian cancer (19), breast cancer (20), glioma (21), prostate (22), and thyroid cancer (23) all found enhanced tumorigenicity or in vitro clonogenicity in sorted side population cells. Harris et al. (21) and Mitsutake et al. (23) found that non-SP cells could give rise to SP cells. In contrast, Lichtenauer et al. found neither growth nor survival advantage in SP cells sorted from an adrenocortical carcinoma cell line (24). Our own data in primary breast cancer isolates support plasticity in MDR expression. Sorted CD44+ CD90+ ABCG2- breast cancer cells gave rise to heterogeneous tumors which included a subset of ABCG2+ cells when explanted to NOD/SCID mice (25). Therefore, the caveat given for normal stem cells, that MDR activity and stemness are not one in the same, holds for neoplastic cells as well (26). Although MDR activity is upregulated in response to substrate chemotherapeutic agents, it is also constitutively expressed on both normal tissue stem cells and a subset of tumor cells prior to the initiation of therapy (19, 25–27), representing a built-in obstacle to therapeutic ratio (28). The take-home message is that a cancer cell which is both self-renewing (i.e., tumorigenic) and protected by MDR transporters constitutes a very difficult therapeutic target, having much in common with normal tissue stem cells. Thus, detection and isolation of MDR active cells by simultaneous measurement of rhodamine 123 and Hoechst 33342 transport (29) represents an important tool for investigation of those cancer cells capable of therapy resistance, dormancy, and reactivation.
2. Materials
Tissue requirement 1 g minimum.
60-mm Petri dishes Falcon (PL-056).
BD Bard-Parker protected disposal scalpel, blade#10 (Fisher 02-688-78).
-
Collagenase/DNAase solution in PBS with calcium and magnesium.
Collagenase type I (Sigma C0130), 0.4% final concentration.
DNAse (Sigma D-5025-750KU), 350 kU/mL final concentration.
50-mL Polypropylene conical tube, Falcon (Fisher 14-959-49A).
DMEM 1×, high glucose, SuperCase (Invitrogen 11965-118).
Cell strainer, 70-μm nylon, 26-mm diameter (Becton Dickinson 352350).
Cellector (TM) tissue sieve kit, 130 mL with pan, glass pestle, and screens (Bellco 205020).
Newborn calf serum (Atlanta Biologicals S11210).
Phosphate-buffered saline without calcium or magnesium (PBS-A, Sigma D5652).
PBS with CaCl2 and MgCl2 (PBS, Sigma D8662).
-
Ammonium chloride lysing solution 10× (500 mL).
41.5 g Ammonium chloride.
5.0 g Potassium bicarbonate.
400 mL Glass distilled water.
pH to 7.2–7.4 with 1 M HCl or NaOH as needed.
QS to 500 mL with distilled water.
Dilute with distilled water to 1× prior to use.
Hemacytometer (VWR Scientific 48312-002).
Trypan Blue (Sigma T8154).
Histopaque (Sigma 10771).
10-mL Pipettes, Falcon (Fisher 13-675-20).
15-mL polypropylene conical, Falcon (Fisher 14-959-70C).
Mouse serum (Sigma M5905).
Microcentrifuge tube, 1.5 mL (Eppendorf Fisher 05-402-25).
L-Glutamine Gibco 25030-081.
2-ME (Fisher BP176-100).
HEPES buffer (Sigma H-3375).
Rhodamine 123(Calbiochem 001004).
Hoechst 33342 (Molecular Probes H-3570).
Verapamil (Sigma V-4629).
Cyclosporin A (Sigma C1832).
Fumitremorgin C (Alexis Biochemicals 350-127-C250).
Vincristine (Sigma V8879).
Propidium Iodide (Sigma P-4170).
70-μm Filter cap tubes, 12 × 75 (Fisher 08-771-23).
CompBead Antimouse Ig, κ (BD 552843).
SpectrAlign beads (DAKO, Cat. No. KO111).
8-Peak Rainbow Calibration Particles (Spherotech, Libertyville, IL, Cat. No. RCP-30-5A).
Calibrite beads (PE) (BD 349502).
Calibrite (APC) (BD 340487).
3. Methods
3.1. Tissue Collection and Digestion
Place tissue into a tared 60-mm Petri dish.
If desired remove a small piece for histology (paraffin and OCT embedding).
Record the weight of remaining tissue.
Finely mince using sterile paired scalpels. Add a few drops of collagenase/DNase solution while mincing to prevent tissue from drying (Fig. 1).
Place a 70-μm cell strainer in the mouth of a 50-mL polypropylene conical tube labeled “Filtrate.”
Using a scalpel, a 10-mL pipette and PBS-A plus 2% calf serum (PBS-A-CS), transfer all tissue into the cell strainer. Repeat until all tissue fragments have been removed from the Petri dish, pipetting PBS-A-CS vigorously against the cell strainer to release individual cells (see Notes 1 and 2).
Bring volume of Filtrate tube to 50 mL with PBS-A-CS, centrifuge at 400 × g for 10 min, and discard supernatant. Resuspend in 2 mL PBS-A-CS and hold on ice.
Using a scalpel, transfer minced tissue in the strainer to an additional 50-mL polypropylene conical tube containing 10 mL collagenase/DNase solution. Label “Digest.”
Place Digest tube in shaking waterbath (e.g., Bellydancer, Stovall Life Science) at 37°C for 30 min, maximum agitation setting.
Place a new 70-μm cell strainer in the mouth of the conical tube labeled Filtrate.
Using a 10-mL pipette, transfer material from the Digest tube into the cell strainer on the Filtrate tube.
Add 10 mL PBS-A-CS to the Digest tube and transfer any remaining tissue to the cell strainer. Repeat if necessary.
Using a scalpel, transfer the undigested material from the cell strainer back into the Digest tube.
Add 10 mL collagenase/DNase solution and return Digest tube to the shaking 37°C waterbath for 30 min.
Bring volume of Filtrate tube to 50 mL with PBS-A-CS, centrifuge at 400 × g for 10 min, and discard supernatant. Resuspend in 2 mL PBS-A-CS and hold on ice.
Repeat steps 10 and 11.
Discard strainer from Filtrate tube.
Bring volume of Filtrate tube to 50 mL with PBS-A-CS, centrifuge at 400 × g for 10 min, and discard supernatant.
Add 45 mL of 1× NH4Cl lysing solution and mix (see Note 3).
Centrifuge at 400 × g for 10 min at room temperature.
Pour off the supernatant, and loosen cell pellet.
Resuspend in 40 mL PBS-A-CS.
Centrifuge at 400 × g for 10 min at room temperature.
Resuspend in 2 mL PBS with calcium and magnesium plus 2% calf serum and hold on ice (see Note 4).
Count cells on a hemacytometer (Tuerk’s solution to eliminate RBC, Trypan blue for viability) (30).
Fig. 1.

Preparation of normal breast tissue and breast tumor for digestion. Freshly excised normal breast tissue (a, left) and breast tumor (a, right) was transported in ice-cold tissue culture medium and transferred to 60-mm Petri dishes. The tissue was minced into fine fragments using paired scalpels (b). A few drops of collagenase/DNase were added to the minced tissue to prevent drying and clumping. PBS-A is added to the Petri dish (c) and carefully pipetted through a cell strainer into a 50-mL conical tube (d, Filtrate). Tissue remaining in the strainer is digested with collagenase/DNase and the process is repeated as necessary.
3.2. Extracellular Staining
Pellet cells at 400 × g for 10 min at 4°C. Discard supernatant.
Resuspend cell pellet in 5 μL neat decomplemented (56°C, 30 min) mouse serum (see Note 5).
Pellet cells (400 × g, 10 min) and aspirate residual supernatant (see Note 6).
Stain the dry pellet for surface markers by the addition of 2 μL of each monoclonal antibody.
-
Add 2μL antibodies in the following order (see Note 7):
EpCAM-APC (Miltenyi Biotech, Bergisch Gladbach, Germany, Cat. No. 12000420)
CD90-PE (Beckman Coulter, Cat. No. IM1840)
CD45-APCCy7 (BD, Cat. No. 557833)
(see Note 8).
Incubate for 30 min on ice in the dark.
Dilute surface stained cell pellets in DMEM medium containing 10% calf serum, L-glutamine (2 mM), and 2-beta mercaptoethanol (50 μM) to a concentration of 2 × 10⁶ cells/mL (see Note 9).
3.3. Simultaneous Measurement of Hoechst 33342 and Rhodamine 123 Dye Transport (Fig. 2)
Fig. 2.

Simultaneous detection of Ho33342 and R123 transport. Flow cytometry was performed on the parental cell line K562 (bottom panels, human erythroleukemia) and the MDR1 transfectant K562-G185 (top panels). A gating strategy was used to analyze only singlet viable cells. Monoclonal antibody staining on separate aliquots revealed that parental K562 cells were ABCB1 (MDR1) negative and expressed a very small subpopulation of ABCG2+, low side scatter cells (0.08% of viable cells, top right). In contrast, the transfectant line K562-G158, which is maintained in the presence of 100 ng/mL vincristine, is uniformly positive for ABCB1, and expresses a small subpopulation of ABCG2+ cells identical to that of the parent cell line. Both cell lines were coincubated with Ho33342 and R123 in the absence and presence of MDR inhibitors. In the absence of inhibitors, only a minor subpopulation within the parental K562 exhibited the SP phenotype (3.36%), whereas almost all K562-G185 (ABCB1 transfected) cells transported Ho33342 (71% SP). Addition of 5 μM cyclosporin A (CsA) abrogated transport in both cell lines. Vincristine had no effect on either cell line, whereas the ABCG2 specific inhibitor, fumitremorgin (1 μM), only inhibited Ho33342 transport in parental K562 (native ABCG2 mediated transport) and had no effect on Ho33342 transport through ABCB1. Verapamil (50 μM, a MDR nonspecific inhibitor) blocked SP phenotype in both cell lines. R123 transport was limited to cells with ABCB1 expression (K562-G185 only), the parental K562 had no constitutive ABCB1 activity or expression. The R123 dull phenotype was reversed by the addition of either CsA or verapamil but was not blocked by the addition of ABCG2-specific inhibitor fumitremorgin.
3.3.1. Dye Loading in the Presence and Absence of Inhibitors
Load surface stained cells for 90 min at 37°C with 0.13 μM R123 and 8.12 μM Ho33342 in the absence and presence of inhibitors (Table 1, see Notes 10–12).
When the incubation is complete, wash the cells once (400 × g, 10 min) with ice-cold PBS-A-CS and resuspend to 5–10 × 10 6 cells/mL in ice cold PBS-A 10% CS (see Note 13).
Add Propidium Iodide, 10 μg/mL final concentration, as a viability dye (see Note 14).
Strain cells immediately prior to flow cytometric acquisition through a 70-μm cap filter.
Table 1.
Characteristics of common MDR inhibitors
| Inhibitor | Vehicle | [Final concentration] | Notes |
|---|---|---|---|
| Vehicle controls (EtOH and DMSO) | Not applicable | 1/1,000 | |
| Verapamil | PBS-A | 50 μM | Competitive MDR inhibitor |
| CsA | EtOH | 5 μM | Potent dead end MDR inhibitor |
| Fumitremorgin | DMSO | 10 μM | Highly specific ABCG2 inhibitor |
| Vincristine | PBS-A | 1 μg/mL | Used to maintain ABCB1 expression in transfected cells |
3.3.2. Instrument Setup and MDR Standards
IgG Capture Bead Staining
Vortex CompBeads thoroughly before use (see Note 15).
Label a separate 1.5-mL Eppendorf tube for each mouse monoclonal antibody conjugated to a tandem dye (e.g., ECD, PE-Cy5, PE-Cy7, and APC-Cy7).
Add one full drop (approximately 60 μL) of antimouse Ig CompBeads to each Eppendorf tube.
Centrifuge for 10 min at 400 × g. Carefully aspirate supernatant to ensure a “dry pellet” (see Note 16).
Sonicate each tube for 10 s in a water bath sonicator (see Note 17).
Add 2 μL of each antibody directly to beads (one antibody per tube) and gently reflux.
Incubate for 15 min at room temperature in the dark (see Note 18).
Add 1 μL of mouse serum; incubate 5 min at room temperature (see Note 19).
Add 100 μL of staining buffer and reflux.
Sonicate each tube for 10 s.
Add 1 mL of staining buffer. For manual compensation, add one drop of negative CompBeads to each test tube that contains antibody stained beads (see Note 20).
Centrifuge beads for 10 min at 400 × g; decant and carefully blot to remove residual supernatant (see Note 21).
Resuspend washed beads in 0.5 mL of staining buffer.
Transfer to 12 × 75 mm snap cap tubes for flow cytometry.
Sonicate for 10 s prior to acquisition on the flow cytometer.
Instrument Setup and Sample Acquisition
We use an eight-color MoFlo cell sorter equipped with ultraviolet, 488 and 633 nm lasers and an automated sample station capable of holding the sample at 4°C (Beckman Coulter, Fort Collins, CO). Other similarly equipped cytometers may be used. The filters used for each fluorescence channel are shown in Fig. 3 (see Note 22).
The cytometer is calibrated to predetermined photomultiplier target channels prior to each use using SpectrAlign beads (DAKO, Cat. No. KO111) and 8-peak Rainbow Calibration Particles (Spherotech, Libertyville, IL, Cat. No. RCP-30-5A) (see Note 23).
All fluorescence parameters are collected in the logarithmic mode, with the exception Hoechst 33342 emissions (blue and red) which are collected in the linear mode (see Note 24).
PMT settings for the two Hoechst channels must be fine tuned empirically for each sample because data are acquired in a linear mode and because fluorescence intensity varies with the total DNA per sample. For initial settings it is a great help to calibrate with cells having a known side population (see Notes 10 and 22), adjusting PMT gain until the G1/G0 peak is comfortably placed in the upper right third of the Hoechst Red by Hoechst Blue histogram (Fig. 3). For the side population itself, blue fluorescence intensity should be slightly greater than red fluorescence intensity, displacing the side population slightly upward on the histogram (31).
Acquire unstained cells or beads first, and then each single stained sample (bead or cells) from the shortest emission wavelength (R123 stained cells) to the longest (e.g., CD45 APCCy7).
Calculate the compensation matrix from single stained tubes using automated software (supplied with most new cytometer software and all offline analysis packages).
Prior to running Ho33342/R123 loaded cells, minimal logical gating is performed in order to eliminate cellular clumps (doublets) (32), subcellular debris (forward scatter threshold), and PI+ dead and dying cells (Figs. 4 and 5) MDR transfected reference cells (see Note 12) are particularly useful for this purpose.
Acquire Ho33342/R123 loaded cells, modifying “Hoechst red 670/20” and “Hoechst blue 450/65” PMT voltage so that nontransporting/non-SP cells with 2N DNA content are visualized in the last third of the Hoechst red 670/20 vs. Hoechst blue 450/65 histogram.
Acquire tumor/tissue cell suspensions loaded in the absence and presence of inhibitors (Table 1, see Note 25).
Fig. 3.

Three-laser filter configuration to measure side population plus six additional fluorochromes. Routine analysis and sorting of SP cells is performed on the MoFlo cell sorter by using the 488-nm laser line as a primary exciter of FITC, PE, and PE tandem dyes. The 488 line is also used to provide forward (FSC) and side scatter (SSC) signals. Multiline UV is used to excite Hoechst 33342 for SP detection. An additional 633-nm laser is used to excite APC and APC tandem dyes. The MoFlo allows the operator to direct individual lines toward specific detector arrays on the Detection Table, as illustrated in the figure (upper left). The convergence of the three lasers on the sample stream (top view) and the paths of forward and side scattered light are shown in the lower right.
Fig. 4.
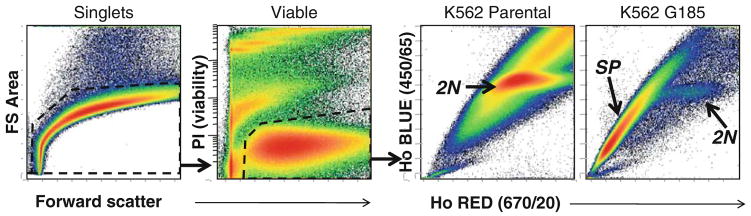
Instrument set up for Hoechst 33342 detection using cell lines as process controls. Parental K562 and ABCB1-transfected K562-G185 cells were used as low-negative and positive controls, respectively. A gating strategy was used to restrict analysis to singlet viable (PI negative) cells. Approximately 650,000 viable singlet events were acquired for both samples. The majority of parental K562 had no Ho33342 transport. The majority of events had uniform Ho33342 fluorescence in both blue and red detection PMTs, representing cells with 2N DNA. Almost all ABCB1 transfected cells transported Ho433342 and therefore exhibited the side population (SP) phenotype, with greater blue than red fluorescence. Only a small minority of K562-G185 cells failed to transport Ho33342 and therefore had fluorescence intensities characteristic of 2N DNA cells.
Fig. 5.
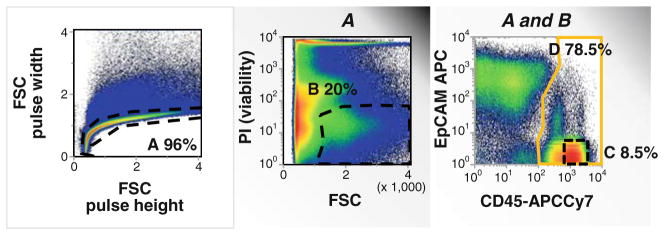
Gating strategy to eliminate doublets, nonviable cells, and hematopoietic lineage positive events. Enzymatically and mechanically digested nonsmall-cell lung carcinoma was stained for the expression of surface CD45 and EpCAM (CD326); propidium iodide was added and cells were passed through a 70-μM filter immediately prior to acquisition. Singlet cells were identified on a 2-parameter histogram of forward scatter (FSC) pulse height vs. FSC pulse width (A). Viable cells which are impermeable to propidium iodide (PI) were identified (center histogram, B). Viable singlet cells were analyzed for the expression of CD45 (common leukocyte antigen, D) and the epithelial surface antigen EpCAM. CD45 bright/EpCAM-negative events were identified as lymphocytes (D) for use as a 2N DNA standard.
3.4. Data Analysis
We perform data analysis offline, using VenturiOne software (Applied Cytometry) which has been designed to accommodate very large datafiles. We create an analysis template into which we load our spectrally compensated data. Our strategy usually proceeds in three steps:
First we eliminate sources of interference with logical gates. These include cell-cell doublets and clusters, subcellular debris, and dead cells (Fig. 5).
Next we decide on our classifier parameters. In this example CD45 expression (rt. 5) serves as a primary classifier, and Hoechst dye exclusion (Fig. 6) is a secondary (branching) classifier.
Next outcomes, parameters to be measured on each population defined by the classifiers, are determined. In this case (Fig. 6) the outcome variables are R123 dye efflux, CD90 and EpCAM expression, and light scatter (see Note 26).
Lymphocytes are often present in tumor specimens and are identifiable by bright CD45 expression and low light scatter (Fig. 5). Since virtually none of these cells transports Hoechst 33342, the dye reaches the nucleus, where it binds to DNA stoichiometrically. The great majority of lymphocytes have 2N DNA content, but a distinct population of cycling cells can also be seen (Fig. 7). A population with very low blue and red fluorescence is often present as a source of artifact in digested tissue (Fig. 8). These acellular events have sufficient light scatter to trigger the cytometer to acquire a pulse, but have no DNA content (which also prevents them from being eliminated by PI staining). Another potential source of artifact is cells with laddered DNA (Fig. 8), the result of apoptosis-induced endonuclease release. The feature which distinguished them from bona fide side population cells is that cells with degraded DNA lie on the blue/red diagonal, whereas side population cells have greater blue than red fluorescence and are therefore slightly above the diagonal.
There is some confusion in the literature concerning the specificity of the side population, with early reports attributing the side population exclusively to cells expressing the ABCG2 transporter. Figure 2 shows results obtained with K562 cells (parent) and cells transfected with an ABCB1 vector (K562 G185). Surface staining with anti-ABCB1 (UIC2) and anti-ABCG2 antibodies (see Note 27), and real-time PCR performed on these cells (not shown) confirmed that both cell lines had low ABCG2 expression but that only the transfect-ant had detectable ABCB1. The Instrument was set up using parental and ABCB1 transfected cell lines and presence of a battery of inhibitors. Two important points emerge from the analysis: (1) Both ABCG2 (parental and transfected) and ABCB1 (transfected only) mediate Hoechst 33342 transport and therefore confer the side population phenotype; (2) The transporters responsible for the side population and R123 dull phenotypes may be inferred from inhibitor studies. Fumitremorgin, an exquisitely specific inhibitor of ABCG2, abrogated the side population phenotype in parental cells, but not in ABCB1 transfectants.
Fig. 6.

Functional and phenotypic characterization of “side population” cells. Freshly isolated lung cancer cells (CD45- viable singlets) were divided into Ho33342 excluding (F) and retaining (G) populations. Rhodamine 123 (R123) exclusion and the surface expression of EpCAM, CD90 (Thy1) and light scatter properties (FSC, SSC) were evaluated. Side population cells (top panels) cotransported R123 (15.4%). Cells which cotransported Ho33342 and R123 were mostly EpCAM negative/CD90- and had low light scatter comparable to resting lymphocytes. Nonside population cells, which did not transport R123, were of mixed surface phenotype (EpCAM/CD90) and were predominantly (97.2%) large cells with high light scatter.
Fig. 7.
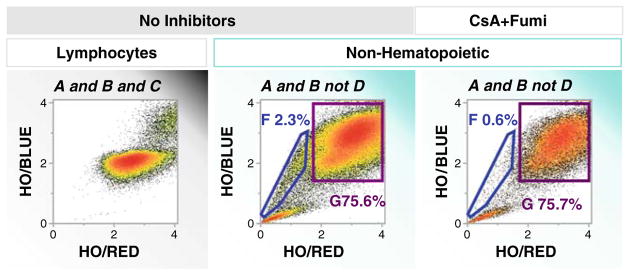
Identification of “side population” cells by Ho33342 transport in freshly digested tumor tissue. Events were gated as shown in Fig. 5. Lymphocytes identified as CD45bright/EpCAM negative (Fig. 5) were largely homogeneous for Ho33342 uptake and DNA staining (2N, left histogram); no “side population” was detected. Nonhematopoietic (CD45-) cells evidenced a significant “side population” accounting for 2.3% of events (center histogram). Cells with 2N and >2N DNA content (non-Ho33342 transporting cells) comprised the majority of cells. Abrogation of the “side population” (right histogram) by the addition of MDR inhibitors cyclosporine and fumitremorgin confirms that Ho33342 elimination is mediated by MDR transporters.
Fig. 8.

Interpretation of Ho33342 exclusion histograms. Cells are permeant to the DNA-binding dye Ho33342. In the absence of constitutively active MDR transport, Ho33342 concentrates in the nucleus and binds to the DNA, resolving 2N and 4N populations (top histogram). DNA-bound Ho33342 autoquenches, shifting emission toward the red. Side population cells, which do not permit accumulation of Ho33342 in the nucleus, exhibit greater blue than red fluorescence, placing them above the diagonal (center histogram). Events in the lower left-hand corner are not Ho33342 transporting cells, but rather events that triggered on FSC but lack DNA. Another commonly seen artifact is illustrated in the bottom histogram. The diagonal streak exhibits equal red and blue fluorescence and represents cells with degraded DNA, as is seen in early apoptotic cells. In this example, the diagonal streak was not abrogated by the addition of MDR inhibitors.
Acknowledgments
The authors would like to thank Melanie Pfeifer and Amber McCauslin for technical assistance. This work was supported by grants BC032981 and BC044784 from the Department of Defense, the Hillman Foundation, and the Glimmer of Hope Foundation. Vera Donnenberg is a CDMRP Era of Hope Scholar.
Footnotes
If material appears slimy this indicates DNA release. Add a few drops of DNase/collagenase solution and continue. DNAse activity is measured in Kunitz units. DNase is necessary because cells that are killed during the disaggregation procedure release viscous DNA strands which entrap live cells.
Occasionally, tumors are too sclerotic for the minced pieces to be disaggregated through a nylon cell strainer. In these cases we substitute a stainless tissue sieve with a 10-mesh screen overlayed with a 100-mesh screen. Tissue fragments are forced through the screen with a glass pestle (see Subheading 2).
Treatment with ammonium chloride lyses red blood cells. This step may be omitted if sample is not visually contaminated with red blood cells.
DNase requires Ca2+ or Mg2+ for its activity.
Addition of mouse serum, which contains mouse immunoglobulins, blocks nonspecific binding of murine monoclonal antibodies.
We refer to this as a dry the pellet elsewhere in the protocol. Cells pelleted in a 15-mL conical tube and aspirated dry actually contain anywhere from 10 to 50 μL of residual liquid.
The choice of antibodies and fluorochromes is specific to the question being addressed and the available instrumentation, and can be modified at will. The order of antibody addition may influence staining as binding occurs very rapidly, and sequential addition of many antibodies progressively reduces the concentration of individual antibodies in the mixture (26, 33).
We have found the following antibodies useful for subsetting MDR+tumorcells:CD44-PECy7(Abcam,Cat.No.AB46793), CD14-PECy5 (Beckman Coulter, Cat. No. IM2640U), CD33-PECy5 (Beckman Coulter, Cat. No. IM2647U), glycophorin A-PECy5 (Becton Dickinson, Cat. No. 559944). CD44 has been used by many investigators to identify tumorigenic cancer cells (34). Anti-CD14, anti-CD33, and antiglycophorin A (hematopoietic markers) are all labeled with the same fluorochrome and collectively will serve as a dump gate during data analysis. This means that all positive events within the dump gate will be eliminated from the analysis.
Prewarm medium to 37°C. The medium formulation is not important and others may be substituted. Medium must contain serum, calcium, magnesium, and glucose and be buffered to an appropriate pH. Antimicrobials, especially and antifungal agents, should be avoided as some are MDR substrates.
Make all inhibitors at 1,000× final concentration to avoid adding an excessive amount of the vehicle (EtOH for cyclosporine).
Prepare tubes with inhibitors ahead of time and transfer cells immediately after the addition of R123 and Ho33342.
It is useful, especially when first establishing this assay, to use reference cell lines known to express MDR activity. We use the chronic myelogenous leukemia cell line K562 (low MDR activity) and K562 cells transfected with the ABCB1 vector G185 (very high MDR activity) (35) as process controls (Fig. 4), incubated in the absence and presence of inhibitors (Fig. 2). The G185 transfectants were kindly provided by Dr. Suresh Ambudkar.
Keep on ice under aluminum foil until acquisition; maximum wait time before acquisition is 1 h. Holding cells longer will result in loss of side population cells.
Viable cells exclude PI. PI stains dead and dying cells very brightly and facilitates their removal from the analysis. Since it is broadly fluorescent, PI-positive cells must be removed from the analysis with a logical gate (Fig. 4).
Single stained compensation standards are essential for correct spectral compensation. We find it best to use peripheral blood mononuclear cells incubated with rhodamine 123 (per earlier protocol) for the FL1 standard, integrally stained Calibrite beads for PE and APC, and Ig capture beads (Comp-Beads) for antibodies conjugated to tandem dyes. Hoechst 33342 staining does not require spectral compensation. It should be noted that R123, which is acquired with the same filter as is used for FITC (530/40 BP), has more spillover into the PE channel than FITC and therefore requires more spectral compensation.
Beads do not pack as tightly as cells, so care must be taken not to aspirate the beads.
Sonication is not essential but is very useful because it disaggregates bead clumps better than vortexing or refluxing.
Tandem dyes are easily degraded by exposure to light. Reagents, stained cells, and stained beads must be carefully protected from ambient light. We perform staining in an unilluminated biological safety cabinet, and cover stained cells and beads with aluminum foil to minimize light exposure.
Addition of mouse serum prevents clumping of beads due to antibody crosslinking.
Negative beads are not required for some automated compensation algorithms, such as those implemented on Beckman-Coulter instruments or in VenturiOne software.
Decanting and blotting must be done in one smooth motion to prevent loss of beads.
The sample station is prechilled and kept at 4°C during the entire acquisition.
Determining balanced PMT settings is an art in itself and has been addressed by us elsewhere (32). Once these settings have been established, and bead target channels have been determined, they can be reproduced from experiment to experiment by adjusting PMT voltage to place the brightest peak of the Rainbow particles in the predetermined target channel. The intensity of Hoechst 33342 staining will vary from specimen to specimen, because it is measured on a linear scale and is highly dependent on the total amount of DNA in the sample. PMT voltages for the Hoechst Red and Blue channels are adjusted for each sample to place the median fluorescence of the 2N population at about channel 192 (of 255) (Fig. 4).
Our MoFlo is an analog model in which log or linear modes of amplification are user selected. Newer digital flow cytometers use high-resolution linear amplification exclusively and logarithmic transformations are performed mathematically.
CD45- Lin- CD44+ side population cells may be very rare events. We routinely acquire 10 million events per sample at rates not exceeding 10,000 events/second, to assure sufficient cells for subset analysis.
Which parameters are used to define classifiers, and which define outcomes is somewhat plastic and depends on the goal of the analysis. For example, one could classify cells into several populations on the basis of CD90 and EpCAM expression and then look at dye efflux as an outcome. The classifier/outcome strategy has the advantages of focusing the analysis and avoiding the all possible permutations problem inherent in multiparameter data files.
These antibodies interfere with transporter activity and cannot be used with dye transport assays.
References
- 1.Schinkel AH, Mol CA, Wagenaar E, van Deemter L, Smit JJ, Borst P. Multidrug resistance and the role of P-glycoprotein knockout mice. Eur J Cancer. 1995;31A:1295–1298. doi: 10.1016/0959-8049(95)00130-b. [DOI] [PubMed] [Google Scholar]
- 2.Benet LZ, Izumi T, Zhang Y, Silverman JA, Wacher VJ. Intestinal MDR transport proteins and P-450 enzymes as barriers to oral drug delivery. J Control Release. 1999;62:25–31. doi: 10.1016/s0168-3659(99)00034-6. [DOI] [PubMed] [Google Scholar]
- 3.Goodell MA, Brose K, Paradis G, Conner AS, Mulligan RC. Isolation and functional properties of murine hematopoietic stem cells that are replicating in vivo. J Exp Med. 1996;183:1797–1806. doi: 10.1084/jem.183.4.1797. [DOI] [PMC free article] [PubMed] [Google Scholar]
- 4.Donnenberg VS, Burckart GJ, Zeevi A, et al. P-glycoprotein activity is decreased in CD4+ but not CD8+ lung allograft-infiltrating T cells during acute cellular rejection. Transplantation. 2004;77:1699–1706. doi: 10.1097/01.tp.0000131163.43015.85. [DOI] [PubMed] [Google Scholar]
- 5.Udomsakdi C, Eaves CJ, Sutherland HJ, Lansdorp PM. Separation of functionally distinct subpopulations of primitive human hematopoietic cells using rhodamine-123. Exp Hematol. 1991;19:338–342. [PubMed] [Google Scholar]
- 6.Chaudhary PM, Roninson IB. Expression and activity of P-glycoprotein, a multidrug efflux pump, in human hematopoietic stem cells. Cell. 1991;66:85–94. doi: 10.1016/0092-8674(91)90141-k. [DOI] [PubMed] [Google Scholar]
- 7.Giangreco A, Shen H, Reynolds SD, Stripp BR. Molecular phenotype of airway side population cells. Am J Physiol Lung Cell Mol Physiol. 2004;286:L624–L630. doi: 10.1152/ajplung.00149.2003. [DOI] [PubMed] [Google Scholar]
- 8.Chen J, Hersmus N, Van Duppen V, Caesens P, Denef C, Vankelecom H. The adult pituitary contains a cell population displaying stem/progenitor cell and early embryonic characteristics. Endocrinology. 2005;146:3985–3998. doi: 10.1210/en.2005-0185. [DOI] [PubMed] [Google Scholar]
- 9.He DN, Qin H, Liao L, et al. Small intestinal organoid-derived SP cells contribute to repair of irradiation-induced skin injury. Stem Cells Dev. 2005;14:285–291. doi: 10.1089/scd.2005.14.285. [DOI] [PubMed] [Google Scholar]
- 10.Riou L, Bastos H, Lassalle B, et al. The telomerase activity of adult mouse testis resides in the spermatogonial alpha6-integrin-positive side population enriched in germinal stem cells. Endocrinology. 2005;146:3926–3932. doi: 10.1210/en.2005-0502. [DOI] [PubMed] [Google Scholar]
- 11.Ling V, Thompson LH. Reduced permeability in CHO cells as a mechanism of resistance to colchicine. J Cell Physiol. 1974;83:103–116. doi: 10.1002/jcp.1040830114. [DOI] [PubMed] [Google Scholar]
- 12.Wang YC, Juric D, Francisco B, et al. Regional activation of chromosomal arm 7q with and without gene amplification in taxane-selected human ovarian cancer cell lines. Genes Chromosomes Cancer. 2006;45:365–374. doi: 10.1002/gcc.20300. [DOI] [PubMed] [Google Scholar]
- 13.Chen GK, Lacayo NJ, Duran GE, et al. Preferential expression of a mutant allele of the amplified MDR1 (ABCB1) gene in drug-resistant variants of a human sarcoma. Genes Chromosomes Cancer. 2002;34:372–383. doi: 10.1002/gcc.10067. [DOI] [PubMed] [Google Scholar]
- 14.Calcagno AM, Fostel JM, To KK, et al. Single-step doxorubicin-selected cancer cells overexpress the ABCG2 drug transporter through epigenetic changes. Br J Cancer. 2008;98:1515–1524. doi: 10.1038/sj.bjc.6604334. [DOI] [PMC free article] [PubMed] [Google Scholar]
- 15.Sims-Mourtada J, Izzo JG, Ajani J, Chao KS. Sonic Hedgehog promotes multiple drug resistance by regulation of drug transport. Oncogene. 2007;26:5674–5679. doi: 10.1038/sj.onc.1210356. [DOI] [PubMed] [Google Scholar]
- 16.Peacock CD, Wang Q, Gesell GS, et al. Hedgehog signaling maintains a tumor stem cell compartment in multiple myeloma. Proc Natl Acad Sci U S A. 2007;104:4048–4053. doi: 10.1073/pnas.0611682104. [DOI] [PMC free article] [PubMed] [Google Scholar]
- 17.Lum L, Beachy PA. The Hedgehog response network: sensors, switches, and routers. Science. 2004;304:1755–1759. doi: 10.1126/science.1098020. [DOI] [PubMed] [Google Scholar]
- 18.Johnstone RW, Ruefli AA, Tainton KM, Smyth MJ. A role for P-glycoprotein in regulating cell death. Leuk Lymphoma. 2000;38:1–11. doi: 10.3109/10428190009060314. [DOI] [PubMed] [Google Scholar]
- 19.Szotek PP, Pieretti-Vanmarcke R, Masiakos PT, et al. Ovarian cancer side population defines cells with stem cell-like characteristics and Mullerian Inhibiting Substance responsiveness. Proc Natl Acad Sci U S A. 2006;103:11154–11159. doi: 10.1073/pnas.0603672103. [DOI] [PMC free article] [PubMed] [Google Scholar]
- 20.Patrawala L, Calhoun T, Schneider-Broussard R, Zhou J, Claypool K, Tang DG. Side population is enriched in tumorigenic, stem-like cancer cells, whereas ABCG2+ and ABCG2- cancer cells are similarly tumorigenic. Cancer Res. 2005;65:6207–6219. doi: 10.1158/0008-5472.CAN-05-0592. [DOI] [PubMed] [Google Scholar]
- 21.Harris MA, Yang H, Low BE, et al. Cancer stem cells are enriched in the side population cells in a mouse model of glioma. Cancer Res. 2008;68:10051–10059. doi: 10.1158/0008-5472.CAN-08-0786. [DOI] [PMC free article] [PubMed] [Google Scholar]
- 22.Patrawala L, Calhoun-Davis T, Schneider-Broussard R, Tang DG. Hierarchical organization of prostate cancer cells in xenograft tumors: the CD44+ alpha2beta1+ cell population is enriched in tumor-initiating cells. Cancer Res. 2007;67:6796–6805. doi: 10.1158/0008-5472.CAN-07-0490. [DOI] [PubMed] [Google Scholar]
- 23.Mitsutake N, Iwao A, Nagai K, et al. Characterization of side population in thyroid cancer cell lines: cancer stem-like cells are enriched partly but not exclusively. Endocrinology. 2007;148:1797–1803. doi: 10.1210/en.2006-1553. [DOI] [PubMed] [Google Scholar]
- 24.Lichtenauer UD, Shapiro I, Geiger K, et al. Side population does not define stem cell-like cancer cells in the adrenocortical carcinoma cell line NCI h295R. Endocrinology. 2008;149:1314–1322. doi: 10.1210/en.2007-1001. [DOI] [PubMed] [Google Scholar]
- 25.Donnenberg VS, Luketich JD, Landreneau RJ, DeLoia JA, Basse P, Donnenberg AD. Tumorigenic epithelial stem cells and their normal counterparts. Ernst Schering Found Symp Proc. 2006;5:245–263. doi: 10.1007/2789_2007_054. [DOI] [PubMed] [Google Scholar]
- 26.Donnenberg VS, Landreneau RJ, Donnenberg AD. Tumorigenic stem and progenitor cells: implications for the therapeutic index of anti-cancer agents. J Control Release. 2007;122:385–391. doi: 10.1016/j.jconrel.2007.05.005. [DOI] [PMC free article] [PubMed] [Google Scholar]
- 27.Lou H, Dean M. Targeted therapy for cancer stem cells: the patched pathway and ABC transporters. Oncogene. 2007;26:1357–1360. doi: 10.1038/sj.onc.1210200. [DOI] [PubMed] [Google Scholar]
- 28.Donnenberg VS, Donnenberg AD. Therapeutic index and the cancer stem cell paradigm. In: Bagley R, Teicher B, editors. Stem Cells and Cancer Series: Cancer Drug Discovery and Development. New York: Springer, Humana Press; 2009. [Google Scholar]
- 29.Bertoncello I, Williams B. Hematopoietic stem cell characterization by Hoechst 33342 and rhodamine 123 staining. Methods Mol Biol. 2004;263:181–200. doi: 10.1385/1-59259-773-4:181. [DOI] [PubMed] [Google Scholar]
- 30.Turgeon ML. Clinical hematology: theory and procedures. 4. Philadelphia, PA: Lippincott Williams & Wilkins; 2005. [Google Scholar]
- 31.Ibrahim SF, Diercks AH, Petersen TW, van den Engh G. Kinetic analyses as a critical parameter in defining the side population (SP) phenotype. Exp Cell Res. 2007;313:1921–1926. doi: 10.1016/j.yexcr.2007.02.025. [DOI] [PubMed] [Google Scholar]
- 32.Donnenberg AD, Donnenberg VS. Understanding clinical flow cytometry. In: O’Gorman MR, Donnenberg AD, editors. Handbook of Human Immunology. 2. Boca Raton: CRC Press Taylor and Francis; 2008. pp. 181–220. [Google Scholar]
- 33.Donnenberg AD, Donnenberg VS. Rare-event analysis in flow cytometry. Clin Lab Med. 2007;27:627–652. doi: 10.1016/j.cll.2007.05.013. [DOI] [PubMed] [Google Scholar]
- 34.Al-Hajj M, Wicha MS, Benito-Hernandez A, Morrison SJ, Clarke MF. Prospective identification of tumorigenic breast cancer cells. Proc Natl Acad Sci U S A. 2003;100:3983–3988. doi: 10.1073/pnas.0530291100. [DOI] [PMC free article] [PubMed] [Google Scholar]
- 35.Kane S, Reinhard D, Fordis M, Pastan I, Gottesman M. A new vector using the multiple drug resistance gene as a selectable marker enables overexpression of foreign genes in eukaryotic cells. Gene. 1989;84:439–446. doi: 10.1016/0378-1119(89)90518-0. [DOI] [PubMed] [Google Scholar]