Abstract
Introduction:
Measurement tools designed to ensure the achievements of studies’ objectives must be evaluated. Based on the health promotion model (HPM), the present study was conducted to assess the validity and reliability of the designed questionnaire of hypertensive patients’ nutritional perceptions.
Methodology:
In a cross-sectional study, the mentioned questionnaire was assessed based on opinions of 11 experienced faculty members and 671 hypertensive patients in rural areas in the year 2013. To evaluate the reliability, internal consistency (Cronbach's alpha) was calculated. Concerning the validity of the questionnaire, its content and construct validity were examined. Data analysis was performed using Statistical Package for the Social Sciences version 18 (SPSS Inc., Chicago, IL, USA).
Results:
Spearman-Brown and Cronbach's alpha coefficients results were acceptable in all constructs indicating a satisfactory reliability of the questionnaire. Questionnaire's questions were highly correlated with the total score signifying the internal consistency of the questions; therefore, all questions had a similar effect on the total score and the removal of each did no increase the alpha significantly (all questions had acceptable reliability). Factor analyses showed that all questions had acceptable factor loading and suitable validity. Moreover, the entire constructs of the questionnaire were approved by experts with high validity coefficient of 0.9.
Conclusion:
The designed questionnaire for assessment of the HPM constructs regarding hypertensive patients’ nutritional issues had appropriate psychometric characteristics. Reliability and validity of the questionnaire were also satisfactory and its overall structure was approved.
Keywords: Hypertension, pender health promotion model, questionnaire, reliability, validity
INTRODUCTION
Hypertension is a major cause of disability and death in the world.[1] It is the most common cause if stroke and renal failure.[2] In case of no suitable treatment and control of hypertension, 50% of hypertensive patients will die of coronary artery disease, 33% of stroke and 10-15% of renal failure.[3] In different studies, the prevalence of hypertension has been reported from 10% to 17% in Mediterranean and Middle Eastern countries. Furthermore, the rapid rates of social and economic changes in these countries have led to greater risks of cardiovascular diseases including hypertension.[4] In general, 25-35% of middle-aged people are hypertensive in Iran.[5] Hypertension is important due to its pervasiveness; however, what adds to its importance is that this disease is not controllable.[6] Self-care, as highlighted by the World Health Organization, is one of the most important issues in controlling hypertension;[7] nevertheless, because of the latent and asymptomatic nature of hypertension, self-care is not performed satisfactorily among the hypertensive patients.[8,9,10] The permanent nature of hypertension, its many medical complications and absence of clinical symptoms have strengthened the view that treatment is worse than the disease itself.[11] Accordingly, lack of patients’ adherence to self-care has been repeatedly reported as the main cause of hypertension control practices failure.[11] Adherence to treatment is a multidimensional factor that varies from person to person[12] and as mentioned in other studies, “patients’ beliefs” is identified as one of its major influential aspects.[13,14]
Evidence suggests that hypertension has been thought to be unimportant[15,16] and this might be the reason behind the lack of these patients’ adherence to their diet.[17] Nonetheless, the role of nutrition in control of hypertension is undeniable.[18] Unfortunately, there are several contradictory evidences since most patients do not follow their diet thoroughly. It has been reported that only less than half of these patients have accepted the use of proper diet as part of their treatment.[19] In the same way, several studies have indicated wrong eating habits among hypertensive patients. The root of all these false beliefs and behaviors might be inadequate or wrong knowledge about the nature of hypertension and its related dietary concerns since poor knowledge of patients has been referred to as one reason behind loss of control over hypertension.[20,21] A study by Oliveria et al. (2004) and Sabouhi et al. (2011) stated that patients had false information in some cases.[22,23] In a study in China, it was revealed that rural patients had little nutrition-related information[24] and false conceptions[23] about their disease. In another study, 50% of patients did not think of hypertension as a serious disease.[22] Egan and Basile (2003), Viera et al. (2008) and Victor et al. (2008) found that the complications of hypertension[15] and its asymptomatic nature[25,26] were not accepted by the majority of patients.[15]
Lack of proper information and false perceptions in rural areas is worrisome.[24] However, these problems are not unique to these areas while they have also been reported in urban areas of industrialized countries.[21] Misinformation effect is also reflected in patients’ behaviors as outlined by Salimzadeh et al. the hydrogenated oils containing undesirable fatty acids are the main source of fat in hypertensive patients’ diet.[27]
Extensive studies have been conducted on the attitudes and perceptions towards hypertension and nutrition;[28,29,30] yet, very limited number of these studies has applied theoretical frameworks in the area of behavior change and no study has been conducted on the basis of the health promotion model (HPM) to analyze and predict nutritional behavior of hypertensive patients in both urban and rural areas.
According to Marriner (2005), the HPM was first proposed by Pender.[31] HPM defined as a framework and a guide to explore the complex biological and psychological processes that motivate people to change their behaviors toward health promotion.[32] HPM has provided a theoretical framework to explore the factors influencing health behaviors. This model has been considered as a framework to explain appropriate behaviors in a health-improving life-style.[33] HPM consists of factors including individual characteristics and experiences with subgroups of previous related behaviors and personal affairs and behavior specific cognitions and affect representatives of the main behavioral motivations.[33] This model's constructs consist of self-efficacy, perceived benefits and barriers, emotion-related behaviors, interpersonal and situational influences, commitment to behaviors and preferences and immediate competitiveness.[32] The commitment to behaviors deals with commitment to perform a particular action regardless of competing preferences. The perceived benefits and barriers are respectively about psychological demonstrations of positive or reinforcing consequences and barriers, complications and costs associated with an action. Situational and interpersonal influences are correspondingly concerned with environmental effects and subjective norms and perceived social supports on behaviors. Perceived self-efficacy addresses one's judging ability to organize and implement a series of actions to perform a particular action. Finally, emotion-related behaviors are behaviors associated with subjective feelings about a specific event.[32]
This pattern seems to be a good predictor of nutritional behavior; therefore, in the present research, the HPM was used to theoretically investigate the nutritional behaviors of hypertensive patients. However, in order to use the results confidently to explain patients’ behavioral changes to prevent the development of both early and late complications of the disease, it was necessary to ensure the validity and reliability of the considered measure first. Accordingly, this study was designed to determine the validity and reliability of the designed questionnaire to assess patients’ perceptions based on the HPM.
METHODOLOGY
Participants and sampling
This cross-sectional study was conducted in villages covered by Ardabil City Health Center in 2013. All hypertensive patients who lived in the mentioned rural areas constituted the population of the present study. Using a multistage sampling method, a total of 671 patients were randomly selected out of the whole population.
The inclusion criteria were hypertension disease diagnosed by a physician, having a medical profile in the health centers, not suffering from severe or chronic complications of hypertension or any other chronic diseases, being older than 35 years and <60, having the ability to read and write, no history of surgery or hospitalization in the past 3 months and being willing to participate in the study while the only exclusion criteria was patient's unwillingness to continue the experiment.
Instrument
The data collection instrument was a questionnaire consisting of eight parts: (1) Demographic questions, (2) questions about nutrition perceived benefits, including nine questions that were answered based on a 4-point Likert scale (strongly agree, agree, disagree and strongly disagree) ranging from 1 to 4 for each question, (3) questions about nutrition perceived barriers, including 10 question that were answered based on a 4-point Likert scale (strongly agree, agree, disagree and strongly disagree) ranging from 1 to 4 for each question, (4) questions related to nutrition self-efficacy, including 10 questions that were answered based on a 10-point scale ranging from 1 to 10 for each question, (5) questions about nutrition emotional-based behaviors, including eight questions that were answered based on a 5-point Likert scale (always, often, sometimes, rarely and never) ranging from 1 to 5 for each question, (6) questions regarding nutrition interpersonal influences, including nine questions about spousal social support that were answered on a 5-point scale ranging from 1 to 5, (7) questions about nutrition situational influences, including seven questions that were answered based on a 5-point Likert scale (always, often, sometimes, rarely, never) ranging from 1 to 5, (8) questions associated with nutrition commitment, including nine questions that were answered based on a 5-point Likert scale (always, often, sometimes, rarely, never) ranging from 1 to 5.
In this study, the objectives and parts of the questionnaire were comprehensively explained and elaborated for the health workers. In addition, the participants’ data were collected through face to face interviews with their trusted health workers to enhance the accuracy of their answers.
Data were analyzed using Statistical Package for the Social Sciences (SPSS-18) (SPSS Inc., Chicago, IL, USA) software and explained through descriptive statistics indices including mean and standard deviation. To estimate the validity, factor analysis, correlation between the constructs and content validity were used and to assess the reliability, Cronbach's alpha and Spearman coefficients were used. Confidence coefficient and significance level in all calculations were 95% and (P < 0.05) respectively.
Validity and reliability of the questionnaire
Based on previous research and related literature, the mentioned questionnaire was designed by the researcher. After reviewing the relevant literature, a total of 96 questions were designed to assess perceived benefits (14 items), perceived barriers (16 items), self-efficacy (18 items), emotions associated with behaviors (12 items), situational influences (11 items), interpersonal influences (12 items) and commitment to action (13 items).
Then five of the health professionals were asked to analyze sentences related to each construct based on criteria such as simplicity, understandability, Persian syntax and suitability for the intended construct. They were also requested to provide their suggestions in order to enhance face validity of the questionnaire. Accordingly, 20 items were deleted and 27 were reviewed and revised at the end of this stage.
To determine the content validity of the provided questionnaire, quantitative method was applied and the ratio of content validity (CVR) to content validity index (CVI) were calculated for the final 76 items. Doing so, the views of 11 experts and professors in the fields of health education and health promotion, nutrition and medicine were also collected about the questionnaire. To obtain the CVR, the group of experts was asked to comment on items associated with each construct with any of the possible three responses of essential, useful but not essential and not essential. Consequently, Based on the number of experts and the formula CVR = ne−(n/2)/(n/2), the CVR was calculated for each item.[34] In this formula, n is the number of experts who participated in validity analysis of the questionnaire and ne is the number of experts who chose the option “essential” for a particular item (in this study, the CVI for each item was 0.59).[34] After calculation of CVR, 16 items were excluded since they did not obtain the required ratio.
To determine the validity of each item, the experts’ ideas were used regarding three criteria of simplicity, relevance and clarity. A 4-point Likert scale was used for each criterion; thus the possible options for simplicity criterion were quite simple, simple, rather simple and not simple, for relevance criterion, quite relevant, relevant, rather relevant and not relevant and for clarity criterion, quite clear, clear, rather clear and not clear. Then to calculate the CVI, the number of chosen first two options for each item was considered for each criterion and the resulting number was divided by the number of experts (i.e., 11). Hence, the CVI was determined for each item and the value of 0.79 was considered as an acceptable criterion for keeping the items in the questionnaire.[34]
To assess the questionnaire's reliability, internal consistency was calculated. Stability or internal consistency is defined as the degree to which the questions in a questionnaire are correlated with each other. The most common way to assess internal consistency is calculation of Cronbach's alpha. According to this approach, the measure is reliable when its Cronbach's alpha coefficient is bigger than or equal to 0.7.[35] Thus, to calculate the internal consistency of the designed questionnaire, the item-total correlation method that calculates the correlation of each questions with the total questions was applied and based on its results, inappropriate questions were excluded.[36]
Exploratory factor analysis, another method for construct validation, was also used in this study. This method is used to determine the related questions. Accordingly, to evaluate the potentiality of the designed questionnaire for factor analysis, Kaiser Mayer-Olkin (KMO) and Bartlett's test Sphericity that respectively analyzed the adequacy of sampling and non-zero correlation between the items were used. Then, using principle component, factor analysis was conducted with varimax rotation. Furthermore, to extract the number of factors, the Scree plot test >1 and Eigen value curve were used. To maintain each of the extracted factors and avoidance of secondary loads, the minimum factor loading of 0.4 were specified.[37,38]
RESULTS
In the present analysis, nearly 74.5% of the participants were female, an average age and disease duration were 50.2 ± 6.4 and 5.9 ± 4.0 years respectively. 75.9% (503 patients) of the contributors had received an elementary education.
In the CVI stage, all items had met the offered criteria; therefore none of the initial 60 items was removed. For all constructs, The CVI was calculated by assessing the average of each construct's items (perceived benefits 0.93, perceived barriers 0.92 and self-efficacy 0.93, behavior-related emotions 0.92, situational influences 0.98, interpersonal influences 0.94 and action commitment 0.98). In a pilot study, 20 hypertensive patients examined the ambiguity and complexity of the questions and found no problem.
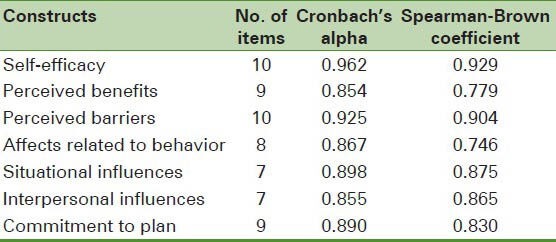
The reliability of the questionnaire was calculated using internal consistency analysis and Cronbach's alpha coefficient. The highest and lowest alphas were associated with perceived self-efficacy (0.962) and perceived benefits (0.854) respectively [Table 1].
Table 1.
Correlation coefficient of health promotion model constructs
The correlation between each item and each construct's total score was studied and for each construct, the total reliability was calculated based on each item's elimination. As shown in [Table 2], every single self-efficacy and perceived barriers-related question had an acceptable correlation with the total questions. For the perceived barriers construct, the correlations between each item and total score plus total reliability with each item's elimination were measured. The lowest correlation (0.663) was obtained for the question number 6 and the highest correlation (0.761) for the question number 1.
Table 2.
The descriptive and reliability indices of perceived self-efficacy and perceived-barriers
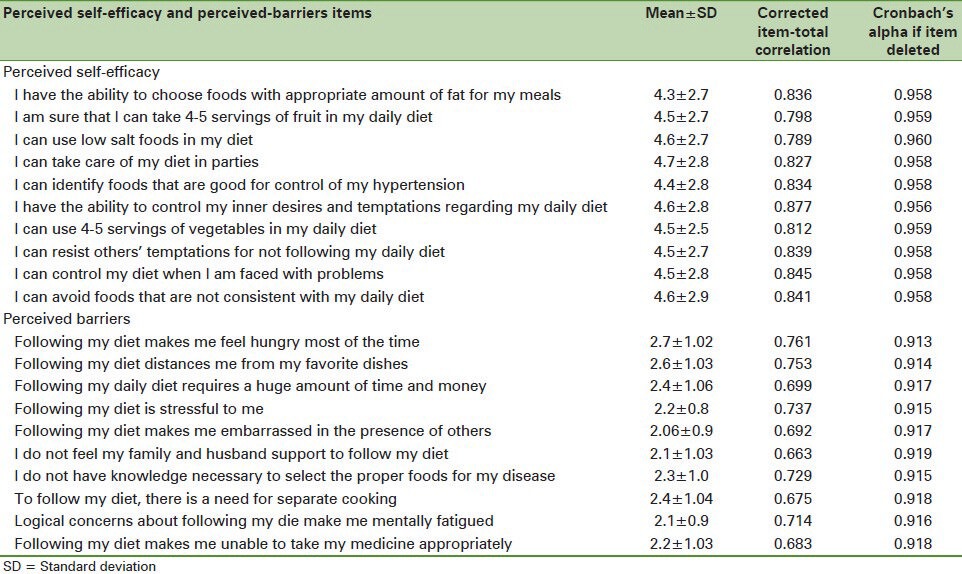
For the constructs of affects related to behaviors, perceived benefits, situational influences, commitment to behaviors and interpersonal influences, the correlations between each item and total score plus total reliability with each item's elimination were measured. The results were indicated that every single question had an acceptable correlation with the total questions. Moreover, with removal of every single question, the total reliability of the questionnaire was less than its reliability without the items elimination.
The results of Bartlett's test and KMO value indicated that the existing data could be used for factor analysis. The KMO value was 0.950 and significance of Bartlett's test was less that 0.05 (P < 0.001) indicating appropriateness of factor analysis results regarding the selected data and construct identification.
For factor extraction, Eigen value curve and Scree plot test were applied. Thus, considering special values bigger than 1 and scree diagram, seven factors were extractable [Table 3]. Factors 1-7 respectively indicated 14.6%, 12.7%, 8.9%, 8.6%, 7.2%, 5.1% and 4.2% (total of 61.5%) of the total variability [Figure 1].
Table 3.
Total variance explained with principal component analysis method
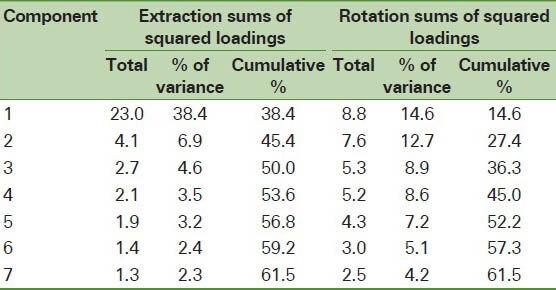
Figure 1.
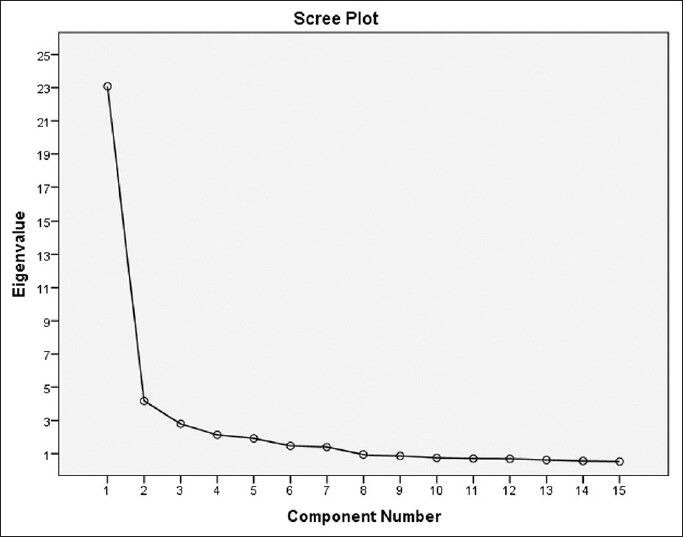
Scree plot curve to determining of extractable components
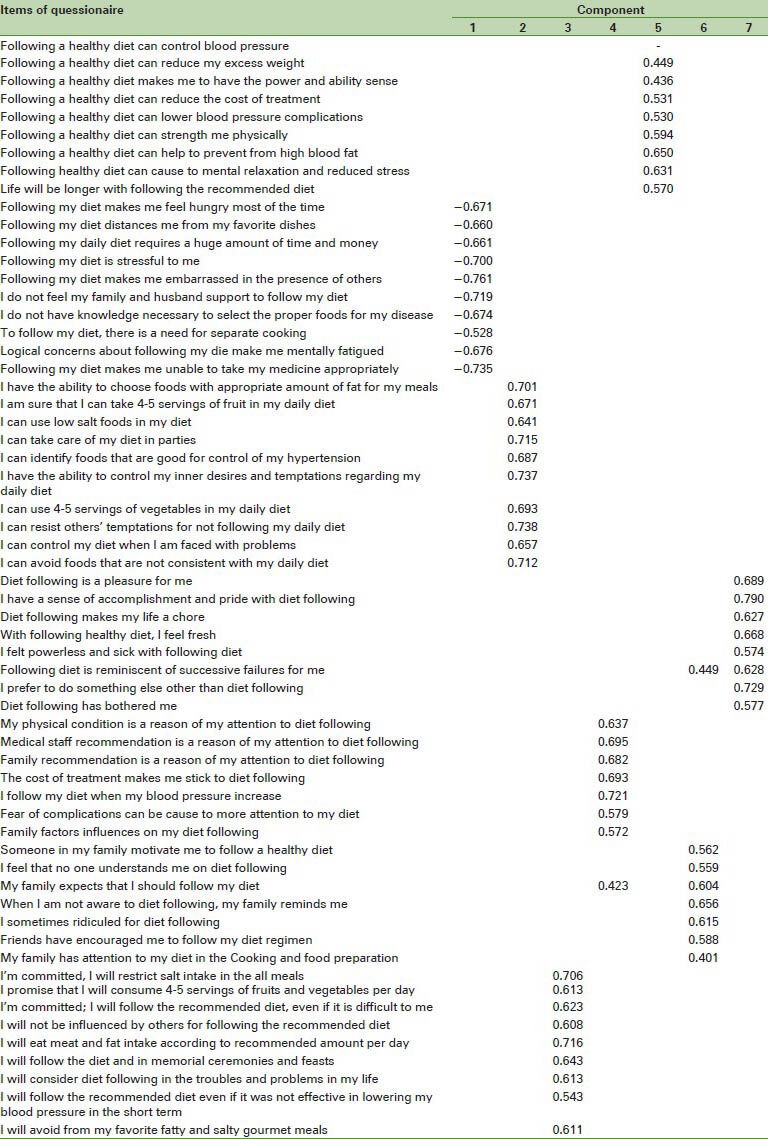
In addition, varimax rotation was used for better factors’ separation and extraction. The results of exploratory factor analysis, principle component analysis, varimax rotation analysis and factors’ loadings analysis for each variable in extracted factors are shown in Table 4 demonstrating that all items had appropriate loadings [Table 4]. The mentioned seven factors were self-efficacy, perceived benefits, perceived barriers, interpersonal influences, situational influences, behaviors commitment and behavior-related emotions.
Table 4.
Rotated component matrix of studied variables
DISCUSSION
Based on the HPM, this study aimed to determine the reliability and validity of a questionnaire designed to measure the nutritional perceptions in hypertensive patients. The results indicated that the mentioned questionnaire had acceptable reliability and validity; therefore, it can be used in studies related to nutritional perceptions and behaviors of hypertensive patients.
The reliability coefficient of both halves of this questionnaire was approved for all constructs while the lowest (0.746) and highest (0.929) Spearman-Brown coefficients were observed in affects related to behavior and self-efficacy constructs respectively. The highest (0.962) and lowest (0.854) Cronbach's alphas were reported in self-efficacy and perceived benefits constructs respectively. In sum, the results of both coefficients for all constructs showed satisfactory reliability indicating the appropriateness of the designed questionnaire for its target population. Correlations between the questions and total score indicated that each of the items was highly correlated with the total score. Internal consistency of the questionnaire showed that all questions played an almost similar role in overall score and alpha coefficients did not increase significantly by the removal of each item. Thus, all items had an acceptable reliability and no change or elimination was required.
In this study, factor analysis was used to examine the internal consistency and construct validity of the questionnaire. Psychometric experts believe that the correlation between subscales of a test is an indication of internal consistency and construct validity of a test.[39] In this study, the obtained correlation coefficients showed that the subscales were more or less interacting with each other. Regarding shared values and factor loadings, the findings of this study suggested that the questions’ factor loadings were high. In addition, accepting 0.4 as a threshold for factor loadings,[36] it was specified that all questions had acceptable factor loading. This indicated that based on factor analysis, every one item in the questionnaire was equally important. Based on theoretical principles of HPM, seven factors of self-efficacy, perceived benefits, perceived barriers, interpersonal influences, situational influences, commitment to plan and affects related to behavior were identified in this study.
Similar to other related studies, to determine the content validity of the questionnaires, a panel of experts was used. In some studies, quantitative indices are used to validate a questionnaire; in view of that, experts are asked to quantitatively express their ideas about each item and eventually a number is reported as a CVI.[40] The results of the current study showed that all constructs in the designed questionnaire were approved by the experts with validity coefficients over 0.9.
Among the limitations of this study was that no confirmatory factor analysis was conducted to explore predictive values of extracted factors regarding the patients’ nutritional behaviors. On the other hand, random sampling that has been repeatedly suggested as a way to improve generalizability was one of the strengths of this study.[41] Using this instrument in future studies, further reliability and validity analysis based on demographic characteristics of the intended population is suggested.
CONCLUSION
Based on the HPM, the proposed questionnaire in the present study had the essential psychometric properties to evaluate the constructs related to nutritional issues in hypertensive patients. Moreover, the reliability and validity of the questionnaire were satisfactory and its overall structure was approved.
Footnotes
Source of Support: Ardabil University of Medical Sciences
Conflict of Interest: None declared
REFERENCES
- 1.Hammami S, Mehri S, Hajem S, Koubaa N, Frih MA, Kammoun S, et al. Awareness, treatment and control of hypertension among the elderly living in their home in Tunisia. BMC Cardiovasc Disord. 2011;11:65. doi: 10.1186/1471-2261-11-65. [DOI] [PMC free article] [PubMed] [Google Scholar]
- 2.Braunwald E. 5th ed. Philadelphia: Saunders; 1997. Heart Disease, A Textbook of Cardiovascular Medicine. [Google Scholar]
- 3.Wilson PW. Established risk factors and coronary artery disease: The Framingham Study. Am J Hypertens. 1994;7:7S–12. doi: 10.1093/ajh/7.7.7s. [DOI] [PubMed] [Google Scholar]
- 4.Noohi F, Maleki M, Orei S. Hypertension. In: Azizi F, Hatami H, Janghorbani M, editors. Epidemiology and Control of Common Disorders in Iran. 2nd ed. Tehran: Eshtiagh Press; 2001. pp. 23–30. [Google Scholar]
- 5.Haghdoost AA, Sadeghirad B, Rezazadehkermani M. Epidemiology and heterogeneity of hypertension in Iran: A systematic review. Arch Iran Med. 2008;11:444–52. [PubMed] [Google Scholar]
- 6.Pickering TG. Why are we doing so badly with the control of hypertension? Poor compliance is only part of the story. J Clin Hypertens (Greenwich) 2001;3:179–82. doi: 10.1111/j.1524-6175.2001.00465.x. [DOI] [PMC free article] [PubMed] [Google Scholar]
- 7.Burkhart PV, Sabaté E. Adherence to Long-Term Therapies: evidence for Action. J Nurs Scholarsh. 2003;35:207. [PubMed] [Google Scholar]
- 8.Kressin NR, Wang F, Long J, Bokhour BG, Orner MB, Rothendler J, et al. Hypertensive patients’ race, health beliefs, process of care, and medication adherence. J Gen Intern Med. 2007;22:768–74. doi: 10.1007/s11606-007-0165-9. [DOI] [PMC free article] [PubMed] [Google Scholar]
- 9.Mellen PB, Gao SK, Vitolins MZ, Goff DC., Jr Deteriorating dietary habits among adults with hypertension: DASH dietary accordance, NHANES 1988-1994 and 1999-2004. Arch Intern Med. 2008;168:308–14. doi: 10.1001/archinternmed.2007.119. [DOI] [PubMed] [Google Scholar]
- 10.Ndumele CD, Shaykevich S, Williams D, Hicks LS. Disparities in adherence to hypertensive care in urban ambulatory settings. J Health Care Poor Underserved. 2010;21:132–43. doi: 10.1353/hpu.0.0259. [DOI] [PubMed] [Google Scholar]
- 11.Siegel D. Barriers to and strategies for effective blood pressure control. Vasc Health Risk Manag. 2005;1:9–14. doi: 10.2147/vhrm.1.1.9.58940. [DOI] [PMC free article] [PubMed] [Google Scholar]
- 12.Saleem F, Hassali M, Shafie A, Atif M. Drug attitude and adherence: A qualitative insight of patients with hypertension. J Young Pharm. 2012;4:101–7. doi: 10.4103/0975-1483.96624. [DOI] [PMC free article] [PubMed] [Google Scholar]
- 13.DiMatteo MR. Variations in patients’ adherence to medical recommendations: A quantitative review of 50 years of research. Med Care. 2004;42:200–9. doi: 10.1097/01.mlr.0000114908.90348.f9. [DOI] [PubMed] [Google Scholar]
- 14.Krousel-Wood M, Hyre A, Muntner P, Morisky D. Methods to improve medication adherence in patients with hypertension: Current status and future directions. Curr Opin Cardiol. 2005;20:296–300. doi: 10.1097/01.hco.0000166597.52335.23. [DOI] [PubMed] [Google Scholar]
- 15.Egan BM, Basile JN. Controlling blood pressure in 50% of all hypertensive patients: An achievable goal in the healthy people 2010 report? J Investig Med. 2003;51:373–85. doi: 10.1136/jim-51-06-34. [DOI] [PubMed] [Google Scholar]
- 16.Nelson CR, Knapp DA. Trends in antihypertensive drug therapy of ambulatory patients by US office-based physicians. Hypertension. 2000;36:600–3. doi: 10.1161/01.hyp.36.4.600. [DOI] [PubMed] [Google Scholar]
- 17.Hsiao CY, Chang C, Chen CD. An investigation on illness perception and adherence among hypertensive patients. Kaohsiung J Med Sci. 2012;28:442–7. doi: 10.1016/j.kjms.2012.02.015. [DOI] [PMC free article] [PubMed] [Google Scholar]
- 18.Cornell S, Briggs A. Newer treatment strategies for the management of type 2 diabetes mellitus. J Pharm Pract. 2004;17:49–54. [Google Scholar]
- 19.Chan YM, Molassiotis A. The relationship between diabetes knowledge and compliance among Chinese with non-insulin dependent diabetes mellitus in Hong Kong. J Adv Nurs. 1999;30:431–8. doi: 10.1046/j.1365-2648.1999.01098.x. [DOI] [PubMed] [Google Scholar]
- 20.Erkoc SB, Isikli B, Metintas S, Kalyoncu C. Hypertension Knowledge-Level Scale (HK-LS): A study on development, validity and reliability. Int J Environ Res Public Health. 2012;9:1018–29. doi: 10.3390/ijerph9031018. [DOI] [PMC free article] [PubMed] [Google Scholar]
- 21.Sanne S, Muntner P, Kawasaki L, Hyre A, DeSalvo KB. Hypertension knowledge among patients from an urban clinic. Ethn Dis. 2008;18:42–7. [PubMed] [Google Scholar]
- 22.Oliveria SA, Chen RS, McCarthy BD, Davis CC, Hill MN. Hypertension knowledge, awareness, and attitudes in a hypertensive population. J Gen Intern Med. 2005;20:219–25. doi: 10.1111/j.1525-1497.2005.30353.x. [DOI] [PMC free article] [PubMed] [Google Scholar]
- 23.Sabouhi F, Babaee S, Naji H, Zade AH. Knowledge, awareness, attitudes and practice about hypertension in hypertensive patients referring to public health care centers in Khoor and Biabanak 2009. Iran J Nurs Midwifery Res. 2011;16:35–41. [PMC free article] [PubMed] [Google Scholar]
- 24.Li X, Ning N, Hao Y, Sun H, Gao L, Jiao M, et al. Health literacy in rural areas of China: Hypertension knowledge survey. Int J Environ Res Public Health. 2013;10:1125–38. doi: 10.3390/ijerph10031125. [DOI] [PMC free article] [PubMed] [Google Scholar]
- 25.Viera AJ, Cohen LW, Mitchell CM, Sloane PD. High blood pressure knowledge among primary care patients with known hypertension: A North Carolina Family Medicine Research Network (NC-FM-RN) study. J Am Board Fam Med. 2008;21:300–8. doi: 10.3122/jabfm.2008.04.070254. [DOI] [PubMed] [Google Scholar]
- 26.Victor RG, Leonard D, Hess P, Bhat DG, Jones J, Vaeth PA, et al. Factors associated with hypertension awareness, treatment, and control in Dallas County, Texas. Arch Intern Med. 2008;168:1285–93. doi: 10.1001/archinte.168.12.1285. [DOI] [PubMed] [Google Scholar]
- 27.Salimzadeh HH, Eftekhar H, Asasi N, Salarifar M, Dorosty AR. Dietetic risk factors and ischemic heart disease. J Public Health Inst Public Health Res. 2004;2:1–14. [Google Scholar]
- 28.Pawlak R, Colby S. Benefits, barriers, self-efficacy and knowledge regarding healthy foods; perception of African Americans living in eastern North Carolina. Nutr Res Pract. 2009;3:56–63. doi: 10.4162/nrp.2009.3.1.56. [DOI] [PMC free article] [PubMed] [Google Scholar]
- 29.Kusuma YS. Perceptions on hypertension among migrants in Delhi, India: A qualitative study. BMC Public Health. 2009;9:267. doi: 10.1186/1471-2458-9-267. [DOI] [PMC free article] [PubMed] [Google Scholar]
- 30.Sheahan SL, Fields B. Sodium dietary restriction, knowledge, beliefs, and decision-making behavior of older females. J Am Acad Nurse Pract. 2008;20:217–24. doi: 10.1111/j.1745-7599.2008.00307.x. [DOI] [PubMed] [Google Scholar]
- 31.Marriner T, Raile AM. 5th ed. St. Louis: Mosby; 2005. Nursing Theorists and their Work. [Google Scholar]
- 32.Pender NJ, Murdaugh CL, Parsons MA. 6th ed. Boston, MA: Pearson; 2011. Health Promotion in Nursing Practice. [Google Scholar]
- 33.Chamberlain B. Health promotion in nursing practice. Clin Nurse Spec. 2007;21:130. [Google Scholar]
- 34.Hajizadeh E, Asgari M. 1st ed. Tehran: The Organization of Jihad University Press; 2010. Research methods and statistical analysis by looking at health and life sciences. [Google Scholar]
- 35.Santos AR. Cronbach's Alpha: A tool for assessing the reliability of scales. J Ext. 1999;37:35–9. [Google Scholar]
- 36.Ebrahimi A, Neshatdoost HT, Kalantari M, Molavi H, Asadollahi GA. Factor structure, reliability and validity of religious attitude scale. J Fundam Ment Health. 2008;10:107–16. [Google Scholar]
- 37.Kazemnejad A, Heydari M, Norouzadeh R. 1st ed. Tehran: Jameenegar Publication; 2010. Statistical Methods for Healthcare Research and Application of SPSS in data Analysis. [Google Scholar]
- 38.Ghasemi V. 1st ed. Tehran: Azarakhsh; 2010. Structural Equation Modeling in Social Research Using Amos/Graphic. [Google Scholar]
- 39.Test MA, Greenberg JS, Long JD, Brekke JS, Burke SS. Construct validity of a measure of subjective satisfaction with life of adults with serious mental illness. Psychiatr Serv. 2005;56:292–300. doi: 10.1176/appi.ps.56.3.292. [DOI] [PubMed] [Google Scholar]
- 40.Polit DF, Beck CT. The content validity index: Are you sure you know what's being reported? Critique and recommendations. Res Nurs Health. 2006;29:489–97. doi: 10.1002/nur.20147. [DOI] [PubMed] [Google Scholar]
- 41.Mohammadizeidi I, Pakpour H, Zeidi BM. Reliability and validity of persian version of the health-promoting lifestyle profile. J Mazandaran Univ Med Sci. 2012;21:102–13. [Google Scholar]


