

Abstract
Introduction
Inflammatory markers such as white cell count (WCC) and C-reactive protein (CRP) and, more recently, bilirubin have been used as adjuncts in the diagnosis of appendicitis. The aim of this study was to determine the diagnostic accuracy of the above markers in acute and perforated appendicitis as well as their value in excluding the condition.
Methods
A retrospective analysis of 1,169 appendicectomies was performed. Patients were grouped according to histological examination of appendicectomy specimens (normal appendix = NA, acute appendicitis = AA, perforated appendicitis = PA) and preoperative laboratory test results were correlated. Receiver operating characteristic (ROC) curve area analysis (area under the curve [AUC]) was performed to examine diagnostic accuracy.
Results
ROC analysis of all laboratory variables showed that no independent variable was diagnostic for AA. Good diagnostic accuracy was seen for AA when all variables were combined (WCC/CRP/bilirubin combined AUC: 0.8173). In PA, the median CRP level was significantly higher than that of AA (158mg/l vs 30mg, p<0.0001). CRP also showed the highest sensitivity (100%) and negative predictive value (100%) for PA. CRP had the highest diagnostic accuracy in PA (AUC: 0.9322) and this was increased when it was combined with WCC (AUC: 0.9388). Bilirubin added no diagnostic value in PA. Normal levels of WCC, CRP and bilirubin could not rule out appendicitis.
Conclusions
CRP provides the highest diagnostic accuracy for PA. Bilirubin did not provide any discriminatory value for AA and its complications. Normal inflammatory markers cannot exclude appendicitis, which remains a clinical diagnosis.
Keywords: White cell count, C-reactive protein, Bilirubin, Appendicitis, Perforated appendicitis, Normal appendix
Acute appendicitis (AA) is a common surgical condition and accounts for over 50,000 appendicectomies performed yearly in the UK. 1 The diagnosis of AA is largely clinical and once it is established, operative management ensues. 2 Despite appendicitis being a common disease, its presentation is not always typical and misdiagnosis is therefore not uncommon. 1 Diagnostic difficulties may lead to negative appendicectomies 3 or cases of missed appendicitis resulting in complications such as appendiceal perforation or abscess formation. 4 Diagnostic aids (eg scoring systems, 5,6 ultrasonography, computed tomography [CT] 7 or even magnetic resonance imaging [MRI]), 8 exist in order to help confirm the diagnosis or to guide the surgeon’s decision on operative management or a period of observation when appendicitis is suspected. 9 However, these diagnostic adjuncts may be expensive, may involve high radiation exposure, and may not always have accurate and reproducible results. 9
Laboratory test results such as white cell count (WCC) and C-reactive protein (CRP) are readily available and commonly performed in patients with suspected appendicitis. Their diagnostic and discriminatory value in AA has been studied extensively but remains controversial. 10–14
In a meta-analysis of 24 studies, Andersson concluded that laboratory results of the inflammatory response together with clinical descriptors of peritoneal irritation and a history of migratory pain yield the most important diagnostic information. 14 Further studies have shown that the predictive values of WCC and CRP improve when combined, and that appendicitis is unlikely when both WCC and CRP are within the normal range. 15,16 Sengupta et al suggest that patients experiencing lower abdominal pain, with normal WCC and CRP, can be sent home. 17 Apart from the inflammatory variables, more recent studies suggest that hyperbilirubinaemia in patients with clinically suspected appendicitis may be a predictor for appendiceal perforation 18–23 and it has therefore been suggested that bilirubin should be included in the assessment of such patients. 23
The aim of this retrospective study was to determine from a large number of cases the diagnostic accuracy of WCC, CRP and bilirubin, either individually or when combined, in the prediction of appendicitis and, especially, its complications (ie perforated appendicitis [PA]). In our intention to avoid high rates of negative appendicectomy without the expense of high rates of PA, we looked for a cut-off value for the above markers that would potentially predict PA, and influence timing and urgency of surgical intervention. Finally, we explored whether normal inflammatory markers can exclude appendicitis.
Methods
A prospectively maintained histological database of all appendix specimens received at the histopathology department of Peterborough District Hospital was used in this retrospective study, which was registered with the hospital audit department. A total of 1,313 appendix specimens were received during the study period (April 2007 to October 2010), of which 1,169 patients were included in our analysis. We excluded 144 cases because either blood test results were not available or the appendicectomy was performed as part of another procedure. The 1,169 patients analysed were divided into three groups depending on the histopathology result: normal appendix (NA), acute appendicitis (AA) and perforated appendicitis (PA).
In our hospital, the vast majority of patients operated on for suspected appendicitis would have had a laparoscopic appendicectomy. Conversion to an open procedure would have occurred if the appendix could not be safely removed laparoscopically. All patients undergoing a laparoscopy for suspected appendicitis would have had their appendix removed even if it appeared macroscopically normal as long as no other cause for lower abdominal pain was identified.
Data analysis
Preoperative blood test results for the corresponding patients from the histological database were obtained using our hospital computer system. Preoperative blood tests are defined as those blood results available within 24 hours prior to surgical intervention. All 1,169 patients had a preoperative WCC result and all but 1 had a preoperative CRP measurement. While we have not investigated bilirubin routinely in suspected appendicitis, patients were often first seen by emergency nurse practitioners, who would include liver function tests in for the assessment of patients presenting with abdominal pain. A preoperative bilirubin result was available in 928/1,169 patients (79.4%). The normal levels for the above markers were: WCC 4–11 × 10 9 cells/l, CRP <10mg/l, bilirubin <21μmol/l.
The median WCC, CRP and bilirubin levels for each of the NA, AA and PA groups were obtained using Excel® (Microsoft, Redmond, WA, US). All statistical analysis was performed using Stata® v11 (StataCorp, College Station, TX, US) and Prism® 5 (GraphPad Software, La Jolla, CA, US). Results were compared using the Mann–Whitney U test. A p-value of <0.05 was considered statistically significant.
The diagnostic value of WCC, CRP and bilirubin was predicted with sensitivity, specificity, positive predictive value (PPV) and negative predictive value (NPV) for the above groups either for each individual test or when combined. Sensitivity, specificity, PPVs and NPVs varied when different cut-off values were examined (sensitivity analysis). The cut-off value finally chosen to compare sensitivity, specificity, PPV and NPV for each variable when looked at individually corresponded to the highest combined value for sensitivity and specificity, which resulted in a value either higher than normal or within the upper range of normal for each of the corresponding markers.
Finally, the diagnostic accuracy of WCC, CRP and bilirubin, either independently or when combined, was assessed by receiver operating characteristic (ROC) curve analysis. 24,25 The area under the curve (AUC) of the ROC curve gives a percentage of the times that a random patient from the group with the disease is actually detected by the test in question. 24 A value of 0.5 (corresponding to 50%) shows no predictive ability for the test in question whereas a value of 1.0 indicates perfect discrimination. 25
Results
Of the 1,169 patients included in this study, 591 (50.6%) were female. The median age was 25 years (interquartile range [IQR]: 17–39 years). The patients were divided into three groups depending on their corresponding histology. There were 41 patients (3.5%) with PA, 732 (62.6%) with AA and 396 (33.9%) with NA. Of the AA patients, 5.9% had evidence of appendiceal necrosis on histology. The median ages for each of the histological groups are shown in Table 1.
Table 1.
Median patient age and levels for white cell count (WCC), C-reactive protein (CRP) and bilirubin
| Histology | Sex | Patients | Age (years) | WCC (× 10 9 cells/l) | CRP (mg/l) | Bilirubin (µmol/l) |
|---|---|---|---|---|---|---|
| NA | All | 396 (100%) | 23 (IQR: 17–33) | 9.1 (IQR: 7.2–12.0) | 0 (IQR: 0–19) | 8 (IQR: 6–12) |
| Men | 127 (32%) | 22 (IQR: 15–30) | 8.4 (IQR: 6.8–12.0) | 0 (IQR: 0–23) | 10 (IQR: 7–15) | |
| Women | 269 (68%) | 23 (IQR: 18–33) | 9.3 (IQR: 7.3–12.1) | 0 (IQR: 0–18) | 8 (IQR: 6–11) | |
| AA | All | 732 (100%) | 27.5 (IQR: 17–42) | 14.4 (IQR: 11.7–17.5) | 30 (IQR: 0–92) | 13 (IQR: 9–20) |
| Men | 427 (58%) | 26 (IQR: 16–39) | 14.4 (IQR: 11.8–17.5) | 28 (IQR: 0–89) | 15 (IQR: 11–23) | |
| Women | 305 (42%) | 29 (IQR: 19–47) | 14.3 (IQR: 11.4–17.3) | 33 (IQR: 0–100) | 12 (IQR: 8–16) | |
| PA | All | 41 (100%) | 38 (IQR: 19–57) | 14.9 (IQR: 12.6–17.8) | 158 (IQR: 63–254) | 17 (IQR: 12–19) |
| Men | 24 (59%) | 42 (IQR: 22–62) | 15.0 (IQR: 11.5–17.4) | 105 (IQR: 54–214) | 18 (IQR: 15–23) | |
| Women | 17 (42%) | 35 (IQR: 17–48) | 14.9 (IQR: 12.9–20.8) | 250 (IQR: 142–278) | 13 (IQR: 10–17) |
NA = normal appendix; AA = acute appendicitis; PA = perforated appendicitis; IQR = interquartile range
In the first part of the analysis, the median WCC, CRP and bilirubin levels were derived for each of the three groups of NA, AA and PA (Table 1). When the median WCC, CRP and bilirubin levels were compared using a two-tailed Mann–Whitney U test, statistical significance was reached between the NA and AA groups for all three variables (Table 2). When the test variables’ median levels were compared for the AA and PA groups, it was only with CRP that statistical significance was seen (PA 158mg/l [IQR: 63–254mg/l] vs AA 30mg/l [IQR: 0–92mg/l], p<0.0001). Despite this statistically significant difference, the CRP ranges were overlapping (AA: 0–507mg/l, PA: 20–421mg/l), meaning no cut-off value point could be derived that would distinguish between AA and PA.
Table 2.
Normal appendix (NA), acute appendicitis (AA) and perforated appendicitis (PA) group comparison of the median levels of white cell count (WCC), C-reactive protein (CRP) and bilirubin
| WCC | CRP | Bilirubin | |
|---|---|---|---|
| NA vs AA | p<0.0001 | p<0.0001 | p<0.0001 |
| AA vs PA | p=0.3632 | p<0.0001 | p=0.0559 |
Having such a cut-off value point and predicting complicated appendicitis would have been of particular importance in women since fertility may be affected. In a subgroup analysis of female patients only, a statistically significant higher median CRP level was seen in the PA compared with the AA group (PA 250mg/l [IQR: 142–278mg/l] vs AA 32.5mg/l [IQR: 0–99.5mg/l], p<0.0001 on a two-tailed Mann–Whitney U test). However, again, no cut-off CRP level could be derived as their ranges were overlapping (AA: 0–461mg/l, PA: 0–369mg/l).
The performance of WCC, CRP and bilirubin was assessed initially by calculating their sensitivity and specificity. In AA, the sensitivities of WCC, CRP and bilirubin were 84%, 68% and 50% respectively (Table 3). Although WCC had the highest sensitivity, bilirubin had the highest specificity for the AA group (68%). When CRP was combined with WCC, a higher sensitivity of 88% was obtained for AA patients. When all three variables were combined, the sensitivity for AA increased to 96% but the specificity reduced to 33% from 60% (Table 3).
Table 3.
Sensitivity, specificity, positive predictive values (PPV) and negative predictive values (NPV) for white cell count (WCC), C-reactive protein (CRP) and bilirubin in all 1,169 patients when predicting acute appendicitis (AA) or perforated appendicitis (PA)
| Cut-off | Sensitivity | Specificity | PPV | NPV | ||
|---|---|---|---|---|---|---|
| WCC | AA | 10 × 10 9 cells/l | 84% | 58% | 77% | 68% |
| PA | 10 × 10 9 cells/l | 90% | 58% | 18% | 93% | |
| CRP | AA | 10mg/l | 68% | 66% | 77% | 54% |
| PA | 10mg/l | 100% | 66% | 23% | 100% | |
| Bilirubin | AA | 15µmol/l | 50% | 68% | 73% | 44% |
| PA | 15µmol/l | 65% | 68% | 17% | 95% | |
| WCC / CRP | AA | 60%* | 88% | 60% | 79% | 74% |
| PA | 60%* | 46% | 96% | 51% | 95% | |
| WCC / CRP / bilirubin | AA | 60%* | 96% | 33% | 71% | 83% |
| PA | 60%* | 54% | 77% | 19% | 94% |
Probability of a patient having appendicitis
These results seem to suggest that AA is unlikely if all three markers are within normal range. However, 148 of the 732 patients (20.2%) in the AA group had normal WCC levels and 214 (29.2%) had normal CRP levels. Thirty-six patients (4.9%) in the AA group had both normal WCC and CRP. Of these 36 patients, 26 had a bilirubin measurement and only 1 had raised a bilirubin level. Our results therefore suggest that even when the above markers are within normal range, appendicitis cannot be excluded as nearly 5% of patients with normal WCC/CRP/bilirubin levels had AA confirmed histologically.
In the PA group, CRP had the highest sensitivity (100%), followed by WCC (90%) and bilirubin (65%) (Table 3). Combining WCC with CRP led to a marked decrease of sensitivity to 46% when predicting PA whereas specificity was increased to 96%. Similarly, combining bilirubin with WCC and CRP decreased the specificity to 77%, with some increase in the sensitivity to 54%. In PA, CRP alone had the highest NPV (100% with cut-off at 10mg/l or 99% with cut-off point at 20mg/l) compared with WCC and bilirubin either individually or when all combined (Table 3). With such a high NPV for CRP in PA, we would suggest that a normal CRP level cannot rule out AA although PA is unlikely.
As sensitivity and specificity values may vary when different cut-off points are taken, an ROC curve analysis was performed to assess the diagnostic accuracy of WCC, CRP and bilirubin, either individually or when combined, in predicting AA or PA. The ROC curves for WCC, CRP and bilirubin were derived individually for predicting AA (Fig 1) and the corresponding AUCs with 95% confidence intervals (CI) were calculated. Although WCC had the highest AUC compared with that of CRP and bilirubin, all of the above markers only showed moderate discriminatory power for AA (AUC WCC: 0.7786, AUC CRP: 0.7047, AUC bilirubin: 0.7114). When combining the ROC curves for WCC and CRP, a higher AUC of 0.8139 was seen and this result corresponds to good discriminatory power for AA. Adding bilirubin to the above ROC curves had no significant change to the ROC curve area (0.8173).
Figure 1.
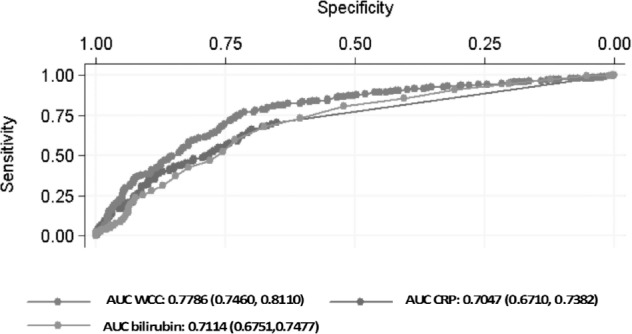
Receiver operating characteristic curves with corresponding area under the curve (AUC) for white cell count (WCC), C-reactive protein (CRP) and bilirubin in predicting acute appendicitis. AUC value provided with 95% confidence interval in parentheses.
The ROC curves of WCC, CRP and bilirubin in predicting PA individually are shown in Figure 2. Each of the AUCs predicting PA had higher values than those predicting AA (Fig 2). In PA, the AUC for CRP alone gave an excellent discriminatory result of 0.9322 (95% CI: 0.9021–0.9622) whereas the AUCs for either WCC (0.8044, 95% CI: 0.7238–0.8849) or bilirubin (0.801, 95% CI: 0.7347–0.8673) showed good discriminatory power. When WCC and CRP ROC curves were combined, a slightly higher AUC was obtained (0.9388) compared with CRP alone. However, the further addition of bilirubin to WCC and CRP slightly reduced the AUC area to 0.9364. From the above ROC analysis, CRP alone or when combined with WCC has excellent discriminatory power whereas bilirubin does not seem to add any discriminatory power.
Figure 2.
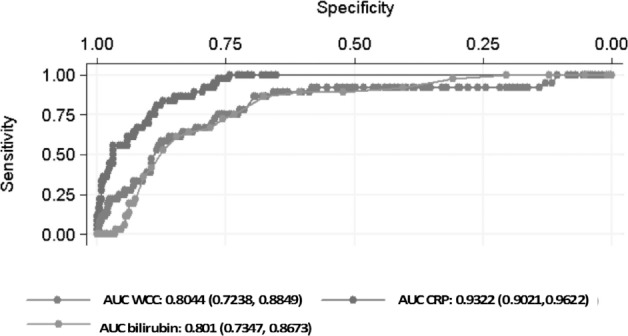
Receiver operating characteristic curves with corresponding area under the curve (AUC) for white cell count (WCC), C-reactive protein (CRP) and bilirubin in predicting perforated appendicitis. AUC value provided with 95% confidence interval in parentheses.
Finally, in an attempt to identify a cut-off value point for each of the variables in predicting AA or PA, the variable level corresponding to optimal sensitivity and specificity on the ROC curve was derived (Table 4). These levels correspond to paired optimal sensitivity and specificity, and do not necessarily show the highest level for either sensitivity or specificity. The corresponding levels for WCC were 11.7 × 10 9 cells/l in AA and 12.9 × 10 9 cells/l in PA. Similarly, the levels for CRP in AA and PA were 11mg/l and 44mg/l respectively. The bilirubin ROC curves showed that the optimal level for bilirubin was 10µmol/l and 14µmol/l for AA and PA respectively. These levels are not of clinical significance, however, because they are within normal range (eg bilirubin) or they are not discriminatory within that range (eg CRP 44mg/l).
Table 4.
The levels of white cell count (WCC), C-reactive protein (CRP) and bilirubin corresponding to optimal sensitivity and specificity for either acute appendicitis (AA) or perforated appendicitis (PA); normal levels: WCC 4–11 × 10 9 cells/l, CRP <10mg/l, bilirubin <21µmol/l
Discussion
The most important step in the management of patients with suspected appendicitis is reaching the decision about operative intervention and its timing so that both negative appendicectomies and complicated appendicitis rates are kept to a minimum. Although appendicectomy is a routine surgical procedure, patients with a negative appendicectomy have the risk of infectious complications and can have a longer hospital stay than patients who had appendicitis. 26 On the other hand, PA is an advanced stage of appendicitis and, consequently, when AA is diagnosed correctly and treated early, there is less associated morbidity and mortality. 27 In our study, the negative appendicectomy rate was 33.9% whereas the PA rate was 3.5%. Previous studies have reported negative appendicectomy rates of up to 20% in male and 30% in female patients. 3,28 In our cohort, the negative appendicectomy rate was high because all patients who had a diagnostic laparoscopy with a macroscopically normal appendix and no other cause for peritonism identified (eg gynaecological) had their appendix removed routinely.
As AA and its complications can be a diagnostic challenge for the surgeon, the role of inflammatory variables such as WCC and CRP in the workup of patients with suspected appendicitis and in the prediction of perforation has been studied extensively. 1,10–14 In a meta-analysis, Andersson concluded that most diagnostic information comes from a history of migratory pain, clinical assessment confirming peritoneal irritation and inflammatory markers. 14 He also suggested that inflammatory variables in advanced appendicitis appear to be at least as important discriminators as the clinical descriptors of peritoneal irritation.
Overall, our results showed that CRP has the highest diagnostic accuracy for PA. In the first part of our analysis, a significantly higher median CRP was seen for the PA group than for the AA group (158mg/l vs 30mg/l, p<0.0001). As the ranges of CRP between PA and AA (and even NA) were overlapping, we were not able to provide a cut-off value for the test that would distinguish PA from AA or NA. Despite this, our results show that 50% of the patients with PA had a CRP of >158mg/l whereas 50% of the patients in the AA group had a CRP of <30mg/l.
In the second part of the analysis, the performance of the test was assessed with sensitivity and specificity values at various cut-off levels. For a cut-off level of 10mg/l, the sensitivity of CRP was 100%. This value was lowered when WCC was combined but the combination of the two variables resulted in higher specificity for PA (96%). As sensitivity and specificity values vary depending on the cut-off values taken, we performed an ROC curve analysis to assess the diagnostic accuracy of the test. The AUC for CRP in PA yielded an excellent discriminatory value (0.9322), which was increased only marginally when WCC was added (0.9388). Our results are consistent with those obtained by Käser et al, who reported CRP to be by far the most significant marker of perforation. 29
On the other hand, when assessing the diagnostic accuracy of CRP in AA, the ROC curve analysis only gave a moderate result for the AUC (0.7047). As shown in Figure 1, the ROC curve for WCC alone yielded the highest diagnostic accuracy of all other variables but did not provide good discriminatory power. It was only when WCC was combined with CRP that good discriminatory power was obtained (AUC: 0.8139). This result is in agreement with the metaanalysis by Hallan and Asberg, who concluded that CRP has medium accuracy for diagnosing AA and tended to be a little inferior to that of the total leucocyte count. 30
Apart from WCC and CRP, bilirubin has also been investigated as a marker for predicting AA and its complications. 18–23 In 1969 Miller and Irvine reported that in a series of 120 consecutive cases of AA, jaundice was noted in 7.5% and correlated with positive peritoneal cultures for Escherichia coli. 31 Potential mechanisms that result in hyperbilirubinaemia in AA could be either due to increased haemolysis by E coli and therefore increased bilirubin load 32 or due to endotoxin induced cholestasis. 33 Despite several studies suggesting that patients with clinical appendicitis and hyperbilirubinaemia are more likely to have appendiceal perforation, 18–23 we have been unable to show that hyperbilirubinaemia provides better discriminatory power for PA than CRP and CRP/WCC. Interestingly, the median bilirubin level in PA approached statistical significance (p=0.056) but remained within normal range. The specificity, however, of bilirubin in PA was higher than that of WCC and CRP, and this is in agreement with specificities reported by Emmanuel et al 23 and Käser et al. 29 From our ROC analysis, bilirubin did not improve the diagnostic accuracy for PA when combined with WCC and CRP. Our findings showed that CRP has higher diagnostic accuracy for PA than bilirubin and these mirror results from Käser et al 29 with the largest number of PA cases studied so far (Table 5).
Table 5.
Comparison of sensitivity, specificity and area under the curve from receiver operating characteristic analysis of bilirubin with other studies
| Study | Patients with PA | Cut-off bilirubin level | Sensitivity | Specificity | AUC |
|---|---|---|---|---|---|
| Estrada 19 | 41 | – | – | – | – |
| Sand 20 | 97 | – | 70% | 86% | – |
| Atahan 21 | 45 | – | 77.77% | 87.21% | 0.81 |
| Emmanuel 23 | 45 | – | 60% | 70% | – |
| Käser 29 | 155 | 15µmol/l | 61% | 61% | – |
| Present study | 41 | 15µmol/l | 65% | 68% | 0.801 |
PA = perforated appendicitis; AUC = area under the curve
Apart from raised inflammatory markers predicting AA, we observed that 4.9% of AA cases had normal WCC and CRP. In his meta-analysis, Andersson reported that appendicitis is unlikely when all inflammatory variables are normal. 14 Sengupta et al reported a NPV of 100% for both WCC and CRP in AA, concluding that patients experiencing lower abdominal pain with normal WCC and CRP are unlikely to have appendicitis, and can be sent home. 17 NPVs should be interpreted with caution as they vary depending on the cutoff point taken. For example, we reported a NPV of 100% for CRP in PA when the cut-off value was 10mg/l whereas the NPV was 99% when the cut-off value was 20mg/l. Our results suggest that AA cannot be excluded, even when both WCC and CRP are within normal range, and we agree with the results of Vaughan-Shaw et al. 13 This may be because of a lag in changes of the inflammatory variables with the time of the onset of symptoms. 34
There are potential limitations to this study. First, its retrospective nature makes it susceptible to confounding factors. Our selected study groups were based on histological diagnosis and the patients who were admitted with possible appendicitis but not operated on were therefore not included. Being retrospective and histologically based, this study did not investigate patients taken to theatre for suspected appendicitis but who had another cause for peritonism identified such as a malignancy or a gynaecological cause.
In addition, although blood tests were available within 24 hours prior to surgical intervention and were correlated with the histological findings, the timing of the blood tests with the onset of symptoms could not be retrieved accurately owing to the retrospective nature of the study. Such timing can affect the levels of the inflammatory markers as they may vary during the course of the disease. 1,34 This may affect the sensitivity and specificity of these variables in predicting AA and its complications with time. A large prospective study is needed to investigate the temporal and discriminatory value of WCC, CRP and bilirubin among pyrexia, migratory pain, signs of peritoneal irritation and imaging results in predicting appendicitis and its complications.
Conclusions
Our study involves one of the largest cohorts of patients in the literature that had an appendicectomy for suspected appendicitis and laboratory variables were correlated. We have been unable to show that hyperbilirubinaemia can predict PA as suggested by other studies. 18–23 We have shown that CRP alone or when combined with WCC has excellent discriminatory power for PA. Although it was not possible to identify a cut-off point for CRP predicting PA because of overlapping ranges between AA and PA, our results show that 50% of patients with PA had a CRP of >158mg/l. Together with the presence of migratory history of pain and/or signs of peritoneal inflammation, such a finding may facilitate the surgeon’s decision not to delay an urgent appendicectomy, even out of hours. Finally, our study has shown that normal levels for WCC, CRP and bilirubin cannot exclude AA.
Acknowledgements
Part of this work was performed at Cambridge University Health Partners. It was supported by Cancer Research UK (grant number RG49390) and the Medical Research Council Biostatistics Hub in Trials Methodology Research (grant number G0800860).
The authors would like to thank the histopathology department at Peterborough City Hospital for providing the histological database.
References
- 1.Andrén-Sandberg A, Kørner H. Quantitative and qualitative aspects of diagnosing acute appendicitis. Scand J Surg 2004; 93: 4–9 [DOI] [PubMed] [Google Scholar]
- 2.Ditillo MF, Dziura JD, Rabinovici R. Is it safe to delay appendectomy in adults with acute appendicitis? Ann Surg 2006; 244: 656–660 [DOI] [PMC free article] [PubMed] [Google Scholar]
- 3.Flum DR, Morris A, Koepsell T, Dellinger EP. Has misdiagnosis of appendicitis decreased over time? A population-based analysis. JAMA 2001; 286: 1,748–1,753 [DOI] [PubMed] [Google Scholar]
- 4.Andersson RE, Hugander A, Thulin AJ. Diagnostic accuracy and perforation rate in appendicitis: association with age and sex of the patient and with appendicectomy rate. Eur J Surg 1992; 158: 37–41 [PubMed] [Google Scholar]
- 5.Alvarado A. A practical score for the early diagnosis of acute appendicitis. Ann Emerg Med 1986; 15: 557–564 [DOI] [PubMed] [Google Scholar]
- 6.Kalan M, Talbot D, Cunliffe WJ, Rich AJ. Evaluation of the modified Alvarado score in the diagnosis of acute appendicitis: a prospective study. Ann R Coll Surg Engl 1994; 76: 418–419 [PMC free article] [PubMed] [Google Scholar]
- 7.Terasawa T, Blackmore CC, Bent S, Kohlwes RJ. Systematic review: computed tomography and ultrasonography to detect acute appendicitis in adults and adolescents. Ann Intern Med 2004; 141: 537–546 [DOI] [PubMed] [Google Scholar]
- 8.Pedrosa I, Lafornara M, Pandharipande PVet al Pregnant patients suspected of having acute appendicitis: effect of MR imaging on negative laparotomy rate and appendiceal perforation rate. Radiology 2009; 250: 749–757 [DOI] [PubMed] [Google Scholar]
- 9.Jones PF. Suspected acute appendicitis: trends in management over 30 years. Br J Surg 2001; 88: 1,570–1,577 [DOI] [PubMed] [Google Scholar]
- 10.Vermeulen B, Morabia A, Unger PF. Influence of white cell count on surgical decision making in patients with abdominal pain in the right lower quadrant. Eur J Surg 1995; 161: 483–486 [PubMed] [Google Scholar]
- 11.Birchley D. Patients with clinical acute appendicitis should have pre-operative full blood count and C-reactive protein assays. Ann R Coll Surg Engl 2006; 88: 27–32 [DOI] [PMC free article] [PubMed] [Google Scholar]
- 12.Körner H, Söreide JA, Söndernaa K. Diagnostic accuracy of inflammatory markers in patients operated on for suspected acute appendicitis: a receiver operating characteristic curve analysis. Eur J Surg 1999; 165: 679–685 [DOI] [PubMed] [Google Scholar]
- 13.Vaughan-Shaw PG, Rees JR, Bell Eet al Normal inflammatory markers in appendicitis: evidence from two independent cohort studies. JRSM Short Rep 2011; 2: 43. [DOI] [PMC free article] [PubMed] [Google Scholar]
- 14.Andersson RE. Meta-analysis of the clinical and laboratory diagnosis of appendicitis. Br J Surg 2004; 91: 28–37 [DOI] [PubMed] [Google Scholar]
- 15.Ortega-Deballon P, Ruiz de Adana-Belbel JC, Hernández-Matias Aet al Usefulness of laboratory data in the management of right iliac fossa pain in adults. Dis Colon Rectum 2008; 51: 1,093–1,099 [DOI] [PMC free article] [PubMed] [Google Scholar]
- 16.Grönroos JM, Grönroos P. Leucocyte count and C-reactive protein in the diagnosis of acute appendicitis. Br J Surg 1999; 86: 501–504 [DOI] [PubMed] [Google Scholar]
- 17.Sengupta A, Bax G, Paterson-Brown S. White cell count and C-reactive protein measurement in patients with possible appendicitis. Ann R Coll Surg Engl 2009; 91: 113–115 [DOI] [PMC free article] [PubMed] [Google Scholar]
- 18.Khan S. Elevated serum bilirubin in acute appendicitis: a new diagnostic tool. Kathmandu Univ Med J 2008; 6: 161–165 [PubMed] [Google Scholar]
- 19.Estrada JJ, Petrosyan M, Barnhart Jet al Hyperbilirubinemia in appendicitis: a new predictor of perforation. J Gastrointest Surg 2007; 11: 714–718 [DOI] [PubMed] [Google Scholar]
- 20.Sand M, Bechara FG, Holland-Letz Tet al Diagnostic value of hyperbilirubinemia as a predictive factor for appendiceal perforation in acute appendicitis. Am J Surg 2009; 198: 193–198 [DOI] [PubMed] [Google Scholar]
- 21.Atahan K, Üreyen O, Aslan Eet al Preoperative diagnostic role of hyperbilirubinaemia as a marker of appendix perforation. J Int Med Res 2011; 39: 609–618 [DOI] [PubMed] [Google Scholar]
- 22.McGowan DR, Sims HM, Shaikh I, Uheba M. The value of hyperbilirubinaemia in the diagnosis of acute appendicitis. Ann R Coll Surg Engl 2011; 93: 498. [DOI] [PMC free article] [PubMed] [Google Scholar]
- 23.Emmanuel A, Murchan P, Wilson I, Balfe P. The value of hyperbilirubinaemia in the diagnosis of acute appendicitis. Ann R Coll Surg Engl 2011; 93: 213–217 [DOI] [PMC free article] [PubMed] [Google Scholar]
- 24.Zweig MH, Campbell G. Receiver-operating characteristic (ROC) plots: a fundamental evaluation tool in clinical medicine. Clin Chem 1993; 39: 561–577 [PubMed] [Google Scholar]
- 25.Søreide K, Kørner H, Søreide JA. Diagnostic accuracy and receiver-operating characteristics curve analysis in surgical research and decision making. Ann Surg 2011; 253: 27–34 [DOI] [PubMed] [Google Scholar]
- 26.Flum DR, Koepsell T. The clinical and economic correlates of misdiagnosed appendicitis: nationwide analysis. Arch Surg 2002; 137: 799–804 [DOI] [PubMed] [Google Scholar]
- 27.Körner H, Söndenaa K, Söreide JA. Perforated and non-perforated acute appendicitis – one disease or two entities? Eur J Surg 2001; 167: 525–530 [DOI] [PubMed] [Google Scholar]
- 28.Faiz O, Clark J, Brown Tet al Traditional and laparoscopic appendectomy in adults: outcomes in English NHS hospitals beween 1996 and 2006. Ann Surg 2008; 248: 800–806 [DOI] [PubMed] [Google Scholar]
- 29.Käser SA, Fankhauser F, Willi N, Maurer CA. C-reactive protein is superior to bilirubin for anticipation of perforation in acute appendicitis. Scand J Gastroenterol 2010; 45: 885–892 [DOI] [PubMed] [Google Scholar]
- 30.Hallan S, Asberg A. The accuracy of C-reactive protein in diagnosing acute appendicitis – a meta-analysis. Scand J Clin Lab Invest 1997; 57: 373–380 [DOI] [PubMed] [Google Scholar]
- 31.Miller DF, Irvine RW. Jaundice in acute appendicitis. Lancet 1969; 1: 321–323 [DOI] [PubMed] [Google Scholar]
- 32.Chand N, Sanyal AJ. Sepsis-induced cholestasis. Hepatology 2007; 45: 230–241 [DOI] [PubMed] [Google Scholar]
- 33.Bolder U, Ton-Nu HT, Schteingart CDet al Hepatocyte transport of bile acids and organic anions in endotoxemic rats: impaired uptake and secretion. Gastroenterology 1997; 112: 214–225 [DOI] [PubMed] [Google Scholar]
- 34.Wu HP, Huang CY, Chang YJet al Use of changes over time in serum inflammatory parameters in patients with equivocal appendicitis. Surgery 2006; 139: 789–796 [DOI] [PubMed] [Google Scholar]