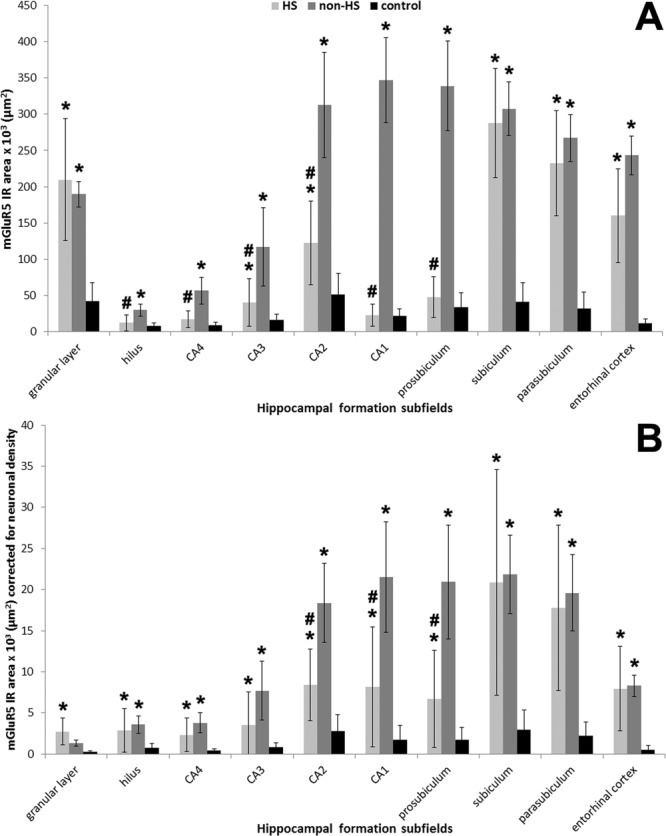
FIGURE 6.

mGluR5 quantification in different subfields of the hippocampal formation. (A) mGluR5 expression without neuronal density correction revealed increased IR area in all subfields of non-HS (gray bars) as compared to controls (black bars). HS (light gray bars) mGluR5 expression in the hilus, CA1–4, and prosubiculum were lower than in non-HS. (B) mGluR5 IR area levels per neuron (i.e., corrected for neuron densities) showed upregulation in all hippocampal formation subfields of HS and non-HS cases when compared to controls. CA2, CA1, and prosubiculum mGluR5 levels per neuron in HS cases were lower than in non-HS cases. Values indicated as mean ± std. deviation. Asterisk indicate significant statistical difference (P < 0.05) between epileptic and control group. Hash sign indicate significant statistical difference (P < 0.05) between epileptic groups.
