

Abstract
We report a GWAS of alcohol dependence (AD) in European-American (EA) and African-American (AA) populations, with replication in independent samples of EAs, AAs and Germans. Our sample for discovery and replication was 16 087 subjects, the largest sample for AD GWAS to date. Numerous genome-wide significant (GWS) associations were identified, many novel. Most associations were population specific, but in several cases were GWS in EAs and AAs for different SNPs at the same locus, showing biological convergence across populations. We confirmed well-known risk loci mapped to alcohol-metabolizing enzyme genes, notably ADH1B (EAs: Arg48His, P = 1.17 × 10⁻³¹; AAs: Arg369Cys, P = 6.33 × 10⁻¹⁷) and ADH1C in AAs (Thr151Thr, P = 4.94 × 10⁻¹⁰), and identified novel risk loci mapping to the ADH gene cluster on chromosome 4 and extending centromerically beyond it to include GWS associations at LOC100507053 in AAs (P = 2.63 × 10⁻¹¹), PDLIM5 in EAs (P = 2.01 × 10⁻⁸), and METAP in AAs (P = 3.35 × 10⁻⁸). We also identified a novel GWS association (1.17 × 10⁻¹⁰) mapped to chromosome 2 at rs1437396, between MTIF2 and CCDC88A, across all of the EA and AA cohorts, with supportive gene expression evidence, and population-specific GWS for markers on chromosomes 5, 9 and 19. Several of the novel associations implicate direct involvement of, or interaction with, genes previously identified as schizophrenia risk loci. Confirmation of known AD risk loci supports the overall validity of the study; the novel loci are worthy of genetic and biological follow-up. The findings support a convergence of risk genes (but not necessarily risk alleles) between populations, and, to a lesser extent, between psychiatric traits.
Keywords: alcohol dependence, alcohol-metabolizing enzymes, complex traits, genome-wide association, population differences, population-specific alleles
INTRODUCTION
Genome-wide association study (GWAS) is a necessary step in the identification of risk genes for complex traits that has only recently been applied to gene mapping for substance dependence (SD) traits. We previously reported risk genes identified by GWAS for cocaine and opioid dependence.1,2 Numerous studies have been published for nicotine dependence (ND).3 Alcohol dependence (AD) is the next most studied SD trait.
AD is moderately heritable, with heritability in most studies estimated to be 0.50–0.60.4 Pre-GWAS, risk-influencing alleles were identified for AD via genetic linkage analysis, candidate gene association analysis and the productive use of endophenotypes. The best known and replicated risk alleles map to alcohol-metabolizing enzyme genes, especially ADH1B,5 ADH1C6 and ADH4,7 on chromosome 4 and the chromosome 12 locus ALDH2.8 In some Asian populations, protective alleles at these loci are common, resulting in either delayed degradation or increased production of the toxic alcohol metabolite acetaldehyde.
Using the conventional genome-wide significance (GWS) criterion for GWAS (P ≤ 5 × 10⁻⁸), few studies have reported AD-relevant GWS. In European-ancestry populations, Treutlein et al.9 reported association with SNPs mapped to chromosome 2q35, and Schumann et al.10 reported association at the AUTS2 locus. Frank et al.11 reported association with rs1789891, which maps between ADH1B and ADH1C. Zuo et al.,12 in a re-analysis of publicly available data, identified association near SERINC2. In Asian populations, Park et al.13 reported association with multiple markers mapped to the chromosome 4 ADH cluster, in a Korean sample, and we14 identified GWS association to ALDH2 in a Chinese population. Both of the Asian samples were small for GWAS, but the AD risk loci had relatively large effects on phenotype. Several groups have used quantitative traits to increase power. Using a symptom count phenotype, Wang et al.15 identified a significant association of AD with C15orf53.
There are no published GWAS studies of African ancestry populations with GWS results. We used GWAS to identify genetic variants that influence risk of AD as both a diagnosis and an ordinal trait in European-American (EA) and African-American (AA) subjects, including our GWAS sample of 5641 subjects combined with the study of addiction: genetics and environment (SAGE) sample of 4061, which is available to researchers through dbGAP application. Results for the diagnosis were replicated in two additional samples: an identically ascertained sample that we collected and a German sample collected previously.9 The ordinal trait results were replicated in our own additional subjects. The total sample (16 087 subjects) included the following: 5697 (GWAS discovery), 2545 (our identically ascertained replication sample), 3784 (German sample) and 4061 (SAGE, included with our samples for GWAS). Of these, there have been no previous reports regarding alcohol dependence GWAS in the first two sets, comprising 8242 subjects.
MATERIALS AND METHODS
Subjects and diagnostic procedures
Our GWAS discovery samples (‘GCD sample’) included 2379 EA and 3318 AA subjects. A second identically ascertained GCD sample comprising 1746 EA and 803 AA subjects was used for replication. All subjects were recruited for studies of the genetics of drug (opioid or cocaine) or alcohol dependence.1,2 The sample consisted of small nuclear families (SNFs) originally collected for linkage studies and unrelated individuals. Subjects (Table 1) gave written informed consent as approved by the institutional review board at each site, and certificates of confidentiality were obtained from NIDA and NIAAA. Subjects were administered the semi-structured assessment for drug dependence and alcoholism (SSADDA)16 to derive DSM-IV diagnoses17 of lifetime AD and other major psychiatric traits.
Table 1.
Sample characteristics
| GCD |
GWAS Sample
|
Replication Sample (GWAS)
|
||||||
|---|---|---|---|---|---|---|---|---|
|
AA
|
EA
|
AA
|
EA
|
|||||
| Male | Female | Male | Female | Male | Female | Male | Female | |
| Recruiting site | ||||||||
| Yale (APT Foundation) | 652 | 627 | 626 | 398 | 222 | 197 | 474 | 477 |
| University of CT | 629 | 582 | 606 | 457 | 127 | 93 | 315 | 299 |
| MUSC | 95 | 193 | 85 | 76 | 21 | 24 | 47 | 47 |
| McLean Hospital | 54 | 42 | 60 | 41 | 0 | 2 | 2 | 3 |
| University of Pennsylvania | 297 | 147 | 20 | 10 | 51 | 64 | 43 | 39 |
|
AA
|
EA
|
AA
|
EA
|
|||||
| Male | Female | Male | Female | Male | Female | Male | Female | |
|
| ||||||||
| SAGE | 643 | 668 | 1222 | 1530 | ||||
| German Sample | 2367 | 1410 | ||||||
|
| ||||||||
| Counts for Analyses |
Cases
|
Controls
|
||||||
|
AA
|
EA
|
AA
|
EA
|
|||||
| Male | Female | Male | Female | Male | Female | Male | Female | |
|
| ||||||||
| Case–control | ||||||||
| GCD GWAS | 1022 | 717 | 900 | 523 | 454 | 709 | 213 | 283 |
| GCD Replication | 209 | 115 | 294 | 175 | 122 | 205 | 417 | 581 |
| SAGE | 413 | 263 | 761 | 485 | 230 | 405 | 461 | 1045 |
| German Sample | 1369 | 431 | 998 | 979 | ||||
| Ordinal trait | ||||||||
| GCD GWAS | 1727 | 1591 | 1397 | 982 | ||||
| GCD Replication | 421 | 380 | 881 | 865 | ||||
| SAGE | 643 | 668 | 1222 | 1530 | ||||
Discovery phase analyses also included publicly available (via application) GWAS data from SAGE (http://www.ncbi.nlm.nih.gov/projects/gap/cgi-bin/study.cgi?study_id=phs000092.v1.p1), containing 1311 AA and 2750 EA unrelated individuals (Table 1). It is described in more detail in Supplementary Materials. A German sample of 1806 AD and 1978 control subjects was used for replication.9 Ordinal trait information was not available to us for these subjects, and the controls were not ascertained for exposure to alcohol and may include alcohol abusers.
Genotyping and quality control
GCD GWAS samples were genotyped on the Illumina HumanOmni1-Quad v1.0 microarray containing 988 306 autosomal SNPs, at the Center for Inherited Disease Research (CIDR) and the Yale Center for Genome Analysis. Genotypes were called using GenomeStudio software V2011.1 and genotyping module V1.8.4 (Illumina, San Diego, CA, USA). The SAGE samples were genotyped on the Illumina Human 1 M array containing 1 069 796 total SNPs. Follow-up genotyping in the replication sample was performed using a custom Illumina GoldenGate Genotyping Universal-32, 1536-plex microarray. Most SNPs included in the custom array were initially selected for studies of other phenotypes. A small number of additional SNPs were genotyped individually in our replication sample and in the German sample using TaqMan.18 In the primary GWAS data set, 44 644 SNPs on the microarray and 135 individuals with call rates <98% were excluded, and 62 076 additional SNPs were removed before imputation because of minor allele frequencies (MAF) <1%. After data cleaning and quality control, 5697 individuals and 889 659 SNPs remained for imputation. Further QC information and genotype imputation methods are found in Supplementary Materials. After applying the same QC procedures to the SAGE sample, 39 subjects with call rates <98% were excluded and 726 191 SNPs remained for analysis.
To verify and correct the misclassification of self-reported race, we compared the GWAS data from all subjects with genotypes from the HapMap 3 reference CEU, YRI and CHB populations. Principal component (PC) analysis was conducted in the entire GWAS sample using Eigensoft19,20 and 145 472 SNPs that were common to the GWAS data set and HapMap panel (after pruning the GWAS SNPs for linkage disequilibrium (LD) (r2) >80%) to characterize the underlying genetic architecture of the samples. The first PC score distinguished AAs and EAs; these groups were subsequently analyzed separately. We then conducted PC analyses within the two groups, and the first three PCs were used in all subsequent analyses to correct for residual population stratification.
Analytical models
Association analyses were performed using two models. The first model used the imputed minor allele dosage as the dependent variable and the DSM-IV symptom count for AD and the three other major SD diagnoses (cocaine, opioid and nicotine dependence: CD, OD and ND, respectively) as ordinal predictors (adjusted for sex, age and the first three ancestry PCs). The mutual adjustment of AD for measures of dependence on other substances facilitated the identification of SNPs unique to AD and limited confounding because of comorbid dependencies. All individuals contributed to this analysis, including those meeting no DSM-IV criteria for AD and those meeting all criteria. Subjects who reported having less than one full drink ever, including those who endorsed having a sip of alcohol at a religious ceremony, were excluded. This ordinal trait model has greater power to detect genetic associations than a univariate model based on disease status because of greater information content and improved specificity of the dependence measure. Ordinal trait data were derived for all samples included in the study except the German sample.
We also applied a case–control approach in which AD status was the outcome in models that included as controls only individuals who had consumed alcohol at least once without becoming dependent. Subjects who met criteria for alcohol abuse were excluded from this analysis and considered ‘unknown’ diagnostically.
Statistical analysis methods
Association tests were performed using linear or logistic association random effect models embedded in generalized estimating equations (GEE) to correct for correlations among related individuals.21 The results were unchanged when we used mixed models. Data sets containing unrelated individuals only were evaluated using linear and logistic models. Models in the German data set (PC information unavailable) were adjusted for age and sex only. Analyses were performed separately within each data set and population group, and the results were combined by meta-analysis using the inverse variance method implemented in the computer program METAL.22
A P-value of 5.0 × 10⁻⁸ was the threshold for GWS in the GWAS. Results were not adjusted for testing in two populations because we tested three distinct a priori hypotheses: SNPs are associated with AD and related traits in AAs; SNPs are associated with AD and related traits in EAs; and associations are evident with the same SNPs meta-analyzed in AAs and EAs. Results were not adjusted for testing two measures of AD, which are highly correlated: the rank order correlation between the symptom count and case–control variables is 1.0 (that is, no affected subject can have a lower symptom count than a control), and the point-biserial correlation is 0.90. In the replication analyses, we tested in each model and population whether the percentage of False Discovery Rate (FDR) q-values that were <0.05 was greater than would be expected by chance.
Expression analysis
Rs1437396, a variant that was significantly associated with AD in this study, is located between two genes at a position 9.5 kb downstream from the transcription stop site of CCDC88A and 9.0 kb upstream from the transcription start site of MTIF2. The functional relevance of these two genes was evaluated23 using publicly available data (http://www.utexas.edu/research/wcaar/manuscripts.html). We also evaluated PDLIM5, METAP1, ADH5 and DPP9 for AD-associated expression changes. Ponomarev et al.23 compared the transcriptomes of brains from alcohol-dependent subjects to those of brains from control subjects using the Illumina HumanHT-12 expression array, focusing on three different brain regions: the central nucleus (CNA) and basolateral nucleus (BLA) of the amygdala and the superior frontal cortex (CTX). Post-mortem brain tissue samples were collected from 17 Australian alcoholics and 15 demographically matched controls. Diagnoses were made after consulting multiple sources of information, including medical records and next-of-kin. One array probe (ILMN_1765520) mapped to MTIF2 and one (ILMN_1811050) mapped to CCDC88A. Probes also mapped to the other loci noted above (Supplementary Table S3).
RESULTS
After imputation using the 1000 Genomes reference panel excluding SNPs with MAF <3% in both AAs and EAs, 10 421 983 SNPs common to both discovery data sets (9,519,112 in AAs, 6,331,841 in EAs) were included in association analyses. There was little evidence for inflation of P-values in AAs but some in EAs (Supplementary Figure S1).
Ordinal trait analysis
Numerous variants were GWS. The greatest number of significant findings map to the region of the chromosome 4 ADH gene cluster, extending centromerically beyond that cluster. There were also GWS signals that map to intergenic regions of chromosomes 2 and 5, and individual GWS SNPs on chromosomes 9 and 19 (Supplementary Tables 2/S1).
On chromosome 4q, we found multiple GWS associations with SNPs in or near PDLIM5 (PDZ and LIM Domain 5), METAP1 (methionyl aminopeptidase 1), LOC100507053 (a lncRNA gene), ADH1B and ADH1C (Figures 1a and b). The most relevant segment of LOC100507053 maps between ADH1A and ADH1B. The support for PDLIM5, near ADH5, comes mostly from the SAGE sample, a unique occurrence. All of the ~50 GWS associations observed in the chromosome 4q region are population specific; in many cases, there are major population differences in allele frequencies. Nevertheless, there is strong evidence for association with LOC100507053 and ADH1B in both AAs and EAs, most notably ADH1B SNPs rs1229984 (Arg48His) in EAs (P = 1.85 × 10⁻²³) and rs2066702 (Arg369Cys) in AAs (P = 6.33 × 10⁻¹⁷).
Figure 1.
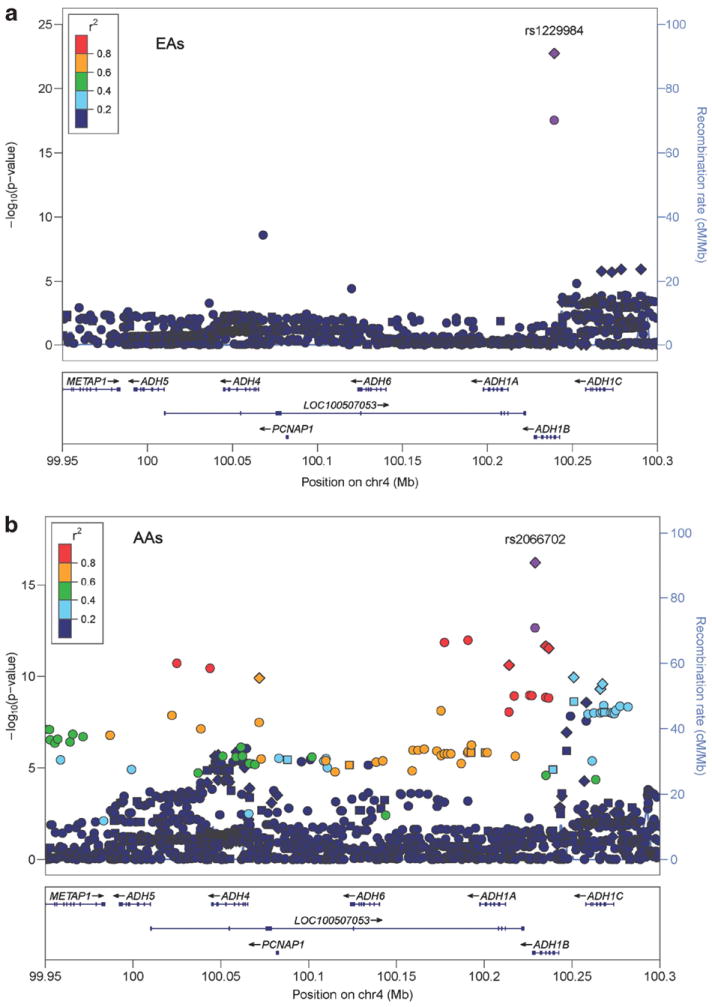
Chromosome 4 regional Manhattan plots. (a) European-Americans: regional Manhattan plot for the ADH gene cluster and adjacent regions on chromosome 4 showing the adjusted symptom count meta-analysis P-values from the discovery sample EAs, as well as points for the meta-analysis results after including our replication sample (diamonds). The points are colored based on degree of LD with rs1229984. Square points indicate genotyped SNPs and round points indicate imputed SNPs. All SNPs in the replication sample were genotyped. Data include the GCD sample plus SAGE, and GCD and German replication samples (diamonds). (b) African-Americans: regional Manhattan plot for the ADH gene cluster and adjacent regions on chromosome 4 showing the adjusted symptom count meta-analysis P-values from AAs in the discovery sample, as well as points for the meta-analysis result after inclusion of our replication sample (diamonds). The points are colored based on degree of LD with rs2066702. Square points indicate genotyped SNPs and round points indicate imputed SNPs. All SNPs in the replication sample were genotyped. Data include the GCD sample plus SAGE and the GCD replication sample (diamonds). AA, African-American; EA, European-American; LD, linkage disequilibrium; SAGE, study of addiction: genetics and environment.
Conditional models were tested to evaluate evidence in EAs and AAs for contributions from multiple independent risk loci in the region containing ADH1B, LOC100507053, ADH1C, PDLIM5 and METAP1. These models incorporated pairwise combinations of the most significant SNPs in each of the genes. They showed that in EAs the signal at rs1229984 in ADH1B remained highly significant after adjustment for rs116203444 in LOC100507053 (Prs1229984 = 4.41 × 10⁻¹⁴) or rs11724023 in PDLIM5 (Prs1229984 = 4.65 × 10⁻¹¹), but rs116203444 was not significant after adjustment for the ADH1B*rs1229984 (P = 0.06). PDLIM5*rs11724023 remained significant after adjusting for either of the other SNPs, with similar adjusted P-values (Prs11724023 = 7.73 × 10⁻⁷, Prs11724023 = 7.73 × 10⁻⁷). In AAs, the SNPs in ADH1B and LOC100507053 are highly correlated, and mutual adjustment rendered both P-values non-significant. The association in METAP1 was no longer significant after adjustment for either ADH1B or LOC100507053. Although attenuated, ADH1C remained significant after adjustment for any of the other three loci tested. Conditioning on ADH1B caused the greatest attenuation (Prs12639833 = 0.01). Thus, our results support the presence in both populations of multiple independent risk loci in this region.
Two closely mapped chromosome 2 SNPs, rs7371606 and rs925966, were associated with AD at P < 4 × 10⁻⁸ in EAs. They map between DARS (aspartyl-tRNA synthetase) and CXCR4 (chemokine (C-X-C motif) receptor 4), and are distant from both. Several markers spanning <3500 bp on chromosome 5p (minimal P = 8.59 × 10⁻⁹ at rs1493464) in a ‘gene desert’ were associated in AAs. A common intergenic chromosome 9 SNP, rs1856202, was associated in AAs (P = 5.99 × 10⁻¹¹) and a common intronic SNP in DPP9 (dipeptidylpeptidase 9), rs113683471, was associated in EAs (P = 2.89 × 10⁻⁸) (Table 2, Figure 2).
Table 2.
Summary of significant results for the adjusted ordinal model–GWAS sample
| African-Americans | European-Americans | All | |||||||||||||||||
|---|---|---|---|---|---|---|---|---|---|---|---|---|---|---|---|---|---|---|---|
|
| |||||||||||||||||||
| Chr | BP | SNP | Effect allele |
Ref allele | EAF AA | EAF EA | SNP Type |
Gene | GCD P | GCD Beta | SAGE P | SAGE Beta |
Meta P | GCD P | GCD Beta | SAGE P | SAGE Beta |
Meta P | Meta P |
| 2 | 136806959 | rs925966 | C | G | 0.35 | 0.62 | NA | NA | 5.55E-01 | − 0.003 | 8.58E-01 | 0.002 | 6.86E-01 | 7.87E-05 | 0.02 | 4.68E-05 | 0.03 | 1.43E-08 | 1.27E-04 |
| 4 | 95583827 | rs10031423 | C | T | 0.46 | 0.42 | INT | PDLIM5 | 3.79E-01 | − 0.005 | 4.98E-01 | − 0.01 | 2.69E-01 | 2.04E-02 | − 0.01 | 3.69E-08 | − 0.04 | 2.01E-08 | 1.37E-06 |
| 4 | 99930740 | rs58521602 | G | A | 0.2 | 0.01 | INT | METAP1 | 3.27E-06 | − 0.02 | 2.94E-03 | − 0.02 | 3.35E-08 | a | a | a | a | a | 3.35E-08 |
| 4 | 99985350 | rs139164451 | CT | C | 0.19 | 0.01 | NA | NA | 1.07E-06 | − 0.02 | 1.29E-03 | − 0.02 | 5.13E-09 | a | a | a | a | a | 5.13E-09 |
| 4 | 100025015 | rs28470942 | T | C | 0.17 | 0.01 | INT | LOC100507053 | 3.41E-08 | − 0.02 | 1.26E-04 | − 0.03 | 1.91E-11 | a | a | a | a | a | 1.91E-11 |
| 4 | 100043933 | rs28542574 | A | G | 0.16 | 0.01 | INT | LOC100507053 | 1.43E-07 | − 0.02 | 4.77E-05 | − 0.03 | 3.62E-11 | a | a | a | a | a | 3.62E-11 |
| 4 | 100068114 | rs116203444 | C | T | 0.01 | 0.04 | INT | LOC100507053 | a | a | a | a | a | 8.99E-08 | − 0.01 | 1.51E-03 | − 0.006 | 2.46E-09 | 2.46E-09 |
| 4 | 100190805 | rs28864441 | T | C | 0.19 | 0.01 | INT | LOC100507053 | 6.64E-09 | − 0.02 | 3.22E-05 | − 0.03 | 1.06E-12 | a | a | a | a | a | 1.06E-12 |
| 4 | 100225992 | rs1693458 | T | C | 0.23 | 0.18 | NA | NA | 4.79E-07 | − 0.02 | 5.72E-04 | − 0.03 | 1.09E-09 | 7.96E-01 | − 0.001 | 4.90E-01 | 0.004 | 7.42E-01 | 7.52E-05 |
| 4 | 100227212 | rs3133155 | G | C | 0.23 | 0.18 | R3 | ADH1B | 4.29E-07 | − 0.02 | 6.74E-04 | − 0.03 | 1.13E-09 | 8.00E-01 | − 0.001 | 4.90E-01 | 0.004 | 7.39E-01 | 7.73E-05 |
| 4 | 100229017 | rs2066702 | A | G | 0.19 | 0.01 | NSM | ADH1B | 2.18E-09 | − 0.02 | 2.04E-05 | − 0.03 | 2.24E-13 | a | a | a | a | a | 2.24E-13 |
| 4 | 100235053 | rs1789882 | A | G | 0.23 | 0.18 | SYN | ADH1B | 6.01E-07 | − 0.02 | 5.78E-04 | − 0.03 | 1.39E-09 | 8.15E-01 | − 0.001 | 4.94E-01 | 0.004 | 7.33E-01 | 8.71E-05 |
| 4 | 100236762 | rs1693457 | C | T | 0.23 | 0.18 | INT | ADH1B | 5.91E-07 | − 0.02 | 6.49E-04 | − 0.03 | 1.51E-09 | 7.65E-01 | − 0.001 | 5.29E-01 | 0.003 | 7.97E-01 | 7.03E-05 |
| 4 | 100239319 | rs1229984 | T | C | 0.02 | 0.06 | NSM | ADH1B | a | a | a | a | a | 6.75E-14 | − 0.02 | 8.07E-07 | − 0.02 | 2.91E-18 | 2.91E-18 |
| 4 | 100249210 | rs2213042 | C | T | 0.52 | 0.29 | NA | NA | 1.48E-07 | − 0.03 | 2.26E-02 | − 0.02 | 1.49E-08 | 9.81E-01 | 0.000 | 8.79E-01 | − 0.001 | 8.98E-01 | 6.54E-05 |
| 4 | 100250970 | rs2173201 | A | C | 0.44 | 0.22 | NA | NA | 4.54E-07 | − 0.03 | 1.42E-03 | − 0.03 | 2.39E-09 | a | a | 6.04E-01 | − 0.003 | a | 4.56E-07 |
| 4 | 100256164 | rs58223772 | T | TC | 0.45 | 0.22 | NA | NA | 2.02E-07 | − 0.03 | 4.61E-03 | − 0.03 | 3.46E-09 | a | a | 4.45E-01 | − 0.004 | a | 2.67E-07 |
| 4 | 100258155 | rs1614972 | T | C | 0.52 | 0.3 | INT | ADH1C | 1.82E-07 | − 0.03 | 3.17E-02 | − 0.02 | 2.70E-08 | 9.49E-01 | 0.000 | 8.29E-01 | − 0.001 | 8.40E-01 | 7.03E-05 |
| 4 | 100259126 | rs3846449 | C | T | 0.45 | 0.22 | INT | ADH1C | 5.87E-07 | − 0.03 | 5.44E-03 | − 0.03 | 1.14E-08 | a | a | 5.57E-01 | − 0.003 | a | 1.06E-06 |
| 4 | 100262547 | rs2009181 | G | A | 0.45 | 0.22 | INT | ADH1C | 6.68E-07 | − 0.03 | 4.15E-03 | − 0.03 | 9.83E-09 | a | a | 5.49E-01 | − 0.003 | a | 9.27E-07 |
| 4 | 100266133 | rs2241894 | C | T | 0.45 | 0.22 | SYN | ADH1C | 6.65E-07 | − 0.03 | 4.15E-03 | − 0.03 | 9.79E-09 | a | a | 5.48E-01 | − 0.004 | a | 9.20E-07 |
| 4 | 100267372 | rs12639833 | T | C | 0.45 | 0.22 | INT | ADH1C | 5.97E-07 | − 0.03 | 4.04E-03 | − 0.03 | 8.59E-09 | a | a | 5.52E-01 | − 0.003 | a | 8.57E-07 |
| 4 | 100268131 | rs3762896 | T | C | 0.46 | 0.25 | INT | ADH1C | 7.83E-07 | − 0.03 | 1.33E-03 | − 0.03 | 3.86E-09 | 6.77E-01 | 0.002 | 6.91E-01 | − 0.002 | 9.94E-01 | 4.87E-05 |
| 4 | 100268553 | rs4147542 | C | T | 0.46 | 0.25 | INT | ADH1C | 1.51E-06 | − 0.03 | 1.66E-03 | − 0.03 | 9.14E-09 | 6.61E-01 | 0.002 | 6.91E-01 | − 0.002 | 9.94E-01 | 7.75E-05 |
| 4 | 100272147 | rs6846835 | C | T | 0.46 | 0.25 | INT | ADH1C | 1.36E-06 | − 0.03 | 1.94E-03 | − 0.03 | 9.51E-09 | 6.70E-01 | 0.002 | 8.80E-01 | − 0.001 | 8.57E-01 | 1.32E-04 |
| 4 | 100273173 | rs11936869 | C | G | 0.46 | 0.25 | INT | ADH1C | 1.46E-06 | − 0.03 | 1.96E-03 | − 0.03 | 1.03E-08 | 6.61E-01 | 0.002 | 6.91E-01 | − 0.002 | 9.94E-01 | 8.22E-05 |
| 4 | 100274157 | rs4147541 | G | C | 0.46 | 0.25 | R5 | ADH1C | 1.45E-06 | − 0.03 | 2.04E-03 | − 0.03 | 1.06E-08 | 6.61E-01 | 0.002 | 6.86E-01 | − 0.002 | 9.98E-01 | 8.22E-05 |
| 4 | 100274983 | rs11499824 | T | C | 0.46 | 0.25 | R5 | ADH1C | 1.01E-06 | − 0.03 | 1.99E-03 | − 0.03 | 7.25E-09 | 6.59E-01 | 0.002 | 7.20E-01 | − 0.002 | 9.70E-01 | 7.60E-05 |
| 4 | 100277432 | rs10006545 | A | G | 0.46 | 0.25 | NA | NA | 7.35E-07 | − 0.03 | 1.56E-03 | − 0.03 | 4.21E-09 | 6.92E-01 | 0.002 | 7.00E-01 | − 0.002 | 9.90E-01 | 5.00E-05 |
| 4 | 100281893 | rs10031168 | C | T | 0.46 | 0.25 | NA | NA | 7.21E-07 | − 0.03 | 1.74E-03 | − 0.03 | 4.57E-09 | 6.92E-01 | 0.002 | 7.05E-01 | − 0.002 | 9.94E-01 | 5.28E-05 |
| 5 | 4082501 | rs1493464 | A | G | 0.42 | 0.56 | NA | NA | 1.19E-04 | 0.02 | 2.68E-06 | 0.04 | 8.59E-09 | 5.27E-01 | 0.004 | 2.87E-01 | − 0.008 | 7.27E-01 | 2.06E-04 |
| 9 | 33661286 | rs1856202 | A | G | 0.47 | 0.17 | NA | NA | 3.48E-10 | 0.03 | 2.07E-02 | 0.02 | 5.99E-11 | 5.13E-01 | 0.003 | 4.85E-01 | 0.008 | 3.39E-01 | 1.99E-07 |
| 19 | 4680424 | rs113683471/rs59514816 | G | GAAAAAC | 0.29 | 0.69 | INT | LOC100131094 | 9.53E-01 | 0.0003 | 3.06E-01 | − 0.01 | 6.21E-01 | 1.27E-03 | 0.02 | 4.67E-06 | 0.03 | 2.89E-08 | 2.32E-04 |
Abbreviations: BP, base pairs; beta, beta coefficient for the DSM-IV alcohol dependence symptom count; EAF, effect allele frequency; SNP type: INT, intronic; NA, other; NSM, non-synonymous; SYN, synonymous. Results for a SNP are presented if they reached P = 5 × 10⁻⁸ in the overall meta-analysis, the EA meta-analysis or the AA meta-analysis. A more detailed version of this table is included as Supplementary Table S1. Multiple alleles in a column indicate insertion/deletion polymorphisms.
Not tested because of low minor allele frequency, poor imputation quality or model convergence error. Bold and italic indicates genomewide significant results.
Figure 2.
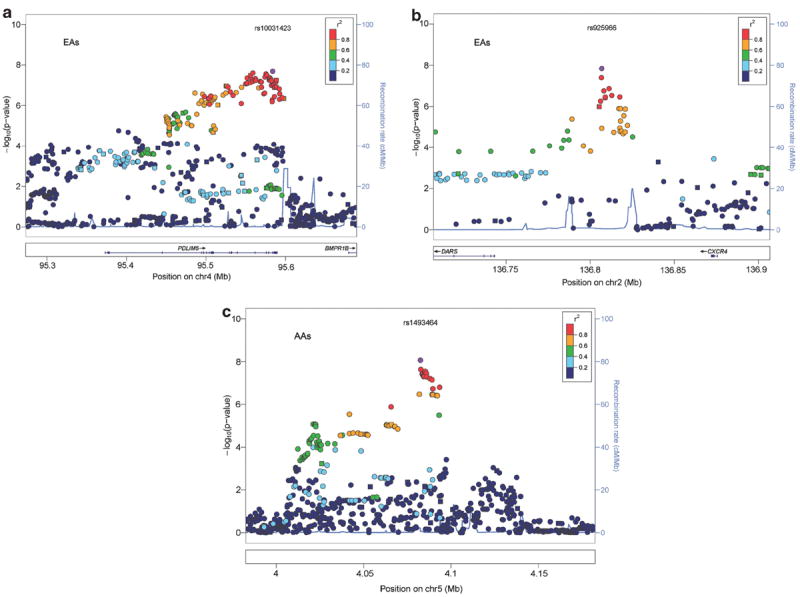
(a) Chromosome 2 regional Manhattan plot in European-Americans: regional Manhattan plot for the 136.70–136.90 MB region on chromosome 2 showing the adjusted symptom count meta-analysis P-values from EAs in the discovery sample. The points are colored based on the LD with rs925966. Square points indicate genotyped SNPs and round points indicate imputed SNPs. Data include the GCD sample plus SAGE. (b) Chromosome 4 PDLIM5 region in EAs: regional Manhattan plot for the 95.27–95.69 MB region containing PDLIM5 on chromosome 4 showing the adjusted symptom count meta-analysis P-values from EAs in the discovery sample. The points are colored based on the LD with rs10031423. Square points indicate genotyped SNPs and round points indicate imputed SNPs. Data include the GCD sample plus SAGE. (c) Chromosome 5 regional Manhattan plot in African-Americans: regional Manhattan plot for the 3.98–4.18 MB region on chromosome 5 showing the adjusted symptom count meta-analysis P-values from AAs in the discovery sample. The points are colored based on degree of LD with rs1493464. Square points indicate genotyped SNPs and round points indicate imputed SNPs. Data include the GCD sample plus SAGE. AA, African-American; EA, European-American; LD, linkage disequilibrium; SAGE, study of addiction: genetics and environment.
Case–control analysis
Case–control analysis identified GWS association with many of the SNPs in ADH1B and LOC100507053 that were identified by ordinal analysis, but the results were not as robust (Supplementary Table S2). Although there were no well-supported GWS findings outside of this region, some evidence of association (P < 1 × 10⁻⁶) was observed with SNPs at 19 other loci, including rs99998785, which is ~17 kb from a (GWS) SNP (rs925966) in the ordinal trait analyses.
Replication of top findings
Sixteen of the chromosome 4 SNPs in the GWAS sample that were GWS in the ordinal trait analyses were genotyped in our identically assessed replication sample. All were at least nominally significant, and the percentage of significant FDR q-values was greater than would be expected by chance in each model and population (AA case-control = 31%, AA ordinal = 39%, EA case-control = 17%, EA ordinal = 62%, German sample = 67%). Six SNPs were significant at P < 0.001, including ADH1B SNPs rs2066702 (P = 3.20 × 10⁻⁵) in AAs and rs1229984 (P = 1.14 × 10⁻⁶) in EAs (Table 3a). The results became more significant in the meta-analysis of the discovery and replication samples. In the case–control analysis, 13 of the SNPs were nominally significant in at least one replication sample (Table 3b). Genotype data for five of the chromosome 4 SNPs were also available in the German sample. Results for four SNPs (rs17028615, rs904092, rs1789882 and rs1693457) that were below the GWS threshold in the GWAS sample became GWS in the meta-analysis of all data sets. An additional SNP, rs4699741, nearly reached this threshold (P = 6.11 × 10⁻⁸). Further, an intergenic SNP on chromosome 2 between MTIF2 and PRORSD1P was significant after pooling results from the case–control analysis of all AA and EA data sets (P = 1.17 × 10⁻¹⁰), although the effect was evident primarily in EAs. Because information required for the ordinal trait analyses was unavailable in the German sample, it is unclear whether this finding would be stronger in a quantitative trait model of AD.
Table 3.
a. Results including replications samples: ordinal results
| Chr | BP | SNP | a1 | a2 | SNP Type | Gene | Discovery
|
Replication
|
Total
|
||||
|---|---|---|---|---|---|---|---|---|---|---|---|---|---|
| Meta AA P | Meta EA P | Rep AA P | Rep EA P | Meta AA P | Meta EA P | Combined Meta P | |||||||
| 4 | 100043933 | rs28542574 | A | G | INT | LOC100507053 | 3.62E-11 | a | a | a | 3.62E-11 | a | 3.62E-11 |
| 4 | 100071924 | rs17028615 | G | A | INT | LOC100507053 | 3.25E-08 | a | 5.32E-04 | 9.02E-01 | 1.33E-10 | a | 2.88E-08 |
| 4 | 100214164 | rs904092 | A | G | INT | LOC100507053 | 8.73E-09 | 7.16E-01 | 3.85E-04 | 5.14E-01 | 2.63E-11 | 9.96E-01 | 9.02E-06 |
| 4 | 100225992 | rs1693458 | T | C | NA | NA | 1.09E-09 | 7.42E-01 | a | a | 1.09E-09 | 7.42E-01 | 7.52E-05 |
| 4 | 100229017 | rs2066702 | A | G | NSM | ADH1B | 2.24E-13 | a | 3.20E-05 | 8.57E-01 | 6.33E-17 | a | 1.50E-13 |
| 4 | 100235053 | rs1789882 | A | G | SYN | ADH1B | 1.39E-09 | 7.33E-01 | 1.99E-04 | 8.08E-01 | 2.37E-12 | 8.60E-01 | 5.93E-06 |
| 4 | 100236762 | rs1693457 | C | T | INT | ADH1B | 1.51E-09 | 7.97E-01 | 2.65E-04 | 7.28E-01 | 3.15E-12 | 9.60E-01 | 4.32E-06 |
| 4 | 100239319 | rs1229984 | T | C | NSM | ADH1B | a | 2.91E-18 | 3.38E-01 | 1.14E-06 | a | 1.85E-23 | 1.52E-22 |
| 4 | 100249210 | rs2213042 | C | T | NA | NA | 1.49E-08 | 8.98E-01 | a | a | 1.49E-08 | 8.98E-01 | 6.54E-05 |
| 4 | 100250970 | rs2173201 | A | C | NA | NA | 2.39E-09 | a | 1.47E-02 | 2.30E-01 | 1.13E-10 | 7.42E-01 | 5.21E-06 |
| 4 | 100258155 | rs1614972 | T | C | INT | ADH1C | 2.70E-08 | 8.40E-01 | 3.37E-02 | 7.40E-01 | 2.68E-09 | 9.92E-01 | 7.40E-05 |
| 4 | 100266133 | rs2241894 | C | T | SYN | ADH1C | 9.79E-09 | a | 1.58E-02 | 2.07E-01 | 4.94E-10 | 7.65E-01 | 1.02E-05 |
| 4 | 100267372 | rs12639833 | T | C | INT | ADH1C | 8.59E-09 | a | 8.88E-03 | 2.42E-01 | 2.66E-10 | 8.02E-01 | 6.44E-06 |
| 4 | 100272147 | rs6846835 | C | T | INT | ADH1C | 9.51E-09 | 8.57E-01 | a | a | 9.51E-09 | 8.57E-01 | 1.32E-04 |
| 4 | 100281893 | rs10031168 | C | T | NA | NA | 4.57E-09 | 9.94E-01 | a | a | 4.57E-09 | 9.94E-01 | 5.28E-05 |
|
b. Results including replications samples: case–control results
| |||||||||||
| Chr | BP | SNP | Gene |
P-value
|
|||||||
| Discovery
|
Replication
|
Total
|
|||||||||
| AA | EA | AA | EA | German | Total AA | Total EA | All data sets | ||||
|
| |||||||||||
| 2 | 55505456 | rs1437396 | NA | 3.82E-06 | 1.43E-02 | 2.02E-01 | 1.63E-01 | 1.71E-04 | 1.81E-06 | 6.44E-06 | 1.17E-10 |
| 4 | 100071924 | rs17028615 | LOC100507053 | 3.55E-06 | a | 2.06E-03 | 2.36E-01 | a | 5.62E-08 | a | 2.23E-05 |
| 4 | 100214164 | rs904092 | LOC100507053 | 7.89E-07 | 4.04E-01 | 5.98E-04 | 6.21E-01 | 7.44E-01 | 5.29E-09 | 5.50E-01 | 4.10E-03 |
| 4 | 100225992 | rs1693458 | NA | 3.88E-07 | 3.80E-01 | a | a | a | 3.88E-07 | 3.80E-01 | 4.44E-03 |
| 4 | 100229017 | rs2066702 | ADH1B | 9.49E-09 | a | 4.49E-04 | 3.13E-01 | a | 3.72E-11 | a | 7.88E-08 |
| 4 | 100235053 | rs1789882 | ADH1B | 3.89E-07 | 3.68E-01 | 3.64E-04 | 6.59E-01 | a | 1.83E-09 | 5.59E-01 | 3.68E-04 |
| 4 | 100236762 | rs1693457 | ADH1B | 4.68E-07 | 4.42E-01 | 3.36E-04 | 5.51E-01 | 9.14E-01 | 2.13E-09 | 7.04E-01 | 1.70E-03 |
| 4 | 100239319 | rs1229984 | ADH1B | a | 1.63E-13 | 6.20E-01 | 3.67E-04 | 1.08E-17 | a | 1.17E-31 | 1.81E-30 |
| 4 | 100249210 | rs2213042 | NA | 3.70E-07 | 9.90E-01 | a | a | a | 3.70E-07 | 9.90E-01 | 5.00E-04 |
| 4 | 100250970 | rs2173201 | NA | 2.37E-07 | 5.55E-01 | 2.09E-01 | 6.83E-01 | 2.33E-03 | 1.32E-07 | 3.40E-02 | 1.83E-06 |
| 4 | 100258155 | rs1614972 | ADH1C | 4.18E-07 | 9.02E-01 | 3.42E-01 | 9.27E-01 | a | 4.06E-07 | 8.79E-01 | 4.96E-04 |
| 4 | 100266133 | rs2241894 | ADH1C | 1.51E-06 | 6.20E-01 | 2.07E-01 | 7.20E-01 | a | 7.66E-07 | 7.88E-01 | 4.81E-04 |
| 4 | 100267372 | rs12639833 | ADH1C | 1.84E-06 | 6.45E-01 | 1.58E-01 | 6.56E-01 | a | 7.04E-07 | 8.45E-01 | 5.72E-04 |
| 4 | 100278697 | rs4699741 | NA | 6.04E-01 | 2.33E-04 | 9.64E-01 | 1.10E-01 | 2.12E-04 | 6.40E-01 | 6.11E-08 | 3.69E-05 |
Abbreviations: BP, base pairs; beta, beta coefficient for the DSM-IV alcohol dependence symptom count; EAF, effect allele frequency; SNP type: INT, intronic; NA, other; NSM, non-synonymous; SYN, synonymous. Only the latter includes the German samples because ordinal phenotype data were not available.
Not tested because of low minor allele frequency, poor imputation quality, model convergence error or not genotyped. Bold and italic indicates genomewide significance, discovery and meta-analysis phases; nominal significance, replication phases.
Relationship of expression of DPP9 and the genes flanking rs1437396 to AD
We examined expression in brain tissue of the genes flanking the GWS intergenic locus on chromosome 2 to determine whether either of these genes is functionally related to AD. A probe (ILMN_1811050) mapping to the 3′-UTR region of CCDC88A was consistently downregulated in the brain regions of alcoholics: CNA: P = 0.05; BLA: P = 0.03 and CTX: P = 0.04. MTIF2 did not exhibit differential expression in any of the three brain regions. Thus, only CCDC88A appeared to be differentially expressed in AD, supporting possible involvement of the protein product of that locus in risk for the trait. Among expression probes mapping to other genes containing GWS SNPs, probe ILMN_1673069, mapping to the 3′-UTR of DPP9, was significantly differentially expressed (P = 0.0024) in BLA (Supplementary Table S3).
DISCUSSION
We found GWS evidence for association with AD, as a diagnosis and in symptom count ordinal trait analysis, at numerous loci, some novel. The most robust individual results were, unsurprisingly, at ADH1B, in each population, but with different functional variants. In our previous study in Han Chinese,14 our best evidence for association was at ALDH2. Considering the strongest results for these three major populations, we find evidence for convergence in terms of pathway, and sometimes even for the same gene, but not for the same variants. Thus, GWAS in different populations may be mutually informative in terms of biology, if not in terms of specific implicated risk alleles.
In EAs, the association with rs1229984 (Arg48His, P = 1.17 × 10⁻³¹) was observed previously, but with much weaker significance (Bierut et al.24 reported a finding in EAs at P = 6.03 × 10⁻⁹ using their populations that we accessed for the present study). The finding with rs1789882 (Arg369Cys, P = 3.72 × 10⁻¹¹) is the first GWS finding for AD in AAs, although the risk locus was known previously.25 The minor alleles for all of the GWS SNPs in the ADH gene region were protective in both populations.
Additional GWS findings implicate other variants that map to the ADH cluster and extend to a region centromeric to it that includes non-ADH genes. Variants mapped to PDLIM5, spanning 32 kb, mark the centromeric extent of these associations. This locus has previously been reported to be associated with schizophrenia26,27. We identified significant association in the EA sample, under the adjusted ordinal model, for a series of SNPs at this locus, a result driven by the SAGE data set. These associations were not identified in the original SAGE reports,28 presumably because they used diagnostic models focusing primarily on case–control analysis. Associations were observed across the LOC100507053 locus, most from the AA part of the sample, with a P-value as low as 1.06 × 10⁻¹² at rs28864441, but one SNP was associated only in EAs (P = 2.46 × 10⁻⁹). The support for association at this locus in multiple samples and two major populations, AAs and EAs, appears strong, but is apparently accounted for by variation elsewhere in the ADH cluster, that is, it most likely reflects linkage disequilibrium with other variants. Conditional analyses to determine whether there was evidence for multiple independent AD risk loci showed that the peak ADH1B SNP in EAs (rs1229984), but not the peak ADH1B SNP in AAs (rs2066702), remained highly significant after adjustment for peak SNPs in either LOC100507053 or PDLIM5. In AAs, ADH1C remained significant after adjusting for any of the other loci tested in this region, suggesting that there exists a functional AD risk variant in ADH1C in this population. Future studies using gene resequencing are needed to validate this hypothesis.
We also identified a novel GWS association (P = 5.57 × 10⁻¹⁰) with rs1437396, which is located between and within 10 kb of MTIF2 (mitochondrial translational initiation factor 2) and CCDC88A (coiled-coil domain containing 88A) on chromosome 2, a risk locus that was supported by evidence in both the EA and AA samples. This region is distinct from the chromosome 2 association previously identified in the German replication sample.9 CCDC88A appears to be the more promising candidate functionally. It interacts with DISC1,29,30 a gene originally known as a schizophrenia risk locus, but has been shown by us to be associated with opioid dependence.2,31 The protein product of this gene also interacts with VEGFA,32 a locus important for antidepressant response33 and hippocampal morphology.34 Further, the region was implicated in a previous linkage study,35 in which follow-up with SNPs mapping under the linkage peak also resulted in an association (empirical P < 0.02) with MTIF2. We found that CCDC88A, but not MTIF2, is differentially expressed in AD, supporting the possible importance of the former locus in AD.
The functional significance of the other GWS loci is unclear. DPP9 encodes a novel protease whose expression is upregulated in the basolateral nucleus of the amygdala in alcoholics (see above) and downregulated in the injured liver.36 The chromosome 9 SNP rs1856202 is located in a cluster of T-cell receptor beta variable pseudogenes.
This study is the largest independent AD GWAS to date, and, by including samples through collaboration and public resources, we augmented the overall available sample from 8186 subjects to an overall sample of 16 087. Other strengths include the following: (1) two analytical approaches were used, including an ordinal trait approach (to increase power and correct for other substance dependence) and case–control using exposed controls only (less power but increased signal-to-noise ratio); (2) multiple replication samples were used; and (3) functional evidence was presented for the novel chromosome 2 risk locus. There are also several limitations. We had limited phenotypic data available on the German (European-ancestry) replication sample, and limited follow-up SNP genotyping was possible. Also our replication data sets include proportionally fewer AA subjects than the GWAS sample, limiting our ability to identify AA-specific risk loci. Although our sample and the SAGE sample were evaluated in similar ways, they differ in that the majority of our sample was recruited for studies of drug, rather than alcohol, dependence. We adjusted for these comorbidities (in both samples) analytically, however, the heterogeneity may have decreased statistical power.
In conclusion, we identified several novel AD risk loci, including the first such associations identified in an AA population. Notably, one finding that maps to chromosome 2 has support from both AA and European-ancestry (EA and German) samples. This novel locus may interact directly with DISC1, a possible schizophrenia37,38 and OD2,31 risk gene whose protein product has a role in cognitive function.39 Additionally, we added to the already considerable evidence for association of variants in the ADH alcohol-metabolizing enzyme genes to AD. Further studies are needed to confirm these associations and to elucidate the functional relationships of the several novel risk loci we identified to AD.
Supplementary Material
Acknowledgments
We appreciate the work in recruitment and assessment provided at Yale University School of Medicine and the APT Foundation by James Poling, PhD; at McLean Hospital by Roger Weiss, M.D., at the Medical University of South Carolina by Kathleen Brady, MD, Ph.D. and at the University of Pennsylvania by David Oslin, MD. Genotyping services for a part of our GWAS study were provided by the Center for Inherited Disease Research (CIDR) and Yale University (Center for Genome Analysis). CIDR is fully funded through a federal contract from the National Institutes of Health to The Johns Hopkins University (contract number N01-HG-65403). We are grateful to Ann Marie Lacobelle, Catherine Aldi and Christa Robinson for their excellent technical assistance, to the SSADDA interviewers, led by Yari Nuñez and Michelle Slivinsky, who devoted substantial time and effort to phenotype the study sample and to John Farrell and Alexan Mardigan for database management assistance. This study was supported by National Institutes of Health grants RC2 DA028909, R01 DA12690, R01 DA12849, R01 DA18432, R01 AA11330, R01 AA017535 and the VA Connecticut and Philadelphia VA MIRECCs. The publicly available data sets used for the analyses described in this manuscript were obtained from dbGaP at http://www.ncbi.nlm.-nih.gov/projects/gap/cgi-bin/study.cgi?study_id=phs000092.v1.p1 through dbGaP accession number phs000092.v1.p. Funding support for the Study of Addiction: Genetics and Environment (SAGE) was provided through the NIH Genes, Environment and Health Initiative [GEI] (U01 HG004422). SAGE is one of the genome-wide association studies funded as part of the Gene Environment Association Studies (GENEVA) under GEI. Assistance with phenotype harmonization and genotype cleaning, as well as with general study coordination, was provided by the GENEVA Coordinating Center (U01 HG004446). Assistance with data cleaning was provided by the National Center for Biotechnology Information. Support for collection of data sets and samples was provided by the Collaborative Study on the Genetics of Alcoholism (COGA; U10 AA008401), the Collaborative Genetic Study of Nicotine Dependence (COGEND; P01 CA089392) and the Family Study of Cocaine Dependence (FSCD; R01 DA013423). Funding support for genotyping, which was performed at the Johns Hopkins University Center for Inherited Disease Research, was provided by the NIH GEI (U01HG004438), the National Institute on Alcohol Abuse and Alcoholism, the National Institute on Drug Abuse and the NIH contract ‘High throughput genotyping for studying the genetic contributions to human disease’ (HHSN268200782096C).
Footnotes
CONFLICT OF INTEREST
Although unrelated to the current study, Dr Kranzler has been a consultant or advisory board member for Alkermes, Lilly, Lundbeck, Pfizer and Roche. He is also a member of the American Society of Clinical Psychopharmacology’s Alcohol Clinical Trials Initiative, which is supported by Lilly, Lundbeck, AbbVie and Pfizer.
Supplementary Information accompanies the paper on the Molecular Psychiatry website (http://www.nature.com/mp)
References
- 1.Gelernter J, Sherva R, Koesterer R, Almasy L, Zhao H, Kranzler HR, et al. Genomewide association study of cocaine dependence and related traits: FAM53B identified as a risk gene. Mol Psychiatry. 2013 Aug 20; doi: 10.1038/mp.2013.99. advance online publication, (e-pub ahead of print) [DOI] [PMC free article] [PubMed] [Google Scholar]
- 2.Gelernter J, Kranzler HR, Sherva R, Koesterer R, Almasy L, Zhao H, et al. Genome-wide association study of opioid dependence: multiple associations mapped to calcium and potassium pathways. Biological Psychiatry. doi: 10.1016/j.biopsych.2013.08.034. in press. [DOI] [PMC free article] [PubMed] [Google Scholar]
- 3.Thorgeirsson TE, Geller F, Sulem P, Rafnar T, Wiste A, Magnusson KP, et al. A variant associated with nicotine dependence, lung cancer and peripheral arterial disease. Nature. 2008;452:638–642. doi: 10.1038/nature06846. [DOI] [PMC free article] [PubMed] [Google Scholar]
- 4.Gelernter J, Kranzler HR. Genetics of alcohol dependence. Hum Genet. 2009;1:91–99. doi: 10.1007/s00439-009-0701-2. [DOI] [PMC free article] [PubMed] [Google Scholar]
- 5.Li D, Zhao H, Gelernter J. Strong association of the alcohol dehydrogenase 1B gene (ADH1B) with alcohol dependence and alcohol-induced medical diseases. Biol Psychiatry. 2011;6:504–512. doi: 10.1016/j.biopsych.2011.02.024. [DOI] [PMC free article] [PubMed] [Google Scholar]
- 6.Li D, Zhao H, Gelernter J. Further clarification of the contribution of the ADH1C gene to vulnerability of alcoholism and selected liver diseases. Hum Genet. 2012a;131:1361–1374. doi: 10.1007/s00439-012-1163-5. [DOI] [PMC free article] [PubMed] [Google Scholar]
- 7.Luo X, Kranzler HR, Zuo L, Yang BZ, Lappalainen J, Gelernter J. ADH4 gene variation is associated with alcohol and drug dependence in European Americans: results from family-controlled and population-structured association studies. Pharmacogenet Genomics. 2005;15:755–768. doi: 10.1097/01.fpc.0000180141.77036.dc. [DOI] [PubMed] [Google Scholar]
- 8.Li D, Zhao H, Gelernter J. Strong protective effect of the aldehyde dehydrogenase gene (ALDH2) 504lys (*2) allele against alcoholism and alcohol-induced medical diseases in Asians. Hum Genet. 2012b;131:725–737. doi: 10.1007/s00439-011-1116-4. [DOI] [PMC free article] [PubMed] [Google Scholar]
- 9.Treutlein J, Cichon S, Ridinger M, Wodarz N, Soyka M, Zill P, et al. Genome-wide association study of alcohol dependence. Arch Gen Psychiatry. 2009;66:773–784. doi: 10.1001/archgenpsychiatry.2009.83. [DOI] [PMC free article] [PubMed] [Google Scholar]
- 10.Schumann G, Coin LJ, Lourdusamy A, Charoen P, Berger KH, Stacey D, et al. Genome-wide association and genetic functional studies identify autism susceptibility candidate 2 gene (AUTS2) in the regulation of alcohol consumption. Proc Natl Acad Sci USA. 2011;108:7119–7124. doi: 10.1073/pnas.1017288108. [DOI] [PMC free article] [PubMed] [Google Scholar]
- 11.Frank J, Cichon S, Treutlein J, Ridinger M, Mattheisen M, Hoffmann P, et al. Genome-wide significant association between alcohol dependence and a variant in the ADH gene cluster. Addict Biol. 2012;17:171–180. doi: 10.1111/j.1369-1600.2011.00395.x. [DOI] [PMC free article] [PubMed] [Google Scholar]
- 12.Zuo L, Wang K, Zhang XY, Krystal JH, Li CS, Zhang F, et al. NKAIN1-SERINC2 is a functional, replicable and genome-wide significant risk gene region specific for alcohol dependence in subjects of European descent. Drug Alcohol Depend. 2013;129:254–264. doi: 10.1016/j.drugalcdep.2013.02.006. [DOI] [PMC free article] [PubMed] [Google Scholar]
- 13.Park BL, Kim JW, Cheong HS, Kim LH, Lee BC, Seo CH, et al. Extended genetic effects of ADH cluster genes on the risk of alcohol dependence: from GWAS to replication. Hum Genet. 2013;132:657–668. doi: 10.1007/s00439-013-1281-8. [DOI] [PubMed] [Google Scholar]
- 14.Quillen EE, Chen X-D, Almasy L, Yang F, He H, Li X, et al. GWAS of alcohol dependence and related traits in an isolated rural Chinese sample, submitted [Google Scholar]
- 15.Wang JC, Foroud T, Hinrichs AL, Le NX, Bertelsen S, Budde JP, et al. A genome-wide association study of alcohol-dependence symptom counts in extended pedigrees identifies C15orf53. Mol Psychiatry. 2012 doi: 10.1038/mp.2012.143. [DOI] [PMC free article] [PubMed] [Google Scholar]
- 16.Pierucci-Lagha A, Gelernter J, Feinn R, Cubells JF, Pearson D, Pollastri A, et al. Diagnostic reliability of the semi-structured assessment for drug dependence and alcoholism (SSADDA) Drug Alcohol Depend. 2005;80:303–312. doi: 10.1016/j.drugalcdep.2005.04.005. [DOI] [PubMed] [Google Scholar]
- 17.American Psychiatric Association. Diagnostic and Statistical Manual of Mental Disorders. 4. American Psychiatric Press; Washington, DC, USA: 1994. [Google Scholar]
- 18.Holland PM, Abramson RD, Watson R, Gelfand DH. Detection of specific polymerase chain reaction product by utilizing the 5′→3′ exonuclease activity of Thermus aquaticus DNA polymerase. Proc Natl Acad Sci USA. 1991;88:7276–7280. doi: 10.1073/pnas.88.16.7276. [DOI] [PMC free article] [PubMed] [Google Scholar]
- 19.Price AL, Patterson NJ, Plenge RM, Weinblatt ME, Shadick NA, Reich D. Principal components analysis corrects for stratification in genome-wide association studies. Nat Genet. 2006;38:904–909. doi: 10.1038/ng1847. [DOI] [PubMed] [Google Scholar]
- 20.Patterson N, Price AL, Reich D. Population structure and eigen analysis. PLoS Genet. 2006;2:e190. doi: 10.1371/journal.pgen.0020190. [DOI] [PMC free article] [PubMed] [Google Scholar]
- 21.Zeger SL, Liang KY. Longitudinal data analysis for discrete and continuous outcomes. Biometrics. 1986;42:121–130. [PubMed] [Google Scholar]
- 22.Willer CJ, Li Y, Abecasis GR. METAL: fast and efficient meta-analysis of genome-wide association scans. Bioinformatics. 2010;26:2190–2191. doi: 10.1093/bioinformatics/btq340. [DOI] [PMC free article] [PubMed] [Google Scholar]
- 23.Ponomarev I, Wang S, Zhang L, Harris RA, Mayfield RD. Gene coexpression networks in human brain identify epigenetic modifications in alcohol dependence. J Neurosci. 2012;32:1884–1897. doi: 10.1523/JNEUROSCI.3136-11.2012. [DOI] [PMC free article] [PubMed] [Google Scholar]
- 24.Bierut LJ, Goate AM, Breslau N, Johnson EO, Bertelsen S, Fox L, et al. ADH1B is associated with alcohol dependence and alcohol consumption in populations of European and African ancestry. Mol Psychiatry. 2012;17:445–450. doi: 10.1038/mp.2011.124. [DOI] [PMC free article] [PubMed] [Google Scholar]
- 25.Edenberg HJ, Xuei X, Chen H-J, Tian H, Wetherill LF, Dick DM, et al. Association of alcohol dehydrogenase genes with alcohol dependence: a comprehensive analysis. Hum Mol Genet. 2006;15:1539–1549. doi: 10.1093/hmg/ddl073. [DOI] [PubMed] [Google Scholar]
- 26.Horiuchi Y, Arai M, Niizato K, Iritani S, Noguchi E, Ohtsuki T, et al. A polymorphism in the PDLIM5 gene associated with gene expression and schizophrenia. Biol Psychiatry. 2006;59:434–439. doi: 10.1016/j.biopsych.2005.07.041. [DOI] [PubMed] [Google Scholar]
- 27.Li C, Tao R, Qin W, Zheng Y, He G, Shi Y, et al. Positive association between PDLIM5 and schizophrenia in the Chinese Han population. Int J Neuropsychopharmacol. 2008;11:27–34. doi: 10.1017/S1461145707007687. [DOI] [PubMed] [Google Scholar]
- 28.Bierut LJ, Agrawal A, Bucholz KK, Doheny KF, Laurie C, Pugh E, et al. Gene, environment association studies consortium: a genome-wide association study of alcohol dependence. Proc Natl Acad Sci USA. 2010;107:5082–5087. doi: 10.1073/pnas.0911109107. [DOI] [PMC free article] [PubMed] [Google Scholar]
- 29.Enomoto A, Asai N, Namba T, Wang Y, Kato T, Tanaka M, et al. Roles of disrupted-in-schizophrenia 1-interacting protein girdin in postnatal development of the dentate gyrus. Neuron. 2009;63:774–787. doi: 10.1016/j.neuron.2009.08.015. [DOI] [PubMed] [Google Scholar]
- 30.Kim JY, Liu CY, Zhang F, Duan X, Wen Z, Song J, et al. Interplay between DISC1 and GABA signaling regulates neurogenesis in mice and risk for schizophrenia. Cell. 2012;148:1051. doi: 10.1016/j.cell.2011.12.037. [DOI] [PMC free article] [PubMed] [Google Scholar]
- 31.Xie P, Kranzler HR, Krystal JH, Farrer LA, Zhao H, Gelernter J. Deep resequencing of 17 glutamate system genes identifies rare variants in DISC1 and GRIN2B affecting risk of opioid dependence. Addict Biol. 2013 Jul 16; doi: 10.1111/adb.12072. advance online publication, (e-pub ahead of print) [DOI] [PMC free article] [PubMed] [Google Scholar]
- 32.Kitamura T, Asai N, Enomoto A, Maeda K, Kato T, Ishida M, et al. Regulation of VEGF-mediated angiogenesis by the Akt/PKB substrate Girdin. Nat Cell Biol. 2008;10:329–337. doi: 10.1038/ncb1695. [DOI] [PubMed] [Google Scholar]
- 33.Warner-Schmidt JL, Duman RS. VEGF is an essential mediator of the neurogenic and behavioral actions of antidepressants. Proc Natl Acad Sci USA. 2007;104:4647–4652. doi: 10.1073/pnas.0610282104. [DOI] [PMC free article] [PubMed] [Google Scholar]
- 34.Blumberg HP, Wang F, Chepenik LG, Kalmar JH, Edmiston E, Duman RS, et al. Influence of vascular endothelial growth factor variation on human hippocampus morphology. Biol Psychiatry. 2008;15:901–903. doi: 10.1016/j.biopsych.2008.07.003. [DOI] [PMC free article] [PubMed] [Google Scholar]
- 35.Dick DM, Meyers J, Aliev F, Nurnberger J, Jr, Kramer J, Kuperman S, et al. Evidence for genes on chromosome 2 contributing to alcohol dependence with conduct disorder and suicide attempts. Am J Med Genet B Neuropsychiatr Genet. 2010;153B:1179–1188. doi: 10.1002/ajmg.b.31089. [DOI] [PMC free article] [PubMed] [Google Scholar]
- 36.Chowdhury S, Chen Y, Yao TW, Ajami K, Wang XM, Popov Y, et al. Regulation of dipeptidyl peptidase 8 and 9 expression in activated lymphocytes and injured liver. World J Gastroenterol. 2013;19:2883–2893. doi: 10.3748/wjg.v19.i19.2883. [DOI] [PMC free article] [PubMed] [Google Scholar]
- 37.St Clair D, Blackwood D, Muir W, Carothers A, Walker M, Spowart G, et al. Association within a family of a balanced autosomal translocation with major mental illness. Lancet. 1990;336:13–16. doi: 10.1016/0140-6736(90)91520-k. [DOI] [PubMed] [Google Scholar]
- 38.Kim JY, Duan X, Liu CY, Jang M-H, Guo JU, Powanpongkul N, et al. DISC1 regulates new neuron development in the adult brain via modulation of AKT-mTOR signaling through KIAA1212. Neuron. 2009;63:761–773. doi: 10.1016/j.neuron.2009.08.008. [DOI] [PMC free article] [PubMed] [Google Scholar]
- 39.Thomson PA, Parla JS, McRae AF, Kramer M, Ramakrishnan K, Yao J, et al. 708 Common and 2010 rare DISC1 locus variants identified in 1542 subjects: analysis for association with psychiatric disorder and cognitive traits. Mol Psychiatry. 2013 doi: 10.1038/mp.2013.68. [DOI] [PMC free article] [PubMed] [Google Scholar]
Associated Data
This section collects any data citations, data availability statements, or supplementary materials included in this article.