Abstract
Background
The purpose of this study was to investigate the relationship between age and the incidence and relative survival of anaplastic astrocytoma (AA).
Methods
Data from the Surveillance, Epidemiology and End Results database were used to identify 3202 patients with AA. These data were analyzed to assess incidence rates, relative survival, and the standardized mortality ratio across age groups. Time trends were modeled using delayed-entry modeling.
Results
The overall incidence of AA was an age-adjusted rate of 3.5 per million person/years. The overall age-standardized 5- and 10-year relative survival rates of populations with AA were 23.6% and 15.1%, respectively. The overall standardized mortality ratio for the entire cohort was 46 (95% confidence interval: 45, 48).
Conclusions
Patients with a diagnosis of AA are 46 times more likely to die than persons matched for age/sex/year of the general population. The effect of age on survival is present for only the first 2 years postdiagnosis. Measuring the effect of age on survival for populations with an AA is not amenable to using models with proportional hazards as an assumption because of the presence of a reverse fork–type interaction.
Keywords: anaplastic astrocytoma, brain tumor, nonproportional hazards, relative survival, standardized mortality ratio
Brain cancer incidence and relative survival (RS) in the United States and Australia appear to have shown little change over the past 25 years.1,2 The incidence of anaplastic astrocytoma (AA) is ∼0.48 per 100 000 person/years, making it much less common than glioblastoma multiforme (GBM).3–6 Time trends appear to suggest that there is little change in the incidence of brain tumors over time when we look at gliomas as a group.7 However, glioblastomas represent 69% of all gliomas, so there is the potential for small changes in incidence of the less common tumor types to be masked if gliomas are analyzed as a group.8
When smaller subgroups are reviewed closely, different trends begin to emerge, but these are typically small.9 In a 2006 study, for example, Houben et al.9 found that the incidence rates of high-grade astrocytomas in males were increasing in the order of 1.5% per year (P = .005), while low-grade astrocytomas were decreasing in incidence by 1.9% per year (P = .02).
The overall 5-year survival of AA has previously been reported to be at 22%, with the highest 5-year survival rate of 49.9% seen in patients in the 15- to 24-year-old age group, and the lowest of 2.5% seen in the 75- to 84-year-old age group.5 These values have not been adjusted for background mortality, however. Recently, it has been shown that survival rates for AA’s more serious counterpart, GBM, have not changed much over the past 25 years.10 We therefore felt it important to review the changes in survival rates of AA over the past 25 years.
The focus of the current study is the relationship between age and the incidence and RS of AA. In addition, we review the time trends of RS rates.
Materials and Methods
The Surveillance, Epidemiology and End Results (SEER) database was used to identify patients with an AA (code 9401/3). At the beginning of the SEER program, in 1973, there were 9 SEER registries collecting data prospectively, most of which were statewide. Progressively, more regions (most often states) joined the SEER registries; it now includes 18 regions/registries. The data used in this study were analyzed by stratification according to the recommended age groups of the Adolescent and Young Adult Oncology Progress Review Group': children (0–15 y), young adults (16–39 y), adults (40–64 y), and elderly (≥65 y).11
Incidence Rates
Incidence rates and confidence intervals (CIs) were obtained from the SEER 9 database.12 SEER 9 was used in preference to SEER 18 for incidence data because all 9 registries have complete data going back to 1973, allowing for an accurate analysis of time trends. Incidence rates were age standardized to the US standard 2000 population. Incidence rate ratios were used to measure the effect size of variables on the incidence rate. Unsmoothed age-standardized rates are presented in tables, and smoothed estimates are plotted on graphs. Moving averages with a 4, 1, and 4 window were used in order to reduce random fluctuation. This provides a clearer view of the underlying behavior of the data. We did not include the category of children below the age of 1 year in the calculation of moving averages, as it would not fulfill the assumption of equidistant categories during its calculation. All statistical analyses were performed on Stata version 11.2.
Relative Survival
Survival data were obtained from the SEER 18 registries, and survival estimates are presented using the direct method of age standardization. Relative survival is an extension of the Kaplan–Meier survival estimation method, which provides estimates of cause-specific survival by dividing the survival rates of patients at a particular time period (t) by the background survival rate for members of the general population matched for age, sex, and race. This is important because it is well known that increasing age is associated with poorer survival, and a calculation of survival rates that adjusts for the effects of age will be a more accurate measure of cancer-specific survival.
Period Modeling
Delayed-entry modeling (period modeling) was used to provide up-to-date survival estimates and to describe time trends observed in the survival data. This concept was first described in 1996 by Brenner, a German statistician.13,14 Period modeling involves including only patients who were followed up within a certain time window (typically the most recent time window for up-to-date survival estimates). This window is moved across time to provide the individual data points for the time trends analysis.
The key to the period analysis (modeling) is to include in the survival analysis only patients with follow-up data that occur within a specific period (or “window”). For a window between 1995 and 2000, for example, a patient with a diagnosis in 1990 who survived for 9 years would be counted as a patient only between 1995 and 1999, thus his follow-up years 6 to 9 (4 y total) would be used. Years 1 to 5 (5 y total) would not be included. This is done to improve the currency of the dataset.
The window used for the primary dataset in this study was between 2001 and 2006. To produce longitudinal period RS estimates, or 5-year RS rates over 25 years, a 1-year window (at 1981) was created then moved in 1-year increments from 1981 to 2006 (25 y). Five-year estimates can be produced from a 1-year window because contributions from all years of follow-up are made by the multiple patients included in each window. This method has been useful in defining time trends of survival in medulloblastomas and GBM.10,15
The estimated annual percentage change (EAPC) on the unsmoothed longitudinal period RS data was measured using linear regression with robust standard errors because of the changing standard errors of the original data (later years had smaller standard errors because of the greater underlying population). For the overall cohort, the EAPC was measured at 2 and 5 years. For each age group, the EAPC was measured at 5 years.
Standardized Mortality Ratio
Standardized mortality ratios (SMRs) are used to describe the impact of a disease on a patient population and provide types of insight into how disease affects the young and the elderly differently.6 It is well known that brain tumors are often more lethal in older populations, yet the SMR demonstrates how the impact is greater in the younger age populations, as they generally have a lower expected mortality rate. The SMR is derived by dividing the observed number of deaths by the expected number of deaths, which is itself derived from background mortality estimates. The SMR is interpreted as: “Patients diagnosed with AA are [insert SMR] times more likely to die than the matched general population.”
Results
The incidence of AA overall was an age-adjusted rate of 3.5 per million person/years. For males and females, the overall age-adjusted rates were 4.0 and 3.1, respectively, per 100 000 person/years, with a rate ratio of 1.28 (see Table 1).
Table 1.
Frequencies and incidence rate ratios (IRRs) of AA by age group (SEER 9)
| Children (per million) | IRR (95% CI) | Young Adults (per million) | IRR (95% CI) | Adults (per million) | Base Category | Elderly (per million) | IRR (95% CI) | Overall | |
|---|---|---|---|---|---|---|---|---|---|
| Frequency | 178 (5%) | 0.25 (0.02, 2.23) | 791 (29%) | 0.5 (0.09, 2.73) | 1138 (40%) | – | 732 (26%) | 1.75 (0.5, 5.98) | 2839 (100%) |
| Incidence rate* | 1 | 2 | 4 | 7 | 3.1 |
The incidence of AA increases with age (P < .001). In children, the rate was 0.9 per million person/years. The rates were 2.6 in young adults, 4.7 in adults, and 8.4 in elderly per million person/years.
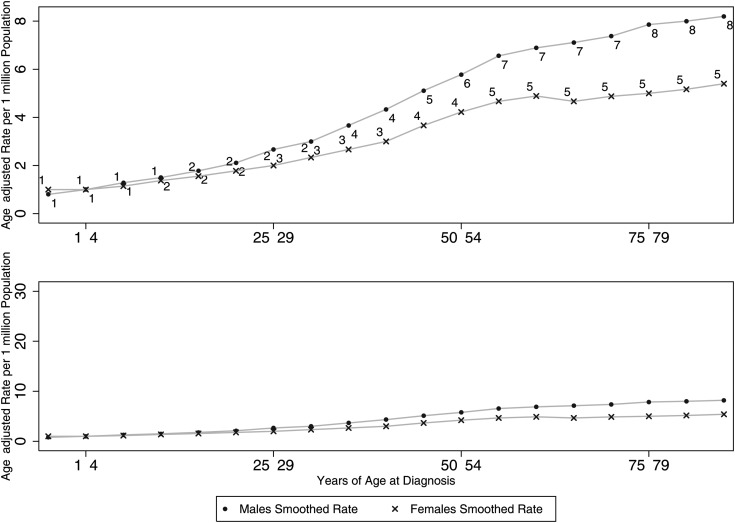
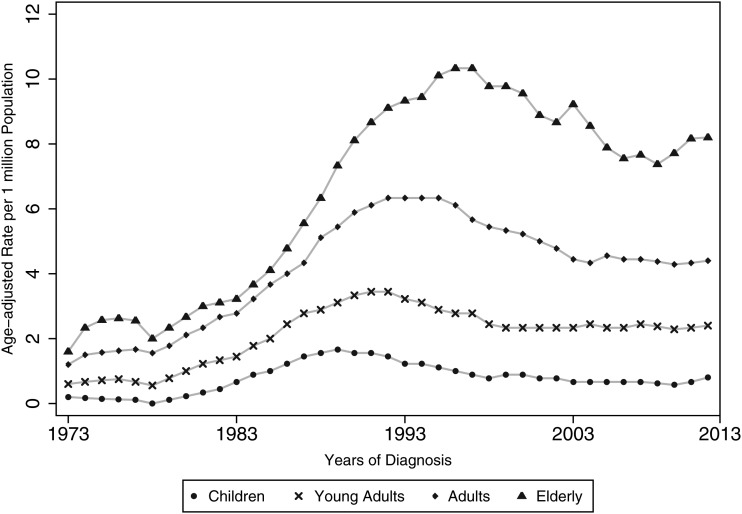
Figure 1 demonstrates how the difference in the incidence rates of each sex is dependent on the age group, with the sex differences becoming apparent as age increases, rather than being homogeneous throughout the ages. For example, the incidence risk ratio is 1:1 (M:F) in young adults, increasing to 1:1.3 in the elderly. Figure 2 demonstrates the time trends of AA. From a visual inspection of the graph, complex relationships can be observed; complex regression modeling is required to provide accurate incidence rate modeling, and this is beyond the scope of this paper.
Fig. 1.
Smoothed incidence rates (per 1 million) across patient ages at diagnosis, by sex. The bottom graph is placed here to demonstrate that the differences between sexes is in fact small (irrespective of P-value).
Fig. 2.
Time trends of the incidence of AA (SEER 9) demonstrating stability in the later years.
Survival
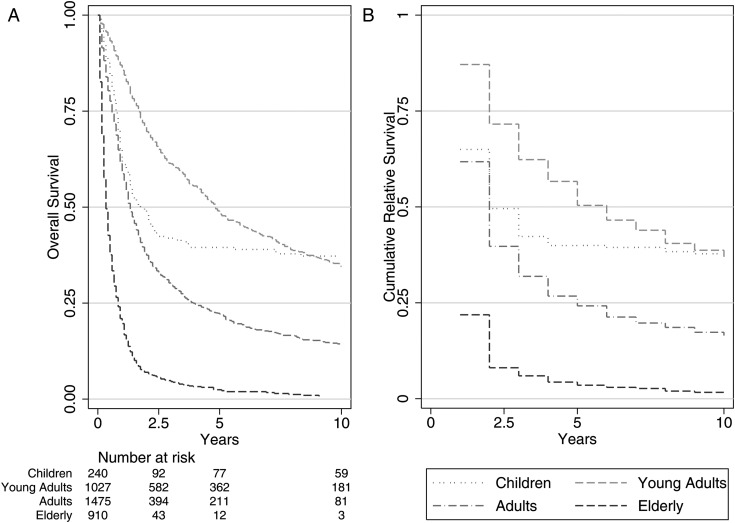
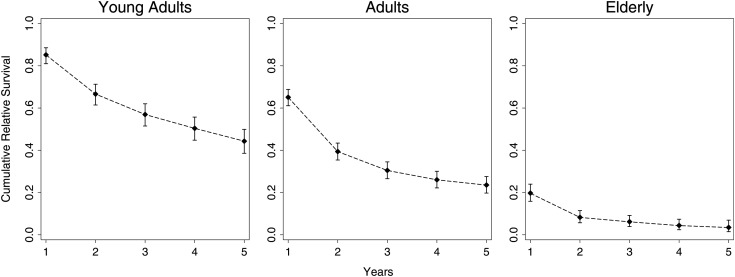
The overall age-standardized 5-year RS rate was 23.6%, and at 10 years the age-standardized RS was 15.1%. Early and late into follow-up, it was clear that young adults fared best and that the elderly population fared much worse, even after adjusting for general mortality rates. The RS rate for young adults at 10 years was 36%, while at just 5 years the RS rate for the elderly population was 3.5%. Figure 3 demonstrates that the overall and relative survival figures do not differ by a large margin.
Fig. 3.
(A) Overall survival and (B) RS curves as measured by the Kaplan–Meier method and RS methods. Relative survival cannot be calculated at time zero, which is why the first period is absent (SEER 18).
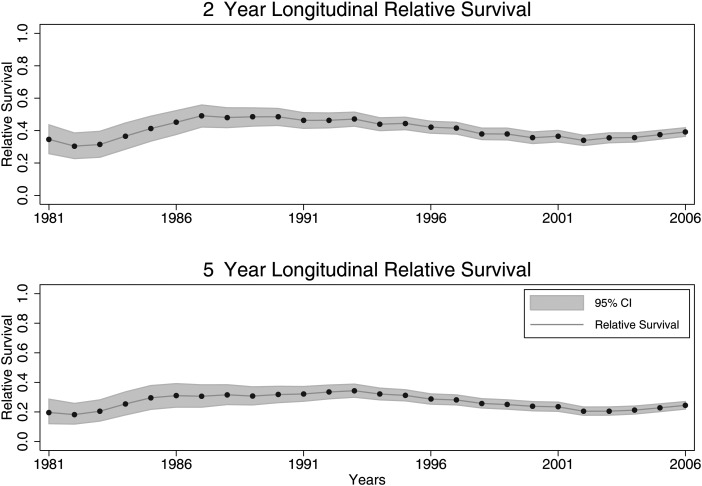
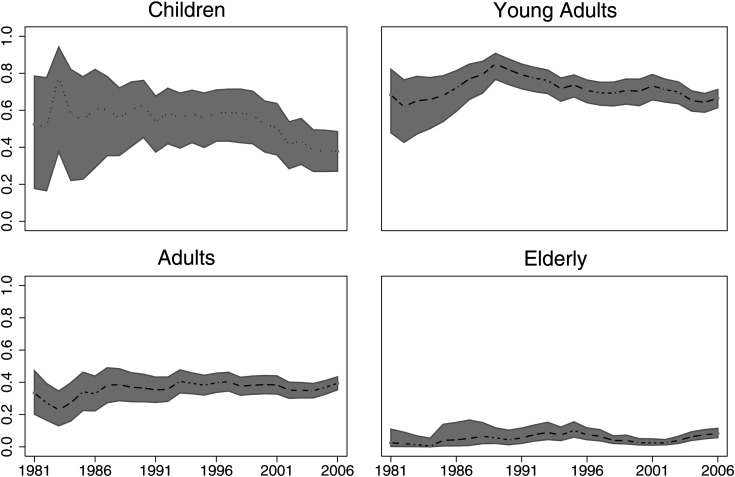
Figures 4 and 5 demonstrate the time trends of RS rates. The striking feature is that RS rates have not changed over time in the early (2 y) or later (5 y) follow-up period. In addition, it seems that survival rates have remained stable over the past 25 years for all age groups. The EAPC for 2-year longitudinal period RS rates was −0.13% (95% CI: −0.47, 0.22%; P = .46). The EAPC for 5-year longitudinal period RS rates was −0.13% (95% CI: −0.43, 0.17%; P = .39). For children the EAPC was −0.78% (95% CI: −1.2, −0.30; P = .002). For young adults the EAPC was −0.11% (95% CI: −0.43, 0.22; P = .511). For adults the EAPC was 0.31% (95% CI: 0.09, 0.54; P = .008). And for the elderly the EAPC was 0.12% (95% CI: 0.003, 0.23; P = .45).
Fig. 4.
Longitudinal period RS rates of AAs by age group. Two-year longitudinal period RS EAPC: −0.13% (95% CI: −0.47, 0.22%; P = .46). Five-year longitudinal period RS EAPC: −0.13% (95% CI: −0.43, 0.17%; P = .39). Demonstrating a relatively stable trend, rather than any obvious up- or downtrends.
Fig. 5.
Longitudinal period RS rates of AAs by age group. Demonstrates that changes in 5-year survival rates have not had an obvious uptrend.
Effect Size of Age on Survival
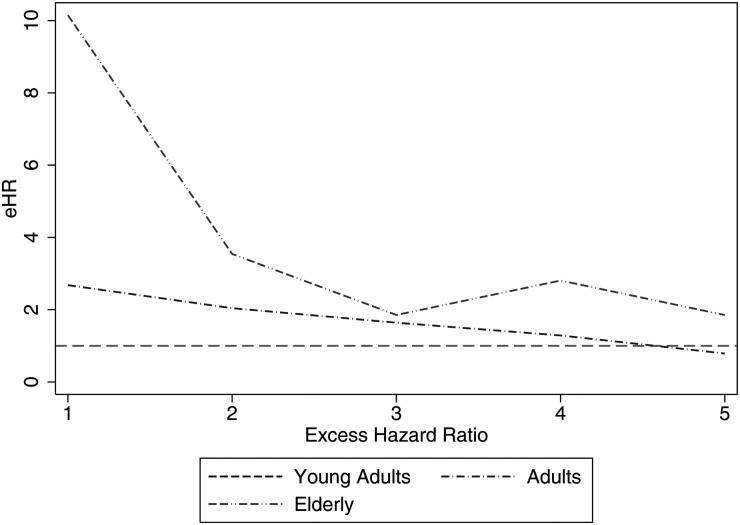
Table 3 demonstrates that the effect size of age group on survival changes over time. In other words, this is an example of nonproportional hazards. In the first and second years of follow-up, adults are 2.68 and then 2.04 times as likely to die as young adults (excess hazard ratio [eHR], which implies adjustment for background mortality rates as done here). In contrast, the elderly population is 10.15 times more likely to die than young adults in the first year postdiagnosis, but this eHR decreases drastically to 3.54 in the second year. The excess hazards seen in the elderly population are no longer significantly different than those seen in the young adult population by the third year postdiagnosis (as seen by the CIs crossing 1). This hazard rate relationship to age groups is an example of a reverse-fork interaction, meaning that the eHRs change throughout follow-up and are not proportional.
Table 3.
Regression model demonstrating the magnitude of the survival differences, measured by eHRs for the first 5 years of follow-up
| Year of Follow-up | Age Group | eHR | 95% CI Lower Limit | 95% CI Upper Limit |
|---|---|---|---|---|
| 1 | Young adults | 1.00 | – | – |
| 2 | Young adults | 1.00 | – | – |
| 3 | Young adults | 1.00 | – | – |
| 4 | Young adults | 1.00 | – | – |
| 5 | Young adults | 1.00 | – | – |
| 1 | Adults | 2.68 | 1.97 | 3.64 |
| 2 | Adults | 2.04 | 1.52 | 2.73 |
| 3 | Adults | 1.64 | 1.02 | 2.65 |
| 4 | Adults | 1.29 | 0.66 | 2.51 |
| 5 | Adults | 0.79 | 0.33 | 1.88 |
| 1 | Elderly | 10.15 | 7.51 | 13.73 |
| 2 | Elderly | 3.54 | 2.37 | 5.29 |
| 3 | Elderly | 1.85 | 0.75 | 4.58 |
| 4 | Elderly | 2.81 | 0.87 | 9.02 |
| 5 | Elderly | 1.85 | 0.19 | 17.84 |
Note that adults and elderly are compared with young adults (base category) at their respective years. For example, in the first year after diagnosis, adults are 2.68, and elderly 10.15 times as likely to die compared with young adults. We are 95% confident that the true value for the elderly population lies between 7.51 and 13.73.
eHR interpreted similarly to the usual hazard ratio used in Cox proportional hazards model, except that in this model, background mortality rates are accounted for and hazards are not proportional.
The hazard rates are worse (larger) for the elderly compared to young adults for the first 2 years, and worse for adults compared to young adults for the first 3 years.
Post-estimation visual inspection (see Fig. 6) and likelihood ratio testing of a nested model without an interaction term demonstrated that the best model was that which included an Age × Follow-up interaction term.
Fig. 6.
Post-estimation visual inspection of the piecewise constant hazards model. Observed (dots with capped spikes) and model predictions (dotted lines). Demonstrates an accurate model using the interaction term. Nest model (without interaction term) demonstrated a fit that was visually inaccurate, and the likelihood ratio test for model differences was P < .05 compared with the full model.
Standardized Mortality Ratio
The cohort saw 2758 deaths, when 59.5 deaths were expected. This means that the overall SMR for the entire cohort was 46 (95% CI: 45, 48). Children had an SMR of 267 (95% CI: 225, 314). Young adults, adults, and elderly had SMRs of 79 (95% CI: 73, 86), 54 (95% CI: 51, 58), and 35 (95% CI: 33, 38), respectively.
Discussion
This review of the SEER registry database found that the effect of age on survival is present for only the first 3 years postdiagnosis. We found that measuring the effect of age on survival for populations with an AA is not amenable to using models with proportional hazards as an assumption because of the presence of a reverse fork–type interaction (Age × Follow-up Time interaction).
Incidence
Most histological types of brain tumor are found to occur more commonly in males than in females, and the male to female ratio of all histological types combined has been shown to be 1.26 (with data from the Canton in Zurich from 1982–1994).8 A similar study based on data from the Central Brain Tumor Registry of the United States (CBTRUS) for 1992–1997 has determined the male to female ratio of AA to be 1.2.16 These previous findings are consistent with the ratio found in this study, which showed a male to female ratio of 1.28. The cause for the increased incidence of AA and combined primary brain tumors in males compared with females remains unknown and cannot be explained by our data.
It has been previously established that gliomas and primary brain tumors as a whole increase in incidence with age.5,17 The data presented in this paper show that the incidence rate of developing AA increases with advancing age. The incidence rate ratio of AA in young adults stands at 0.5 compared with 0.25 for children and 1.75 for the elderly population when compared with the baseline (adults), although none of these reached significance (Table 1, see CIs).
It has been postulated that the introduction of CT in the 1970s and of MRI in the 1980s increased case ascertainment, leading to an increase in incidence of primary brain tumors over the period 1983–1993. It is unlikely that this is the sole explanation of the increase. Desmeules et al.18 retrospectively examined medical records and determined that 20% of CNS tumors remained undiagnosed without the use of CT or MRI studies, most being misdiagnosed as stroke. They argued that the introduction of CT and MRI should account for a 20% increase in incidence.
An important potential bias to both the incidence and survival estimates presented here is in histological reclassification. The SEER database has been collecting information about tumors since 1973, and the collection methods and histological classifications of tumors have changed markedly since this period. In addition, there has never been a central histological review of the AA's inside the SEER database. The most notable change has been the advent of 1p/19q codeletion, which identifies certain subsets of tumors that are more responsive to chemotherapy, have better progression-free and overall survival, and in the later years are now classified as tumors other than AA.19–22 This would be an issue in situations where tumors from the 1970s and 80s were used in our analysis, as some tumors would be reclassified due to the newer diagnostic technology and whether a central histological review were to be performed. In addition, there can be a lack of concordance between pathologists’ grading and classification of tumors in certain situations.23,24 Also, these early patients would not have been treated with chemotherapy as a standard of care, thus leading to downward estimates of survival. Overall, we believe that the decreasing survival rates in children are due to improvements in histological techniques, allowing for more accurate diagnosis of tumors with worse prognosis (fewer low-grade tumors included as AA in later years of the SEER registry).
Period survival modeling is performed on the data before the analysis to guard against the problem of different histological techniques during different periods, but it far from eliminates it. The period modeling procedure includes only patients with follow-up data occurring within a specific period (or window; in this instance, 2001 to 2006). For example, a patient with a diagnosis in January 2000 who survived for 4 years would have only his second, third, and fourth years of survival included in the analysis because his second to fourth years are within the prespecified period (or window; in this study, between 2001 and 2006). Therefore, this method precludes patients with diagnoses of tumors in the early 1990s' being included in our analysis and ensures that only recent diagnoses are included. This minimizes but does not eliminate the bias caused by changing histological classifications over time.
Survival
Our data show an age-standardized overall 5-year RS of 23.6%, which is similar to previous estimates of nonrelative 5-year survival of 22% using CBTRUS data.5 As demonstrated in Fig. 3, overall and relative survival figures do not differ by a large margin. This is indicative of the fact that AA is an aggressive condition that invariably causes the patient's death.
For the overall cohort, the RS rates at 2 and 5 years for AA over the past 25 years have not increased (P = .46 at 2 y and P = .39 at 5 y). The cause of the decreasing RS rates in children cannot be explained by these data, but we hypothesize that it is due to the histological reclassification bias discussed above. For example, we suspect that there may be the classification of lower-grade gliomas or other brain tumors appearing like AAs (which have a better prognosis) as AAs in the early periods of the SEER registry. Thus, if a central histological review were performed, a significant portion of the tumors diagnosed in the early 1990's and 80's would be reclassified as tumors with a better prognosis.
Age has classically been associated with a poorer prognosis across all gliomas, and here we demonstrate the effect size of the association after adjustment for background mortality rates.16 Even after adjusting for general mortality rates, Table 2 and the subsequent regression model (Table 3) show that young adults fare better than adults and much better than elderly. In fact, once adjusted for background mortality rates, elderly are 10 times more likely to die from their disease than young adults; however, this effect diminishes soon after. The effect of age on survival rates is observable for only 3 years, which is a form of nonproportional hazards, or a reverse fork–type interaction.
Table 2.
Relative survival of AA by age groups
| Year | n | Deaths | Overall |
Children |
Young Adults |
Adults |
Elderly |
||||||||||
|---|---|---|---|---|---|---|---|---|---|---|---|---|---|---|---|---|---|
| RS | 95% CI | RS | 95% CI | RS | 95% CI | RS | 95% CI | RS | 95%CI | ||||||||
| 1 | 3652 | 1505 | 55.6% | 53.0% | 58.1% | 65.0% | 58.6% | 70.7% | 87.1% | 84.9% | 89.0% | 61.8% | 59.2% | 64.2% | 21.9% | 19.2% | 24.7% |
| 2 | 2133 | 622 | 37.0% | 34.5% | 39.5% | 49.6% | 43.0% | 55.8% | 71.6% | 68.7% | 74.3% | 39.7% | 37.2% | 42.3% | 8.1% | 6.3% | 10.1% |
| 5 | 811 | 77 | 23.6% | 21.2% | 26.1% | 40.0% | 33.6% | 46.2% | 50.4% | 47.0% | 53.6% | 24.2% | 21.8% | 26.7% | 3.5% | 2.2% | 5.3% |
| 10 | 360 | 19 | 15.1% | 12.9% | 17.9% | 37.8% | 31.5% | 44.2% | 36.2% | 32.7% | 39.8% | 16.5% | 14.1% | 19.0% | 1.3% | 0.4% | 3.3% |
Overall results are presented as directly age-standardized RS estimates. Young adults had the highest survival rate at all follow-up times.
Non-proportional Excess Hazards and Forked Hazards
This and other series have shown that different age groups of patients with gliomas and medulloblastomas do not have proportional hazards. This means that the Cox proportional hazards model is not appropriate to model the survival differences between different age groups. For example, when adults are compared with young adults, the adults' eHR decreases from 2.68 in the first year postdiagnosis to 1.64 at 3 years (see Table 3). When the elderly population is compared with young adults, the eHR decreases from 10.15 to 1.85 at 1 to 3 years. This, as seen in Fig. 7, demonstrates the reverse-fork interaction between age groups and follow-up time, which has been previously described for low-grade gliomas.25 In other words, the effect size of age on survival rate is dependent upon the follow-up time period.
Fig. 7.
Line graph of eHRs of the piecewise constant hazards survival model. The lines that begin as separate and then converge later in follow-up demonstrate change in eHR over time. This is a visual representation of nonproportional hazards—more specifically, the reverse-fork interaction.
There appear to be 2 types of relationships when modelling a variable's relationship to survival rates: Forked Hazards (forward and reverse forked hazards; non-proportional hazards) and proportional hazards. In this series, there were large differences between age groups only up to 2 years postdiagnosis. After this, the survival rates were similar across age groups. In contrast to this, in medulloblastomas the differences between age groups become apparent only after 4 years of follow-up, and this is known as a forward-fork interaction.15 Thus far, the only histological subtype of brain tumor that has been found to have a proportional hazards type relationship when modeling age is GBM.10 Because of the nonproportional hazards discussed here, we urge investigators to use caution when modeling the relationships of age to survival in brain tumor research.
Conclusion
The overall age-standardized 5- and 10-year RS rates of populations with AA were 23.6% and 15.1%, respectively. The effect of age on survival is present for only the first 3 years postdiagnosis, and after this, age no longer affects cancer-specific survival rates. Five-year RS rates appear unchanged over time.
Conflict of interest statement. None declared.
References
- 1.Australian Institute of Health and Welfare. Cancer Survival and Prevalence in Australia: Period Estimates From 1982 to 2010. Canberra: AIHW; 2012. [DOI] [PubMed] [Google Scholar]
- 2.Horner MJRL, Krapcho M, Neyman N, et al. SEER Cancer Statistics Review 1975–2006. http://seer.cancer.gov/csr/1975_2006/ based on November 2008 SEER data submission, posted to the SEER web site, 2009.
- 3.Radhakrishnan K, Mokri B, Parisi JE, et al. The trends in incidence of primary brain tumors in the population of Rochester, Minnesota. Ann Neurol. 1995;37(1):67–73. doi: 10.1002/ana.410370113. [DOI] [PubMed] [Google Scholar]
- 4.Smoll NR, Drummond KJ. The incidence of medulloblastomas and primitive neurectodermal tumours in adults and children. J Clin Neurosci. 2012;19(11):1541–1544. doi: 10.1016/j.jocn.2012.04.009. [DOI] [PubMed] [Google Scholar]
- 5.Surawicz TS, McCarthy BJ, Kupelian V, et al. Descriptive epidemiology of primary brain and CNS tumors: results from the Central Brain Tumor Registry of the United States, 1990–1994. Neuro Oncol. 1999;1(1):14–25. doi: 10.1093/neuonc/1.1.14. [DOI] [PMC free article] [PubMed] [Google Scholar]
- 6.Smoll NR, Gautschi OP, Radovanovic I, et al. Incidence and relative survival of chordomas: the standardized mortality ratio and the impact of chordomas on a population. Cancer. 2013;119(11):2029–2037. doi: 10.1002/cncr.28032. [DOI] [PubMed] [Google Scholar]
- 7.Inskip PD, Hoover RN, Devesa SS. Brain cancer incidence trends in relation to cellular telephone use in the United States. Neuro Oncol. 2010;12(11):1147–1151. doi: 10.1093/neuonc/noq077. [DOI] [PMC free article] [PubMed] [Google Scholar]
- 8.Ohgaki H, Kleihues P. Population-based studies on incidence, survival rates, and genetic alterations in astrocytic and oligodendroglial gliomas. J Neuropathol Exp Neurol. 2005;64(6):479–489. doi: 10.1093/jnen/64.6.479. [DOI] [PubMed] [Google Scholar]
- 9.Houben MP, Aben KK, Teepen JL, et al. Stable incidence of childhood and adult glioma in the Netherlands, 1989–2003. Acta oncologica. 2006;45(3):272–279. doi: 10.1080/02841860500543190. [DOI] [PubMed] [Google Scholar]
- 10.Smoll NR, Schaller K, Gautschi OP. Long-term survival of patients with glioblastoma multiforme (GBM) J Clin Neurosci. 2013;20(5):670–675. doi: 10.1016/j.jocn.2012.05.040. [DOI] [PubMed] [Google Scholar]
- 11.Albritton KC, Anderson B, Nichols C, et al. 2006:108. Closing the Gap: Research and Care Imperatives for Adolescents and Young Adults With Cancer. Report of the Adolescent and Young Adult Oncology Progress Review Group. [Google Scholar]
- 12.National Cancer Institute D, Surveillance Research Program, Cancer Statistics Branch. 2011. Surveillance, Epidemiology and End Results (SEER) Program, SEER 18 Regs Research Data 1973–2009. [Google Scholar]
- 13.Brenner H. Long-term survival rates of cancer patients achieved by the end of the 20th century: a period analysis. Lancet. 2002;360(9340):1131–1135. doi: 10.1016/S0140-6736(02)11199-8. [DOI] [PubMed] [Google Scholar]
- 14.Brenner H, Gefeller O. An alternative approach to monitoring cancer patient survival. Cancer. 1996;78(9):2004–2010. [PubMed] [Google Scholar]
- 15.Smoll NR. Relative survival of childhood and adult medulloblastomas and primitive neuroectodermal tumors (PNETs) Cancer. 2012;118(5):1313–1322. doi: 10.1002/cncr.26387. [DOI] [PubMed] [Google Scholar]
- 16.Ohgaki H, Kleihues P. Epidemiology and etiology of gliomas. Acta Neuropathol. 2005;109(1):93–108. doi: 10.1007/s00401-005-0991-y. [DOI] [PubMed] [Google Scholar]
- 17.Sarkar C, Pramanik P, Karak AK, et al. Are childhood and adult medulloblastomas different? A comparative study of clinicopathological features, proliferation index and apoptotic index. J Neurooncol. 2002;59(1):49–61. doi: 10.1023/a:1016357731363. [DOI] [PubMed] [Google Scholar]
- 18.Desmeules M, Mikkelsen T, Mao Y. Increasing incidence of primary malignant brain tumors: influence of diagnostic methods. J Natl Cancer Inst. 1992;84(6):442–445. doi: 10.1093/jnci/84.6.442. [DOI] [PubMed] [Google Scholar]
- 19.Cairncross JG, Ueki K, Zlatescu MC, et al. Specific genetic predictors of chemotherapeutic response and survival in patients with anaplastic oligodendrogliomas. J Natl Cancer Inst. 1998;90(19):1473–1479. doi: 10.1093/jnci/90.19.1473. [DOI] [PubMed] [Google Scholar]
- 20.Yip S, Butterfield YS, Morozova O, et al. Concurrent CIC mutations, IDH mutations, and 1p/19q loss distinguish oligodendrogliomas from other cancers. J Pathol. 2012;226(1):7–16. doi: 10.1002/path.2995. [DOI] [PMC free article] [PubMed] [Google Scholar]
- 21.von Deimling A, Louis DN, von Ammon K, et al. Evidence for a tumor suppressor gene on chromosome 19q associated with human astrocytomas, oligodendrogliomas, and mixed gliomas. Cancer Res. 1992;52(15):4277–4279. [PubMed] [Google Scholar]
- 22.Zhao J, Ma W, Zhao H. Loss of heterozygosity 1p/19q and survival in glioma: a meta-analysis. Neuro Oncol. 2014;16(1):103–112. doi: 10.1093/neuonc/not145. [DOI] [PMC free article] [PubMed] [Google Scholar]
- 23.Kros JM, Gorlia T, Kouwenhoven MC, et al. Panel review of anaplastic oligodendroglioma from European Organization For Research and Treatment of Cancer Trial 26951: assessment of consensus in diagnosis, influence of 1p/19q loss, and correlations with outcome. J Neuropathol Exp Neurol. 2007;66(6):545–551. doi: 10.1097/01.jnen.0000263869.84188.72. [DOI] [PubMed] [Google Scholar]
- 24.Mittler MA, Walters BC, Stopa EG. Observer reliability in histological grading of astrocytoma stereotactic biopsies. J Neurosurg. 1996;85(6):1091–1094. doi: 10.3171/jns.1996.85.6.1091. [DOI] [PubMed] [Google Scholar]
- 25.Smoll NR, Gautschi OP, Schatlo B, et al. Relative survival of patients with supratentorial low-grade gliomas. Neuro Oncol. 2012;14(8):1062–1069. doi: 10.1093/neuonc/nos144. [DOI] [PMC free article] [PubMed] [Google Scholar]


