

Abstract
We report on the performance of structures for lossless ion manipulation (SLIM) as a means for transmitting ions and performing ion mobility separations (IMS). Ions were successfully transferred from an electrospray ionization (ESI) source to the TOF MS analyzer by means of a linear SLIM, demonstrating lossless ion transmission and an alternative arrangement including a 90° turn. First, the linear geometry was optimized for radial confinement by tuning RF on the central “rung” electrodes and potentials on the DC-only guard electrodes. Selecting an appropriate DC guard bias (2–6 V) and RF amplitude (≥160 Vp-p at 750 kHz) resulted in the greatest ion intensities. Close to ideal IMS resolving power was maintained over a significant range of applied voltages. Second, the 90° turn was optimized for radial confinement by tuning RF on the rung electrodes and DC on the guard electrodes. However, both resolving power and ion transmission showed a dependence on these voltages, and the best conditions for both were >300 Vp-p RF (685 kHz) and 7–11 V guard DC bias. Both geometries provide IMS resolving powers at the theoretical limit (R ∼ 58), showing that degraded resolution from a “racetrack” effect from turning around a corner can be successfully avoided, and the capability also was maintained for essentially lossless ion transmission.
The introduction of ion mobility spectrometry/mass spectrometry (IMS/MS) and its commercial adaptations have enabled a wide range of analytical capabilities including structural measurements of macromolecules, including proteins1−15 and protein complexes,16−29 and separations of complex mixtures30−47 based upon both shape-to-charge (from IMS) and mass-to-charge (from MS) ratios. IMS/MS offers additional advantages over conventional MS. The most conceptually simple class of IMS devices utilize a uniform weak DC electric field drift cell at pressures of less than 1 Torr to atmospheric pressure for separation of ions. The drift velocity in the background gas (N2, He, etc.) is directly proportional to the ion mobility (K) and inversely proportional to the collision cross section of the ion with the buffer gas.48 This allows direct measurement of collisional cross sections by recording the arrival time distributions of the analytes under study. Ignoring space charge effects,49 the resolving power of IMS in an ideal electric field is mainly a function of two parameters: the initial gate opening time at the ion source (t0), providing the initial ion distribution, and the peak broadening effects due to diffusion as the ions travel through the device.50 Resolving power is typically measured by the quotient of the arrival time divided by the peak width at half-maximum.51 The resolving power is given by the following equation.50,51
| 1 |
T refers to drift cell temperature, q is charge of the ion, L is drift cell length, E is the electric field, and kB is the Boltzmann constant. Under conditions where the initial ion packet pulse width (t0) is negligible, the resolving power increases with the electric field, and eq 1 simplifies to eq 2, the diffusion limited expression for IMS resolving power (Rd).
| 2 |
Under these conditions, the ion drift time does not affect the resolving power, and the resolving power increases proportionately with the square root of L and E. Eventually, the increase in electric field causes an increase in ion velocity to the point that the effects of diffusion on peak width become negligible, and the resolving power potentially achievable for an initial ion pulse (Rp) is defined by eq 3
| 3 |
where v is the ion velocity. Under these conditions, the resolving power decreases with the reciprocal of electric field but increases linearly with drift length. Both Rd and Rp increase with increasing drift length, driving efforts to extend the drift cell length to increase resolving power.52,53 A key challenge, however, is the loss of sensitivity due to radial diffusion of the ions and, for example, Coulombic repulsion, into the electrode surfaces or other surfaces present in the system.49,54
Several approaches have been introduced for increasing the sensitivity of IMS/MS measurements. One was the implementation of the electrodynamic ion funnel after IMS analysis.55 The ion funnel allowed lossless ion transfer through a two meter drift tube coupled to a QTOF, avoiding large losses at the IMS/MS interface by recompressing the ion beam after radial diffusion before entry into the MS interface without loss of IMS resolving power. Additionally, instead of using a Bradbury–Nielson gate56 to pulse ions into the IMS, ion funnels with accumulation and gating regions55 as well as an ion funnel trap57 were introduced to provide greater ion signals without sacrificing IMS resolving power. Another approach to increasing IMS/MS sensitivity was applying alternating phase RF voltage to adjacent IMS drift rings to counteract diffusive and space charge-induced ion loss by providing radial RF confinement.58,59 These approaches have increasingly driven the use of IMS/MS commercial instruments for biological analyses and analytical separations.
We have recently introduced structures for lossless ion manipulations (SLIM) to provide a basis for complex gas phase ion manipulations.60 SLIM utilize RF ion confinement in conjunction with DC potentials to manipulate ions in multiple dimensions with initial implementations that aim to enable steps that include lossless ion transport, trapping, turning, and switching between alternative paths. In contrast to conventional constant field drift tube and traveling wave61 devices, SLIM devices can potentially be readily assembled into many alternative arrangements. Here, we demonstrate this ability by evaluating two of the basic building blocks needed to enable complex manipulations, i.e., the linear and 90° turn segments. Using printed circuit board (PCB)-based SLIM devices allows for a multitude of electrode designs to be rapidly fabricated, tested, and applied at low cost based on the results of ion trajectory and potential calculations. The designs for these sets of experiments were chosen due to their lossless performance and highly efficient IMS separations in simulations at pressures of 4 Torr.62,63 However, SLIM devices are not fundamentally limited to IMS experiments or even ∼4 Torr pressure environments. We aim to utilize these devices in the future to allow for series of ion manipulations of biologically relevant macromolecules and complex mixtures currently unattainable by state-of-the-art instrumentation.
In this work, we show initial results of the lossless nature of the device with ion current measurements. In addition, the effects of radial confinement and electric field on ion transmission and IMS resolving power for SLIM consisting of linear and 90° turn SLIM components are presented. The IMS resolving power and intensity are also compared between a linear SLIM arrangement and an arrangement including the 90° turn. The combination of lossless ion transfer with the ability to turn and store ions allows for an extremely flexible foundation for the development of more complex SLIM devices.
Experimental Arrangement
SLIM
SLIM were fabricated from 7.62 cm × 7.62 cm component segments composed of FR-4 material (fiber glass cloth with epoxy resin) with copper electrodes laid directly onto the PCB (Figure 1A). RF rung electrodes are 0.76 mm wide × 5.33 mm long, spaced 0.76 mm from each other (edge to edge), and thus 1.52 mm center-to-center. The RF applied to each electrode is 180° out of phase with respect to adjacent electrodes in the Z coordinate (Figure 1B). The RF potentials create a repulsive pseudopotential in the Y coordinate for ions close to the electrodes.62,63 A superimposed DC potential gradient was also established to enable directed ion motion in the Z coordinate. DC-only “guard” electrodes, 5.25 mm wide × 6 mm long, provided a lateral barrier in the X coordinate to prevent ions from being lost to the sides. Guards were typically biased 2–15 V higher than the DC on the first neighboring RF electrode. Guard electrodes were biased by applying a potential gradient from the first to last guard via resistive chain. Each SLIM board was spaced 4.76 mm from an identical electrode arrangement on a parallel board (Figure 1B). This provides for an equivalent pseudopotential well both above and below the center of the ion path (Y coordinate) and for effectively lossless ion transmission.
Figure 1.
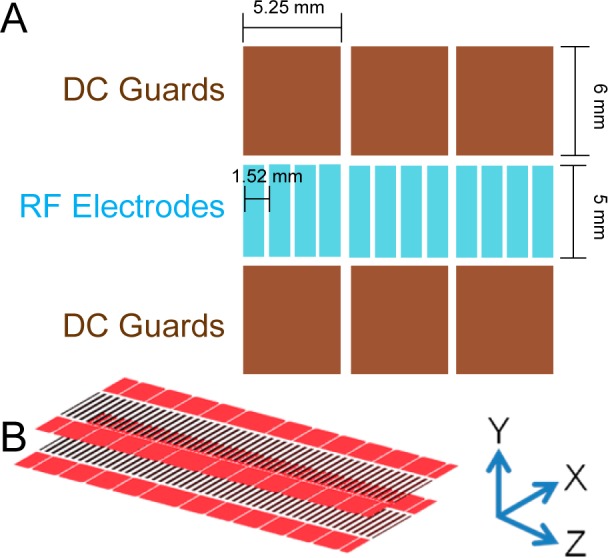
(A) Illustration of a portion of a linear SLIM component (not to scale). Opposing phases of RF are applied to adjacent RF rung electrodes biased with DC to provide an electric field for ion drift motion. DC guard electrodes on either side of the ion path prevent loss in the transverse direction. (B) Parallel SLIM linear components and the coordinate system used in text.
Mass Spectrometry
Ions from an Agilent low concentration ESI tuning mix (Agilent, Santa Clara, CA) and a 1 μM nine peptide mix (bradykinin acetate salt, kemptide acetate salt, angiotensin I human acetate salt hydrate, angiotensin II human, neurotensin, renin substrate tetradecapeptide porcine, substance P acetate salt hydrate, melittin from honey bee venom, and fibrinopeptide A human (Sigma-Aldrich, St. Louis, MO) in 50/50/1 vol/vol/vol water/methanol/acetic acid (Fisher Scientific, Pittsburgh, PA)) were generated by nanoelectrospray ionization using etched emitters and infusion by syringe pump (Chemyx, Stafford, TX) with a flow rate of 0.3 μL/min and introduced into the first stage of vacuum through a stainless steel 250 μm i.d. capillary heated to 120 °C (Figure 2). After exiting the heated capillary, ions enter an ion funnel trap64−66 (3.95 Torr) for ion accumulation and pulsed gating into the SLIM for IMS. The exit gate was opened for a 0.162 ms pulse for all Agilent tune mix experiments. Upon exiting the trapping region of the funnel, ions traverse a 2.54 cm long convergent region of the ion funnel and are injected through a 2.5 mm diameter conductance limiting orifice into the SLIM (4 Torr). The 50 mTorr positive pressure prevents neutrals from entering the SLIM. After drifting through the SLIM, ions exit via a rear ion funnel (15 cm length). The potentials in the convergent region of the ion funnel trap, SLIM, and rear ion funnel are set to maintain a constant electric field through the entire region. Ions then pass through a conductance-limiting orifice into a short RF-only quadrupole to the differentially pumped region (475 mTorr) of an Agilent 6224 TOF MS with a 1.5 m flight tube (Agilent Technologies, Santa Clara, CA). Data was processed with a U1084A 8-bit ADC digitizer (Agilent Technologies, Santa Clara, CA) using in-house control software.
Figure 2.

Schematic of SLIM/MS instrumentation used. The ion trap is at 3.95 Torr. The SLIM region is at 4.00 Torr. The short quadrupole is at 475 mTorr.
Results and Discussion
Ion Current Measurements To Investigate “Lossless” Ion Transmission
The total ion current resulting from ESI of the Agilent tuning mix and ions injected to a SLIM linear module was directly measured as a function of position along the ion path. The ion current was measured by a Keithley 6485 picoammeter (Keithley Instruments, Inc., Cleveland, OH) connected to a coaxial cable with the shield on the opposite end of the cable grounded to the vacuum chamber and an exposed “probe” section of wire positioned between the two parallel SLIM surfaces for a module composed of four sets of parallel linear segments. The measurements were conducted by repeatedly physically repositioning the probe at 6.93, 16.1, 29.3, and 37.5 cm from the entrance to the SLIM module, with the last measurement being made in the ion funnel after the SLIM module. The electric field used was 5 V/cm due to electric discharge between the electrodes and the bare wire probe at higher voltages. Figure 3 gives the measured ion currents, 245, 230, 215, and 235 pA for each position, and shows lossless ion transmission through the device within experimental error (displayed as error bars calculated from the standard deviation of the triplicate measurements).
Figure 3.

Agilent tuning mix ion current measured as a function of distance from the entrance to the SLIM device. Error bars represent standard deviations from triplicate measurements. Measurements were made by inserting a probe in between the two planar electrodes at each point.
Optimization of RF Amplitude and DC Guard Biases for the Linear SLIM Module
The effects of RF amplitude and DC guard biases on the intensities and IMS resolving power were initially measured for a linear-only SLIM module consisting of six parallel pairs of straight segments (total length of 45.7 cm) and an overall drift region of 63.2 cm (including the converging section of the front funnel trap and the rear ion funnel). The length was increased by two segments to increase the resolving power (eq 1). Intensities were normalized to the most intense m/z 922 peak in each study. The first experimental parameter studied was RF amplitude. The RF pseudopotential wells can be modeled for an ion guide such as the present SLIM module by the approximation of a series of infinite line conductors with alternating polarity potentials.67,68 As with ion funnels, the RF potentials give the following effective confining potential
| 4 |
VRF is the 0-peak RF amplitude, h is the perpendicular coordinate to the infinite wires, d is the space between adjacent wires (RF electrodes for the SLIM), q is the ion charge, m is ion mass, and f is the applied RF frequency. How well ions are confined is thus inversely proportional to m/z and directly proportional to the square of RF amplitude. For example, when RF was increased from 80 Vp-p to 100 Vp-p, there is an increase in the pseudopotential well depth by a factor of 1.56. With sufficient RF amplitude, it is expected that increases in pseudopotential well depth do not cause an increase in ion signal as ions are no longer lost due to poor RF confinement. The effects of a 750 kHz RF waveform amplitude on the relative intensity and resolving power for m/z 922 are shown in Figure 4A. Ion intensity was measured and normalized to the maximum intensity observed, and found to increase with RF amplitude until reaching 160 Vp-p, after which the ion signal intensity plateaued. Therefore, the pseudopotential wells generated by RF were deep enough to allow for stable ion trajectories.
Figure 4.
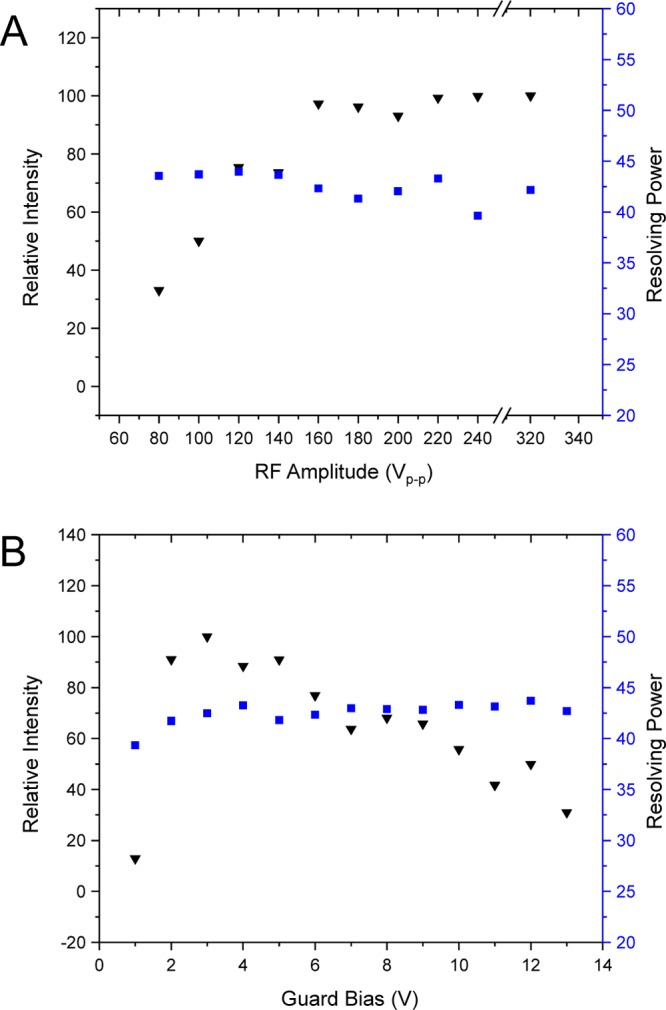
(A) Effects of RF amplitude on relative intensity (inverted black triangles) and resolving power (blue squares) for m/z 922 in the linear arrangement. The guard bias was set to 5 V above the first and last RF electrode. The RF frequency was 750 kHZ. (B) Effects of guard bias voltage on relative intensity (black inverted triangles) and IMS resolving power (blue squares). The guard bias was set to the desired voltage the same magnitude above the first and the last RF trace. RF was 750 kHz, 220 Vp-p.
Next, the effect of RF amplitude on the resolving power was evaluated. Calculations of the RF pseudo potential wells showed regions of high local RF potentials in the YZ plane close to the surface of the RF electrodes.62,63 Therefore, the motion of ions that are not properly confined to the center of the device (i.e., in the RF field-free region) may be perturbed resulting in IMS peak broadening. Across all RF amplitudes used, the IMS resolving power remained fairly constant, with a mean resolving power of 43. This indicates that as the RF amplitude was increased, the local RF fields experienced by the ions never became high enough to cause a decrease in resolving power due to peak broadening or tailing. The RF amplitude was increased to 320 Vp-p to ascertain whether RF fields would begin to slow ions, but Figure 4A illustrates that the resolving power did not change with the current SLIM configuration, which is important for operating SLIM for ion mobility measurements. Because resolving power itself did not change, the center of the arrival time distributions for m/z were considered as well (Table 1A). The standard deviation of the peak centroid was 0.22 ms, while the TOF pusher pulse period was 0.16 ms, again indicating little variability in arrival time as a function of RF amplitude.
Table 1. (A) RF Amplitude versus Center of Arrival Time Distribution. (B) Guard Bias versus Arrival Time Centroid Distribution for m/z 922a.
| A | ||||||
| RF amplitude (Vp-p) | 80 | 100 | 120 | 140 | 160 | 180 |
| Arrival time (ms) | 19.2 | 19.3 | 19.3 | 19.3 | 19.2 | 19.0 |
| RF amplitude (Vp-p) | 200 | 220 | 240 | 320 | ||
| Arrival time (ms) | 18.9 | 18.9 | 18.9 | 18.9 | ||
| B | |||||||
| Guard bias (V) | 1 | 2 | 3 | 4 | 5 | 6 | 7 |
| Arrival time (ms) | 19.0 | 18.9 | 19.0 | 19.0 | 19.0 | 19.0 | 19.0 |
| Guard bias (V) | 8 | 9 | 10 | 11 | 12 | 13 | |
| Arrival time (ms) | 19.0 | 19.0 | 19.0 | 19.0 | 19.2 | 19.2 | |
In both cases, arrival time resolution is 0.16 ms.
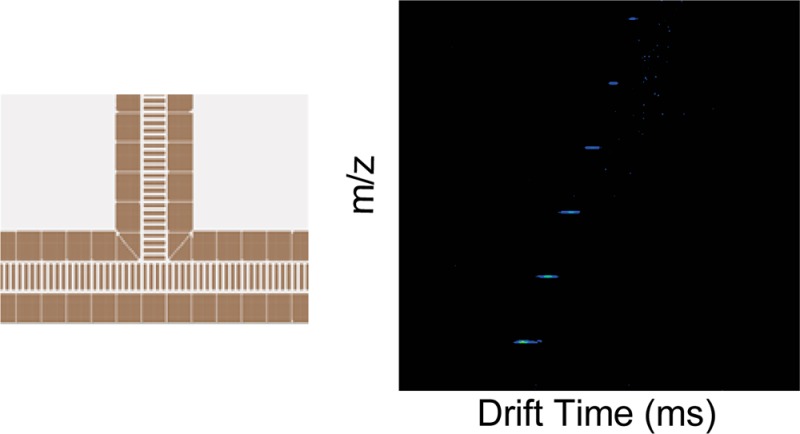
Next, the effects of the guard DC bias relative to the rung electrodes on both intensity and resolving power were explored using 750 kHz, 220 Vp-p RF (Figure 4B). The chosen guard bias did not significantly alter the IMS resolving power except when the guards were biased 1 V above the DC of the RF electrodes, where the resolving power dropped to ∼39 due to the low intensity (and poorly defined IMS peaks). For higher selected guard biases, the mean resolving power was 43 (standard deviation 0.6); the arrival time distribution centroids for m/z 922 are given in Table 1B. As with RF amplitude, changing the guard biases does not significantly change the arrival time distribution (0.08 ms standard deviation of the arrival times; less than the time resolution limitation defined by the TOF pusher pulse). In contrast to RF amplitude, there is range of guard biases that optimize ion transmission; for the linear SLIM device, the range was from ∼2 to 6 V. Again, intensities were normalized to the highest intensity of m/z 922 observed in the study. The decrease in signal below 2 V is attributed to ineffective ion confinement (i.e., losses to the sides of the RF electrodes). Biases greater than ∼6 V cause ion losses, most likely by unoptimized fields at the entrance and exits of the SLIM. A nested IMS/MS spectrum of the nine peptide mix recorded with the optimized values for RF and DC guards illustrates the ability of the SLIM device to perform IMS separations on a mixture (Figure 2, Supporting Information).
Optimization of RF Amplitude and DC Guard Bias for a SLIM Module Including a 90° Turn
The development of practical SLIM modules for extensive ion manipulations, for example, high-resolution IMS with extended path lengths, generally depends upon the ability to turn ions (by, for example, 90°). Turning ions allows for transmitting ions into different SLIM regions for different types of manipulations, for example, trapping, separations, and reactions, while keeping the SLIM device itself within a modest footprint and allowing for more compact and flexible designs. The design philosophy applied with our SLIM is to exploit the rapid collisional ion damping to make turns abruptly and thus eliminate or minimize any “racetrack effect”, resulting in broadening of IMS peaks due to ions of the same mobility taking paths of multiple different lengths as well as experiencing different field gradients through the turn. In our experimental studies, the fourth linear section was replaced with a segment allowing a 90° turn (Figure 5A). The potentials were assigned such that the ions are swept into a potential established from the beginning of one side of the bottom of the “tee” segment to the end of the device (Figure 3, Supporting Information). The effective drift fields experienced by the ions can therefore be made constant through the turning region. In the direction opposite that of the ion motion, the drift potential creates an effective DC barrier, preventing ions from “leaking” in the opposite direction. Simulations predict lossless ion transmission when the 90° turn is operated in this mode (Figure 1B, Supporting Information). The ion source was moved orthogonal to the TOF instrument axis to allow for the use of only a single turn segment. However, due to engineering constraints of the vacuum housing, the SLIM arrangement with a 90° turn is longer than the linear arrangement used above by 3.05 cm. Because R is proportional to the square root of the length, the effect of the additional length does not significantly alter the resolving power (at most ∼3% higher for m/z 922 using turn geometry).
Figure 5.
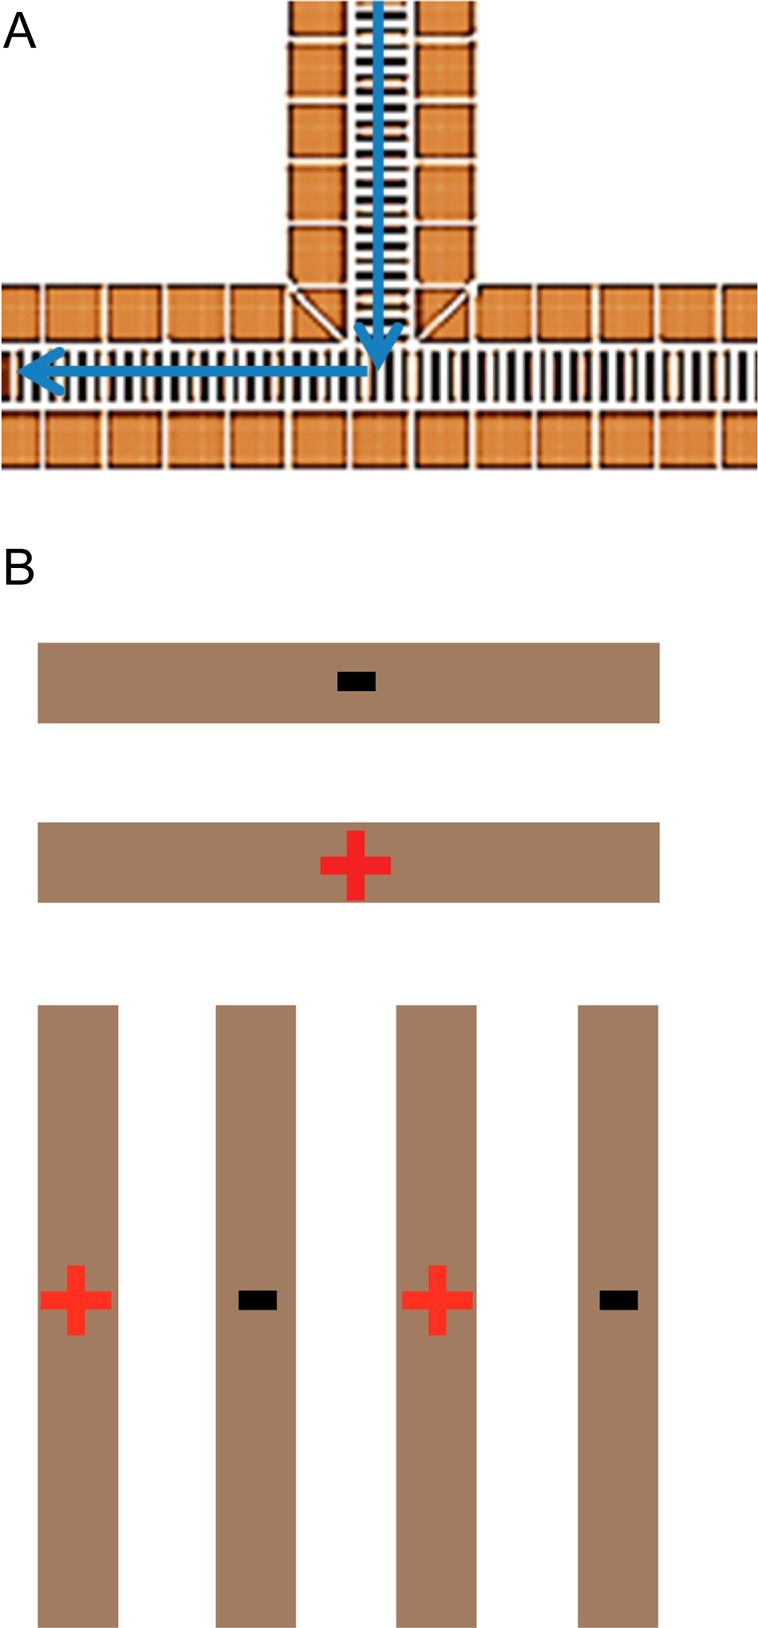
Illustration of the 90° turn segment. (A) Ions enter the turn and continue in the direction of voltage drop. The voltage remains constant throughout the turn. (B) Illustration of RF phasing through the turning region.
The trend for relative intensity (normalized to the highest value) is similar to the straight-only SLIM arrangement shown in Figure 5B, with ion transmission optimized for guard bias from ∼7 to 12 V (Figure 6A). Transmission decreases significantly for guard bias >13 V. The shape of the guard DC bias versus intensity curve can be attributed to poor lateral ion confinement at low DC bias voltages and ion losses to the RF electrodes at high guard DC bias due to excessive field penetration from the guards, pushing ions toward the RF electrodes. DC fields generated by the guard electrodes have an orthogonal component that affects the overall confinement potential in the orthogonal dimension (toward the electrode surfaces).62,63 When the local field is stronger than the field for drift motion (i.e., ≥20 V/cm for the present SLIM design), the ions can be lost to electrode surfaces. However, the lowest effective guard bias increases from 2 V for the linear geometry to 7 V for the geometry including a turn. This difference is attributed to poor lateral ion confinement by the guards for the turn segment with <7 V biases.
Figure 6.
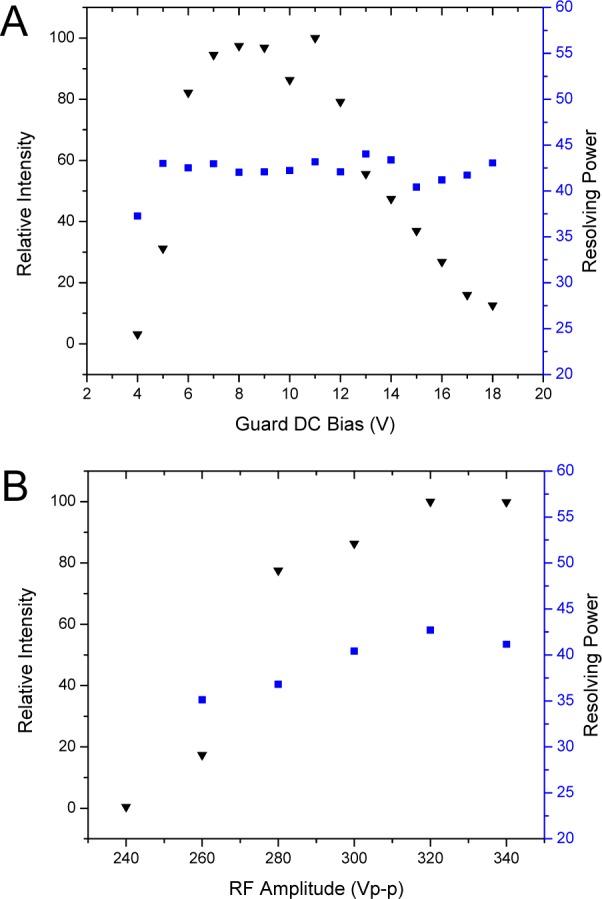
(A) Effects of guard DC bias voltage on the relative intensity (black inverted triangles) and resolving power (blue squares) for m/z 922. The RF frequency was 685 kHz and amplitude was 320 Vp-p. Intensities are normalized to m/z 922 intensity at a guard bias of 11 V. (B) Effects of RF amplitude on relative intensity (black inverted triangles) and resolving power (blue squares) for m/z 922. The guard bias used was 11 V and RF frequency was 685 kHz. Intensities are normalized to m/z 922 intensity at 320 Vp-p RF.
The effects of RF amplitude on signal intensity and IMS resolving power for m/z 922 are shown in Figure 6B. The guard bias used was 11 V for an electric field of 20 V/cm, similar to the linear-only arrangement. The same trend for RF amplitude and signal intensity was observed for the 90° turn and linear arrangements, where the signal increases with RF amplitude to a plateau in ion intensity once a deep enough potential well is reached providing sufficient RF ion confinement. However, the RF amplitudes used are approximately a factor of 2 higher than for the linear arrangement. Unlike the linear geometry, where each adjacent electrode had an opposing phase RF applied, the present SLIM design has adjacent electrodes with the same phase of RF in the turning region of the 90° turn segment (Figure 5B). Employing adjacent electrodes with the same phase of RF results in a decrease in the local pseudopotential well. As a result (along with the effects of field penetration from using 11 V biases on the DC guards), ion trajectory simulations show only 12% ion transmission through the turning region when using 160 Vp-p (viz., optimized RF amplitude for the linear path) (Figure 1A, Supporting Information). Increasing the RF amplitude by a factor of 2 with the present design mitigates the loss of ions due to adjacent electrodes with the same phases of RF. This increases the pseudopotential (∼4-fold, and 4.8-fold if accounting for the somewhat lower RF frequency used; eq 4), with simulations showing 100% transmission through the turn at 320 Vp-p (Figure 1B, Supporting Information).
Ion trajectory simulations have shown that close to the rung electrodes the RF fields actually act as barriers to drift motion (vide supra).62,63 For the highest IMS resolving power, the ions must remain in the RF field-free regions (viz., near the center of the device) to avoid perturbation to ion trajectories. The DC field penetration form the higher guard biases used for lateral confinement in the 90° turn arrangement pushes the ions toward the electrodes. The resolving power increases as RF amplitude increases, from 35 at 260 Vp-p to 42 at 320 Vp-p, in contrast to the linear arrangement where resolving power remains fairly constant with RF amplitude. Increasing the RF amplitude increases the resolving power by keeping the ions confined in the RF field-free center region of the device, balancing the effects from DC field penetration by the guard electrodes. The center of the arrival time distributions and their full width half-maxima (fwhm) are recorded in Table 2. The ion arrival times decrease with increasing RF, and the fwhm of the distributions decrease with increasing RF, attributed to a reduction of the effects of axial trapping on ion motion. After optimizing the RF amplitude for resolving power (i.e., 320 Vp-p), the effects of the guard bias on IMS resolving power were measured (Figure 6A). With the RF optimized, the resolving power remained relatively constant with increasing guard DC bias, not increasing as it did for the lower RF amplitude.
Table 2. Centroid of Arrival Time Distributions for m/z 922 and Their fwhm as a Function of RF Amplitude with a 90° Turn.
| RF amplitude (Vp-p) | 260 | 280 | 300 | 320 | 340 |
| Arrival time (ms) | 20.1 | 20.0 | 19.8 | 19.7 | 19.6 |
| fwhm (ms) | 0.570 | 0.543 | 0.491 | 0.462 | 0.477 |
Optimization of Electric Field for IMS Resolving Power for Straight and Turn Arrangements
The effects of the electric field on IMS resolving power for both the linear and 90° turn arrangements are shown in Figure 7 for m/z 1222. Electric fields of 14–20 V/cm were used to compare the resolving power between the straight-only and the turn geometry. Error bars are calculated as ± one standard deviation in resolving power from the mean of three trials for each electric field. The IMS resolving power, assuming ideal IMS, for each electric field was also calculated using eq 1 and is included in Figure 7. The straight-only configuration shows that the resolving power increases from 54 to 57 as the electric field is increased from 14 to 20 V/cm. The results are in excellent agreement with eq 1, indicating that the linear geometry behaves as an ideal drift tube. The configuration including the 90° turn does not show an upward trend but instead shows a decreasing trend from 18 to 20 V/cm. Overall, the comparison of the resolving power for the two geometries indicates that any difference between configurations is minor once guard bias voltage and RF amplitude have been optimized.
Figure 7.
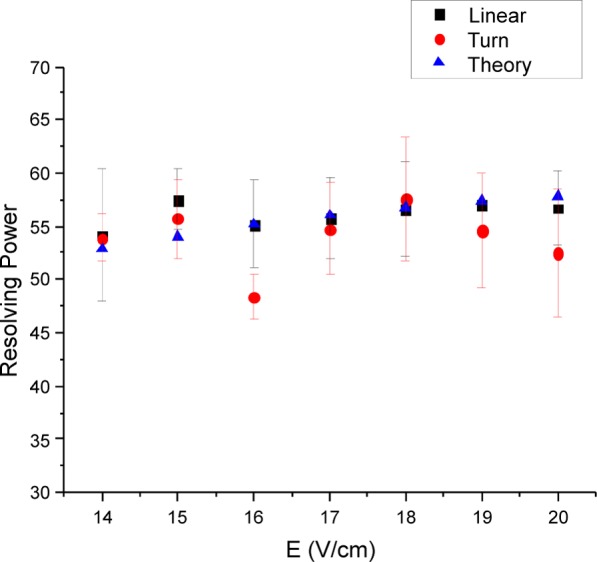
Effects of electric field strength on IMS resolving power for the linear and 90° turn geometries (turn segment substituted for the linear segment). For the linear geometry, the RF was 750 kHz, 220 Vp-p with guard DC bias of 5 V. For the turn geometry, the RF was 685 kHz, 320 Vp-p with guard DC bias of 11 V. Theory data points were calculated using eq 1.
Conclusions
Two implementations of structures for lossless ion manipulations have been initially explored, including a linear geometry that was optimized for ion mobility resolving power and ion transmission. The two key parameters studied were DC bias of the guard electrodes and the amplitude of RF applied to the RF electrodes. The IMS resolving power was shown to be independent of RF amplitude or guard electrode potential. However, ion transmission was dependent on the RF amplitude, increasing with increasing amplitude until optimized, similar to the behavior observed and predicted by equipotential modeling for the ion funnel.69 Ion transmission also depended on the guard DC bias, with reduced ion confinement at low bias and “choking” due to field penetration at high bias. Once optimized at 220 Vp-p RF and a 5 V guard bias, the measured resolving power was similar to the theoretical resolving power for an ideal drift tube for electric fields 14–20 V/cm.50,51
The second SLIM arrangement explored included a 90° turn component. As with the linear geometry, this arrangement displayed increasing ion transmission with increasing RF amplitude until fully effective. RF amplitudes used with the present SLIM design were ∼2-fold higher as compared to the linear arrangement and were attributed to the need to ameliorate the effects of guard DC field penetration into the ion path. The resulting resolving power and transmission efficiency for ions traveling through the turn and linear arrangements were comparable, indicating lossless IMS/MS can be achieved even when ions are turned orthogonally from their initial drift direction. This work demonstrates key building blocks for assembly of larger and more complex arrangements and supports the feasibility of SLIM designs that allow extended ion manipulations including higher resolution ion mobility separations.
Acknowledgments
Portions of this research were supported by the National Institutes of Health (NIH) NIGMS Grants P41 GM103493 (R.D.S.) and R21 GM103497 (Y.M.I.), by the Department of Energy Office of Biological and Environmental Research Genome Sciences Program under the Pan-omics project, and the Laboratory Directed Research and Development (LDRD) program at the Pacific Northwest National Laboratory. Work was performed in the Environmental Molecular Science Laboratory, a U.S. Department of Energy (DOE) national scientific user facility at Pacific Northwest National Laboratory (PNNL) in Richland, WA. PNNL is operated by Battelle for the DOE under Contract DE-AC05-76RL0 1830.
Supporting Information Available
Supporting Information referenced within the text has been associated with this article. This material is available free of charge via the Internet at http://pubs.acs.org.
The authors declare no competing financial interest.
Funding Statement
National Institutes of Health, United States
Supplementary Material
References
- Shelimov K. B.; Jarrold M. F. J. Am. Chem. Soc. 1997, 119, 2987. [Google Scholar]
- Shelimov K. B.; Clemmer D. E.; Hudgins R. R.; Jarrold M. F. J. Am. Chem. Soc. 1997, 119, 2240. [Google Scholar]
- Valentine S. J.; Anderson J. G.; Ellington A. D.; Clemmer D. E. J. Phys. Chem. B 1997, 101, 3891. [Google Scholar]
- Purves R. W.; Barnett D. A.; Ells B.; Guevremont R. J. Am. Soc. Mass Spectrom. 2001, 12, 894. [DOI] [PubMed] [Google Scholar]
- Thalassinos K.; Slade S. E.; Jennings K. R.; Scrivens J. H.; Giles K.; Wildgoose J.; Hoyes J.; Bateman R. H.; Bowers M. T. Int. J. Mass Spectrom. 2004, 236, 55. [Google Scholar]
- Hill H. H.; Hill C. H.; Asbury G. R.; Wu C.; Matz L. M.; Ichiye T. Int. J. Mass Spectrom. 2002, 219, 23. [Google Scholar]
- Wyttenbach T.; Bowers M. T. Top Curr. Chem. 2003, 225, 207. [Google Scholar]
- Badman E. R.; Myung S.; Clemmer D. E. J. Am. Soc. Mass Spectrom. 2005, 16, 1493. [DOI] [PubMed] [Google Scholar]
- Guevremont R.; Purves R. FASEB J. 2005, 19, A767. [Google Scholar]
- Baker E. S.; Bernstein S. L.; Gabelica V.; De Pauw E.; Bowers M. T. Int. J. Mass Spectrom. 2006, 253, 225. [Google Scholar]
- Baumketner A.; Bernstein S. L.; Wyttenbach T.; Bitan G.; Teplow D. B.; Bowers M. T.; Shea J. E. Protein Sci. 2006, 15, 420. [DOI] [PMC free article] [PubMed] [Google Scholar]
- Shvartsburg A. A.; Li F. M.; Tang K. Q.; Smith R. D. Anal. Chem. 2006, 78, 3304. [DOI] [PubMed] [Google Scholar]
- Koeniger S. L.; Clemmer D. E. J. Am. Soc. Mass Spectrom. 2007, 18, 322. [DOI] [PubMed] [Google Scholar]
- Scarff C. A.; Thalassinos K.; Hilton G. R.; Scrivens J. H. Rapid Commun. Mass Spectrom. 2008, 22, 3297. [DOI] [PubMed] [Google Scholar]
- McLean J. A. J. Am. Soc. Mass Spectrom. 2009, 20, 1775. [DOI] [PubMed] [Google Scholar]
- Wyttenbach T.; Baker E. S.; Bernstein S. L.; Ferzoco A.; Gidden J.; Liu D. F.; Bowers M. T. Adv. Mass Spectrom. 2004, 16, 189. [Google Scholar]
- Bernstein S. L.; Wyttenbach T.; Baumketner A.; Shea J. E.; Bitan G.; Teplow D. B.; Bowers M. T. J. Am. Chem. Soc. 2005, 127, 2075. [DOI] [PubMed] [Google Scholar]
- Loo J. A.; Berhane B.; Kaddis C. S.; Wooding K. M.; Xie Y. M.; Kaufman S. L.; Chernushevich I. V. J. Am. Soc. Mass Spectrom. 2005, 16, 998. [DOI] [PubMed] [Google Scholar]
- Ruotolo B. T.; Giles K.; Campuzano I.; Sandercock A. M.; Bateman R. H.; Robinson C. V. Science 2005, 310, 1658. [DOI] [PubMed] [Google Scholar]
- Sudha R.; Kohtani M.; Jarrold M. F. J. Phys. Chem. B 2005, 109, 6442. [DOI] [PubMed] [Google Scholar]
- Benesch J. L.; Robinson C. V. Curr. Opin. Struc. Biol. 2006, 16, 245. [DOI] [PubMed] [Google Scholar]
- Kaddis C. S.; Lomeli S. H.; Yin S.; Berhane B.; Apostol M. I.; Kickhoefer V. A.; Rome L. H.; Loo J. A. J. Am. Soc. Mass Spectrom. 2007, 18, 1206. [DOI] [PMC free article] [PubMed] [Google Scholar]
- Robinson E. W.; Sellon R. E.; Williams E. R. Int. J. Mass Spectrom. 2007, 259, 87. [DOI] [PMC free article] [PubMed] [Google Scholar]
- Sharon M.; Robinson C. V. Annu. Rev. Biochem. 2007, 76, 167. [DOI] [PubMed] [Google Scholar]
- Wyttenbach T.; Bowers M. T. Annu. Rev. Phys. Chem. 2007, 58, 511. [DOI] [PubMed] [Google Scholar]
- Murray M. M.; Bernstein S. L.; Nyugen V.; Condron M. M.; Teplow D. B.; Bowers M. T. J. Am. Chem. Soc. 2009, 131, 6316. [DOI] [PMC free article] [PubMed] [Google Scholar]
- Scarff C. A.; Patel V. J.; Thalassinos K.; Scrivens J. H. J. Am. Soc. Mass Spectrom. 2009, 20, 625. [DOI] [PubMed] [Google Scholar]
- Zhou M. W.; Jones C. M.; Wysocki V. H. Anal. Chem. 2013, 85, 8262. [DOI] [PubMed] [Google Scholar]
- Hyung S. J.; Ruotolo B. T. Proteomics 2012, 12, 1547. [DOI] [PMC free article] [PubMed] [Google Scholar]
- Hoaglund-Hyzer C. S.; Clemmer D. E. Anal. Chem. 2001, 73, 177. [DOI] [PubMed] [Google Scholar]
- Rodriguez-Suarez E.; Hughes C.; Gethings L.; Giles K.; Wildgoose J.; Stapels M.; Fadgen K. E.; Geromanos S. J.; Vissers J. P. C.; Elortza F.; Langridge J. I. Curr. Anal. Chem. 2013, 9, 199. [Google Scholar]
- Kurulugama R. T.; Nachtigall F. M.; Valentine S. J.; Clemmer D. E. J. Am. Soc. Mass Spectrom. 2011, 22, 2049. [DOI] [PMC free article] [PubMed] [Google Scholar]
- Bohrer B. C.; Clemmer D. E. Anal. Chem. 2011, 83, 5377. [DOI] [PMC free article] [PubMed] [Google Scholar]
- Hoaglund-Hyzer C. S.; Lee Y. J.; Counterman A. E.; Clemmer D. E. Anal. Chem. 2002, 74, 992. [DOI] [PubMed] [Google Scholar]
- Valentine S. J.; Kulchania M.; Barnes C. A. S.; Clemmer D. E. Int. J. Mass Spectrom. 2001, 212, 97. [Google Scholar]
- Taraszka J. A.; Counterman A. E.; Clemmer D. E. Fresen. J. Anal. Chem. 2001, 369, 234. [DOI] [PubMed] [Google Scholar]
- Shvartsburg A. A.; Zheng Y. P.; Smith R. D.; Kelleher N. L. Anal. Chem. 2012, 84, 4271. [DOI] [PMC free article] [PubMed] [Google Scholar]
- Ibrahim Y. M.; Shvartsburg A. A.; Smith R. D.; Belov M. E. Anal. Chem. 2011, 83, 5617. [DOI] [PMC free article] [PubMed] [Google Scholar]
- Shvartsburg A. A.; Isaac G.; Leveque N.; Smith R. D.; Metz T. O. J. Am. Soc. Mass Spectrom. 2011, 22, 1146. [DOI] [PMC free article] [PubMed] [Google Scholar]
- Shvartsburg A. A.; Creese A. J.; Smith R. D.; Cooper H. J. Anal. Chem. 2010, 82, 8327. [DOI] [PMC free article] [PubMed] [Google Scholar]
- Kliman M.; May J. C.; McLean J. A. BBA-Mol. Cell. Biol. Ll 2011, 1811, 935. [DOI] [PMC free article] [PubMed] [Google Scholar]
- Fenn L. S.; McLean J. A. Phys. Chem. Chem. Phys. 2011, 13, 2196. [DOI] [PubMed] [Google Scholar]
- Ridenour W. B.; Kliman M.; McLean J. A.; Caprioli R. M. Anal. Chem. 2010, 82, 1881. [DOI] [PMC free article] [PubMed] [Google Scholar]
- Fenn L. S.; Kliman M.; Mahsut A.; Zhao S. R.; McLean J. A. Anal. Bioanal. Chem. 2009, 394, 235. [DOI] [PMC free article] [PubMed] [Google Scholar]
- Fenn L. S.; McLean J. A. Mol. Biosyst. 2009, 5, 1298. [DOI] [PubMed] [Google Scholar]
- Fenn L. S.; McLean J. A. Anal. Bioanal. Chem. 2008, 391, 905. [DOI] [PubMed] [Google Scholar]
- McLean J. A.; Ruotolo B. T.; Gillig K. J.; Russell D. H. Int. J. Mass Spectrom. 2005, 240, 301. [Google Scholar]
- Revercomb H. E.; Mason E. A. Anal. Chem. 1975, 47, 970. [Google Scholar]
- Tolmachev A. V.; Clowers B. H.; Belov M. E.; Smith R. D. Anal. Chem. 2009, 81, 4778. [DOI] [PMC free article] [PubMed] [Google Scholar]
- Rokushika S.; Hatano H.; Baim M. A.; Hill H. H. Anal. Chem. 1985, 57, 1902. [Google Scholar]
- Siems W. F.; Wu C.; Tarver E. E.; Hill H. H.; Larsen P. R.; Mcminn D. G. Anal. Chem. 1994, 66, 4195. [Google Scholar]
- Merenbloom S. I.; Glaskin R. S.; Henson Z. B.; Clemmer D. E. Anal. Chem. 2009, 81, 1482. [DOI] [PMC free article] [PubMed] [Google Scholar]
- Glaskin R. S.; Ewing M. A.; Clemmer D. E. Anal. Chem. 2013, 85, 7003. [DOI] [PubMed] [Google Scholar]
- Karpas Z.; Eiceman G. A.; Ewing R. G.; Algom A.; Avida R.; Friedman M.; Matmor A.; Shahal O. Int. J. Mass Spectrom. Ion Proc. 1993, 127, 95. [Google Scholar]
- Tang K.; Shvartsburg A. A.; Lee H. N.; Prior D. C.; Buschbach M. A.; Li F. M.; Tolmachev A. V.; Anderson G. A.; Smith R. D. Anal. Chem. 2005, 77, 3330. [DOI] [PMC free article] [PubMed] [Google Scholar]
- Bradbury N. E.; Nielsen R. A. Phys. Rev. 1936, 49, 0388. [Google Scholar]
- Ibrahim Y.; Belov M. E.; Tolmachev A. V.; Prior D. C.; Smith R. D. Anal. Chem. 2007, 79, 7845. [DOI] [PMC free article] [PubMed] [Google Scholar]
- Pringle S. D.; Giles K.; Wildgoose J. L.; Williams J. P.; Slade S. E.; Thalassinos K.; Bateman R. H.; Bowers M. T.; Scrivens J. H. Int. J. Mass Spectrom. 2007, 261, 1. [Google Scholar]
- Bush M. F.; Hall Z.; Giles K.; Hoyes J.; Robinson C. V.; Ruotolo B. T. Anal. Chem. 2010, 82, 9557. [DOI] [PubMed] [Google Scholar]
- Smith R. D. In 61st American Society for Mass Spectrometry and Allied Topics, Minneapolis , MN, June 9-13 2013. [Google Scholar]
- Giles K.; Williams J. P.; Campuzano I. Rapid Commun. Mass Spectrom. 2011, 25, 1559. [DOI] [PubMed] [Google Scholar]
- Garimella S. V. B.; Ibrahim Y. M.; Webb I. K.; Tolmachev A. V.; Zhang X.; Prost S. A.; Anderson G. A.; Smith R. D.. J. Am. Soc. Mass Spectrom. 2014.(Accepted) [DOI] [PMC free article] [PubMed]
- Tolmachev A. V.; Webb I. K.; Ibrahim Y. M.; Garimella S. V. B.; Zhang X.; Anderson G. A.; Smith R. D.. Anal. Chem. 2014. [DOI] [PMC free article] [PubMed]
- Clowers B. H.; Ibrahim Y. M.; Prior D. C.; Danielson W. F. 3rd; Belov M. E.; Smith R. D. Anal. Chem. 2008, 80, 612. [DOI] [PMC free article] [PubMed] [Google Scholar]
- Belov M. E.; Ibrahim Y. M.; Smith R. D.. Ion Accumlation Approaches for Increasing Sensitivity and Dynamic Range in the Analysis of Complex Samples. In Practical Aspects of Trapped Ion Mass Spectrometry; March R. E.; Todd J. F. J., Eds.; CRC Press: Boca Raton, 2010; Vol. IV, pp 401−432. [Google Scholar]
- Ibrahim Y. M.; Belov M. E.; Liyu A. V.; Smith R. D. Anal. Chem. 2008, 80, 5367. [DOI] [PMC free article] [PubMed] [Google Scholar]
- Tolmachev A. V.; Udseth H. R.; Smith R. D. Anal. Chem. 2000, 72, 970. [DOI] [PubMed] [Google Scholar]
- Page J. S.; Tolmachev A. V.; Tang K. Q.; Smith R. D. J. Am. Soc. Mass Spectrom. 2006, 17, 586. [DOI] [PMC free article] [PubMed] [Google Scholar]
- Tolmachev A. V.; Kim T.; Udseth H. R.; Smith R. D.; Bailey T. H.; Futrell J. H. Int. J. Mass Spectrom. 2000, 203, 31. [Google Scholar]
Associated Data
This section collects any data citations, data availability statements, or supplementary materials included in this article.