

Abstract
Evidence will be presented that in the article “Novel LC–MS2 Product Dependent Parallel Data Acquisition Function and Data Analysis Workflow for Sequencing and Identification of Intact Glycopeptides” written by Wu, S.-W.; Pu, T.-H.; Viner, R.; Khoo, K.-H. in Anal. Chem. 201486, 5478–5486, noncovalent homo- and heterodimers were mis-identified as glycopeptides bearing well-defined N-linked structures, where the unexplained mass was attributed to excessive O-glycosylation. Noncovalent dimer formation of abundant components has not previously been considered as a complication in high-throughput proteomic analyses.
My observations are based on information presented in the article “Novel LC–MS2 Product Dependent Parallel Data Acquisition Function and Data Analysis Workflow for Sequencing and Identification of Intact Glycopeptides” written by Wu, S.-W.; Pu, T.-H.; Viner, R.; Khoo, K.-H. in Anal. Chem. 201486, 5478–5486 and the raw data associated with it.
Wu et al. beautifully presented that the different MS/MS activation methods, ion trap collision induced dissociation (CID), beam-type CID (higher-energy collisional dissociation (HCD)), and electron transfer dissociation (ETD), deliver different information about the glycopeptide structure, underscoring the necessity of using these data combined. They also demonstrated the utility of “Sweet Heart for HCD”, a software developed by them for N-linked glycopeptide analysis. This software heavily relies on the identification of a characteristic/diagnostic N-glycopeptide fragment, Y1, i.e., the intact peptide retaining the innermost GlcNAc. They illustrated the diagnostic value of this fragment in N-linked glycopeptide identification by comparing data interpretation delivered by Sweet Heart and Byonic, a commercially available search engine that is marketed for glycosylation analysis (ProteinMetrics/Thermo). The data analyzed derived from a tryptic digest of recombinant human soluble EGF-receptor and were acquired using an Orbitrap Fusion Tribrid mass spectrometer. In the original publication, Tables S1-1 and 1-2 in the Supporting Information (fully and partially reproduced as Figures S1 and S11 in the Supporting Information, respectively) sum up the cases where Byonic was obviously wrong, since the Y1 fragment detected contradicted the peptide assignment. These tables themselves are excellent illustrations of some of the issues proteomic studies have to deal with constantly. Quite a few of the mis-assignments might be the results of faulty peak-picking, i.e., of incorrect monoisotopic ion assignments. Unfortunately, this is a recurring issue with high mass, high charge-state, and low intensity ions that are more common for large mass glycopeptides than unmodified sequences. Byonic now has its own peak-picking feature that eliminates most of these problems. However, overlapping ion clusters and missing monoisotopic peaks (see Table 1 and precursor ion profiles in Figures S2, S4, S8, S13, S17, and S20 in the Supporting Information versus calculated values in Figures S3, S7, S10, S14, S18, and S21 in the Supporting Information) still may prevent the accurate determination of the molecular mass. However, the Y1 fragment and carbohydrate fragmentation data together may deliver the correct assignment, i.e., the “Sweet Heart for HCD” approach could succeed.
Table 1. Glycoforms of NC*TSISGDLHILPVAFR Detected in the Spectrum Shown in Figure 2a.
| MH+Xtract | m/zmanually | z | MH+manual | Δ ppm | MHcalc+ | relative intensity | structure, GlcNAc2+ |
|---|---|---|---|---|---|---|---|
| 3278.4616 | 1093.4921 | 3 | 3278.4617 | 3 | 3278.4502 | 31.0 | Man6 |
| 3294.4471 | 1098.8206 | 3 | 3294.4472 | 1 | 3294.4451 | 0.7 | Man6; Cys(O) |
| 3440.5404 | 1147.5183 | 3 | 3440.5403 | 11 | 3440.5031 | 100.0 | Man7 |
| 3456.4944 | 1152.8363 | 3 | 3456.4943 | –1 | 3456.4980 | 1.8 | Man7; Cys(O) |
| 3468.4984 | 1156.8376 | 3 | 3468.4982 | 0 | 3468.4980b | 4.9 | Man6Man(28) |
| 3482.5202 | 1161.5116 | 3 | 3482.5202 | 2 | 3482.5136d | 19.6 | Man6Man(42) |
| 3493.4240 | 1165.1427 | 3 | 3493.4135 | 0 | 3493.4130 | 3.8 | Man7(Fe) |
| 3498.5193 | 1166.8466c | 3 | 3498.5252 | 5 | 3498.5086 | 1.0 | Man6Man(42); Cys(O) |
| 3602.5667 | 1201.5271 | 3 | 3602.5667 | 3 | 3602.5559 | 14.7 | Man8 |
| 3618.5551 | 1206.8566 | 3 | 3618.5552 | 1 | 3618.5508 | 0.6 | Man8; Cys(O) |
| 3630.5606 | 1210.8584 | 3 | 3630.5606 | 3 | 3630.5508b | 4.4 | Man7Man(28) |
| 3644.5752 | 1215.5299 | 3 | 3644.5751 | 2 | 3644.5664d | 24.2 | Man7Man(42) |
| 6717.9590 | 1344.6012e | 5 | 6718.9767 | 153 | 6717.9455 | 0.6 | Man6 and Man7 dimer |
| 6879.0080 | 1376.8010 | 5 | 6879.9757 | –3 | 6879.9984 | 1.3 | Man7 dimer |
| 6922.0476 | 1385.2183c | 5 | 6922.0623 | 8 | 6922.0089d | 0.4 | Man7 and Man6Man(42), and Man6 and Man7Man(42) dimers |
| 7083.0778 | 1417.6274 | 5 | 7084.1077 | 6 | 7084.0617d | 0.7 | Man7 and Man7Man(42) dimer |
C* corresponds to carbamidomethyl Cys; Cys(O) indicates the oxidation of alkyl Cys. The first column represents automated deconvolution values using Xtract, a feature of Thermo’s Xcalibur software. The correct value determined for the Man6 and Man7 dimer indicates that it can compensate for the missing monoisotopic peak.
Assumed formylation of a Man residue.
Overlapping ion clusters, ambiguous monoisotopic peak assignment.
Assumed acetylation of a Man residue.
Missing monoisotopic peak, probably due to thresholding in data acquisition.
There are examples for metal- and ammonia-adduct formation and covalent modifications. Such fortuitous modifications during sample preparation/analysis are the downfall of automated data interpretation. Search engines cannot overwrite the search parameters even when it is blatantly obvious for the human observer that something unexpected happened. For example, in this glycosylation study CID fragmentation indicated that mannose residues were randomly partially formylated (+28 Da) (Figure S2 in the original paper) or acetylated (+42 Da). Whenever glycans are covalently modified or form noncovalent adducts, even if the nature of the modification cannot be deciphered, the same Y1 fragment shows that spectra are from glycoforms of the same peptide, and this was indeed correctly presented in the article.
The more interesting cases are those mis-identifications when, after correcting for the mass of the peptide sequence based on the Y1 fragment detected, the authors could not account for 1500–3500 Da mass differences (see the list in Figures S1 and S11 in the Supporting Information). The authors concluded the HCD and CID data of m/z 1344.6(5+) (Figure S2 in the Supporting Information) represent the peptide NCTSISGDLHILPVAFR bearing GlcNAc2Man7 at Asn-1, and an O-linked structure is responsible for the 3278 Da mass that is “missing”. This is a very unlikely explanation. There are only three potential O-glycosylation sites in this peptide. If all these sites were occupied with a SAGalGalNAc structure (one of the most common mammalian O-linked carbohydrates), whose presence is suggested in the CID spectrum by the m/z 657 ion (Figure S2/C in the Supporting Information), this would only account for 1968 Da. There are no fragments indicating larger O-linked structures. Furthermore, there is no sign of sialic acid in the HCD spectrum (Figure S2B in the Supporting Information): its abundant oxonium ions should be seen at m/z 274 and 292; and the ion trap CID spectrum (Figure S2C in the Supporting Information; Figure 1B) does not look typical either. In the CID spectrum one would expect to see an ion series of somewhat even abundance corresponding to the loss of terminal sugars or multiunit parts of an antennae as well as a dominant Y1 fragment, just like in Figure 1A. However, the CID spectrum (Figure S2C in the Supporting Information and Figure 1B) is dominated by two species: the NCTSISGDLHILPVAFR peptide bearing GlcNAc2Man6 and GlcNAc2Man7 structures, abundant 2+ and 3+ ions were detected for both. This observation gave me the idea that the precursor ion picked for the MS/MS analysis must have been the (5+) heterodimer formed from these glycoforms, i.e., [(M(Man6)M(Man7)H5]5+
Figure 1.

Panel A shows the CID data of the NC(Carbamidomethyl)TSISGDLHILPVAFR peptide modified at Asn-1 with a GlcNAc2Man7 structure, precursor at m/z 1147.5(3+). Oxonium ions are indicated with their sugar compositions, while ‘Y’ fragments are labeled with the sugar losses. Obviously the identity of the sugar units cannot be determined from these data, so the assignments are based on common knowledge of mammalian N-linked glycosylation. Panel B displays the CID of m/z 1344.6(5+). These data suggest that a noncovalent heterodimer of the Man6 and Man7 glycoforms was fragmented. Both spectra were acquired in the linear ion trap so are low resolution and low mass accuracy data.
Figure 2.

MS survey scan from which the precursor ion for the CID spectrum in Figure 1B was selected. The inset shows the precursor ion cluster. Table 1 lists the different glycoforms present in this spectrum.
The authors kindly shared the raw data with me. After a thorough investigation, I am convinced that all those precursor ions that were reported with the corrected amino acid sequence shortened to NCTSISGDLHILPVAFR, but with a large “mass defect”, represent noncovalent dimers formed in the gas-phase in the mass spectrometer. In addition to the example discussed above, CID and MS data of five additional noncovalent dimers are presented in the Supporting Information (Figures S4, S8, S12, S16, and S19). The most convincing proof for the existence of heterodimers is shown in Figure S15 in the Supporting Information, which is the HCD spectrum of a glycopeptide and an unrelated peptide heterodimer. Peptide fragments unambiguously confirm the presence of both components. Wu et al. correctly identified the Y1 fragment and, thus, the glycosylated sequence in this “compound” (as well as for all the other noncovalent assemblies). Nevertheless, Sweet Heart could not deliver the correct interpretation.
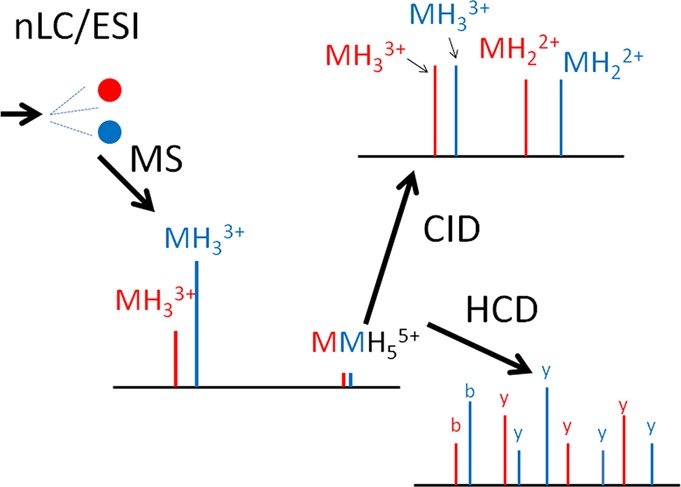
Noncovalent gas-phase cluster formation is a known phenomenon. Studies on the fragmentation mechanism of peptide clusters1 or their utilization for controlled peptide bond formation2 have been reported. Similarly, nonspecific noncovalent gas-phase interaction between peptides and oligosaccharides has been described.3 More than 20 years ago we reported that abundant analytes could be detected in the high energy CID spectra of any “background” precursor ion, probably due to nonspecific cluster formation between the analytes and the liquid “matrix”.4 With this said, I am not aware of any publication when noncovalent dimerization has been considered in the context of high-throughput proteomic experiments. One cannot exclude the possibility that noncovalent homo- and heterodimers are formed during nLC–MS experiments from the more abundant components of a complex mixture of high dynamic range (almost all “real life” samples qualify), and such noncovalent dimers may “dwarf” the minor components. Ions representing such dimers may be selected for MS/MS analysis, and there is a good chance for mis-interpretation. This danger is obviously enhanced whenever a study is aimed at the characterization of relatively “rare” large molecules, i.e., whenever precursors of high m/z value, high charge state, and relatively low abundance are targeted for MS/MS analysis. Such experiments would include studies of cross-linked peptides from protein complexes or as in the present example, intact glycopeptide analysis. It is not known how frequently this might occur and thus how much of a problem this might represent for automated data interpretation. I cannot help but wonder how many times this might have resulted in reporting incorrect structural assignments already.
Acknowledgments
K.F.M. is supported by NIH Grant NIGMS 8P41GM103481 (to the Bio-Organic Biomedical Mass Spectrometry Resource at UCSF, Director: A.L. Burlingame).
Supporting Information Available
Additional information as noted in text. This material is available free of charge via the Internet at http://pubs.acs.org.
The authors declare no competing financial interest.
Funding Statement
National Institutes of Health, United States
Supplementary Material
References
- Jurchen J. C.; Garcia D. E.; Williams E. R. J. Am. Soc. Mass Spectrom. 2003, 14, 1373–1386. [DOI] [PMC free article] [PubMed] [Google Scholar]
- Lee S.; Valentine S. J.; Reilly J. P.; Clemmer D. E. J. Am. Chem. Soc. 2011, 133, 15834–15837. [DOI] [PMC free article] [PubMed] [Google Scholar]
- Comeau A. N.; Renaud J. B.; Mironov G. G.; Berezovski M. V.; Mayer P. M. Int. J. Mass Spectrom. 2012, 316-318, 31–39. [Google Scholar]
- Falick A. M.; Medzihradszky K. F.; Walls F. C. Rapid Commun. Mass Spectrom. 1990, 4, 318–322. [DOI] [PubMed] [Google Scholar]
Associated Data
This section collects any data citations, data availability statements, or supplementary materials included in this article.