

Abstract
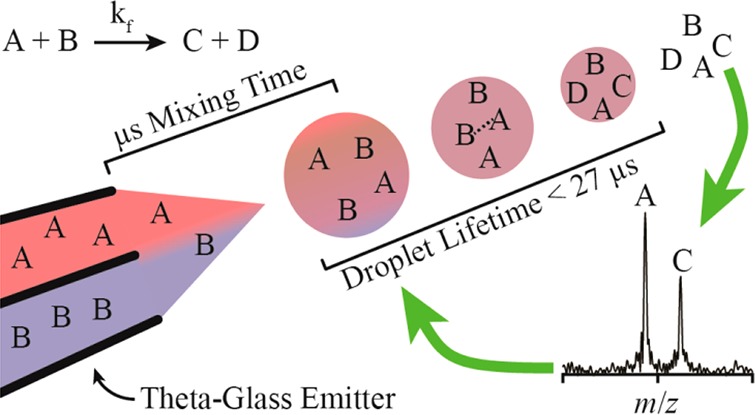
Double-barrel wire-in-a-capillary electrospray emitters prepared from theta-glass capillaries were used to mix solutions during the electrospray process. The relative flow rate of each barrel was continuously monitored with internal standards. The complexation reaction of 18-crown-6 and K+, introduced from opposite barrels, reaches equilibrium during the electrospray process, suggesting that complete mixing also occurs. A simplified diffusion model suggests that mixing occurs in less than a millisecond, and contributions of turbulence, estimated from times of coalescing ballistic microdroplets, suggest that complete mixing occurs within a few microseconds. This mixing time is 2 orders of magnitude less than in any mixer previously coupled to a mass spectrometer. The reduction of 2,6-dichloroindophenol by l-ascorbic acid was performed using the theta-glass emitters and monitored using mass spectrometry. On the basis of the rate constant of this reaction in bulk solution, an apparent reaction time of 274 ± 60 μs was obtained. This reaction time is an upper limit to the droplet lifetime because the surface area to volume ratio and the concentration of reagents increase as the droplet evaporates and some product formation occurs in the Taylor cone prior to droplet formation. On the basis of increases in reaction rates measured by others in droplets compared to rates in bulk solution, the true droplet lifetime is likely 1–3 orders of magnitude less than the upper limit, i.e., between 27 μs and 270 ns. The rapid mixing and short droplet lifetime achieved in these experiments should enable the monitoring of many different fast reactions using mass spectrometry.
Rapid mixing of two or more solutions is often required to investigate the kinetics of fast chemical and biochemical reactions.1−3 Mixers that are commonly used for this purpose include laminar,4,5 turbulent,6,7 and chaotic8−10 flow mixers, where the dead time decreases with increasing flow rate.4,11 The performance of these types of mixers has been extensively reviewed.12,13 A dead time of 8 μs has been achieved with a flow rate of ∼100 nL/s using laminar flow mixers.14 The use of mass spectrometry (MS) to monitor reactions in mixing experiments has the advantage of high chemical specificity. Several in-line mixers have been coupled to MS, including continuous,15,16 stopped,17,18 and laminar3 flow mixers. The shortest dead time reported for mixers coupled to MS is 200 μs.3
Numerous techniques have also been used to mix solutions during the electrospray process, including fused-droplet electrospray,19,20 multiple channel electrospray,21,22 extractive electrospray,23−25 and dual-sprayer microchips.26−28 Both desorption electrospray ionization2,29−31 and ambient ion soft landing32 techniques have been used to carry out solution-phase reactions in charged microdroplets. Similarly, mixing from theta-glass emitters (double-barrel wire-in-a-capillary emitters made from theta glass) has been used to form noncovalent complexes,33 conduct hydrogen/deuterium exchange reactions,33 unfold proteins,34 and introduce supercharging reagents to protein solutions,34 all during the electrospray process. Mixing in microdroplets has the potential advantage of minimizing sample volume,35−37 but reported mixing times in microdroplets are greater than those in laminar flow mixers. For example, complete mixing of two 80 μm diameter ballistic droplets takes ∼10 ms to occur,38 and complete mixing within a 25 μm diameter droplet generated by flowing multiple streams of aqueous reagent solutions into an inert stream of water immiscible oil occurs in ∼2 ms.37
Microdroplets formed in atmosphere can undergo desolvation, and the droplet lifetime depends on the evaporation rate. Evaporation rates of heptane, octane, and xylene electrospray droplets ranging in initial size from 3 to 60 μm have been measured using phase Doppler anemometry,39 and the evaporation rate depends on both the solvent and the square of the initial droplet diameter. The initial diameter of electrospray droplets generated using capillaries with outer diameters as small as 12.5 μm40 to as large as a centimeter41,42 have been measured using various techniques, including optical microscopy,42,43 flash shadowgraph techniques,44−46 phase Doppler techniques,39,44,47−50 scanning mobility particle sizers,51,52 and white light particle counters.41 Electrospray droplets have been observed from an electrospray capillary with an outer diameter (o.d.) as small as 12.5 μm using a stereomicroscope,40 but droplets from a capillary with an o.d. of <1 μm were too small to be visualized.40 The initial size of an electrospray droplet can depend on the tip diameter for a given solution, but heptane droplets generated from an electrospray capillary with an outer diameter of 0.45 mm can have initial diameters of ∼200 μm,46 whereas ethylene glycol droplets generated from a 10 mm o.d. electrospray capillary can have initial diameters as small as ∼1.5 μm.40 Therefore, the exact relationship between the size of the electrospray capillary and the initial size of the droplet depends on many factors. There are several models42,53−55 that have been reported for determining the size of droplets generated using electrospray based on the flow rate and various other solution and instrumental conditions. Schmidt et al.40 compared several of these models and reported that they predicted droplet diameters differing by 4 orders of magnitude (7.7 × 10⁻⁸ to 1.4 × 10⁻⁴ m) for the same water/methanol/acetic acid solution under otherwise identical conditions.
As droplets evaporate, the surface area to volume ratio and the concentration of reagents increase and up to a 4 unit change in the pH can occur.56,57 These factors can increase the rate of product formation in droplets by 1–3 orders of magnitude over bulk solution rates.31,58−60 The relative contribution of each of these factors to the increased rate of product formation is unknown.
In this study, theta-glass emitters were used to mix solutions during nanoelectrospray ionization (nano-ESI). The extent of mixing between solutions loaded into opposite barrels was measured by carrying out a fast complexation equilibrium reaction, and an apparent droplet lifetime was obtained by monitoring a fast redox reaction with a known forward rate constant. On the basis of increased rates of product formation in droplets compared to rates in bulk solution measured by others, the droplet lifetime is estimated to be less than ∼27 μs.
Experimental Section
Mass spectra were acquired using a 9.4 T Fourier-transform ion cyclotron resonance mass spectrometer that is described in detail elsewhere.61 Nanoelectrospray ionization was performed using premium theta glass (Warner Instruments, LLC, Hamden, CT) pulled into tips using a model p-87 Flaming/Brown micropipette puller equipped with an FB330B square box filament (Sutter Instruments Co., Novato, CA). Theta glass is a borosilicate glass capillary divided into two separate barrels by a borosilicate glass wall. Platinum wires connected to the ground of the instrument were brought into contact with the solution in each barrel, and electrospray was initiated by applying a potential of ∼−700 V to the heated capillary of the nanoelectrospray interface. A backing pressure of ∼10 psi (CO2) was applied to the solutions during electrospray using a pressure regulator. A schematic of this experimental setup is shown in Scheme S-1 in the Supporting Information. A Hitachi tabletop microscope TM-1000 scanning electron microscope (Hitachi High-Technologies Co., Tokyo, Japan) was used to image the tips. All reported uncertainties are one standard deviation from three replicate measurements. Diffusion coefficients used to model the diffusion of K+, Na+, and 18C6 in water are 0.00196,62 0.00163,63 and 0.00060 μm2/μs,64 respectively.
Leu-enkephalin acetate salt hydrate, met-enkephalin acetate salt hydrate, l-ascorbic acid, and 18-crown-6 were obtained from Sigma-Aldrich (St. Louis, MO), KCl was from Mallinckrodt Baker, Inc. (Phillipsburg, NJ), HCl 0.1 N was from EMD Millipore Chemicals (Darmstadt, Germany), and 2,6-dichloroindophenol Na salt and NaCl were from Fisher Scientific (Fair Lawn, NJ). All chemicals were used without further purification, and all solutions were prepared in 18.2 MΩ water from a Milli-Q integral water purification system (Millipore, Billerica, MA).
Results and Discussion
Characterization of Theta-Glass ESI Emitters
Theta-glass capillaries are divided into two separate barrels by a central divider, which after the pulling process extends to the end of the tip (Figure 1a; tip oriented so that the divider is perpendicular to the sample stand). Thus, solutions loaded into opposite barrels do not mix until flow is initiated by applying a potential to the capillary of the nanoelectrospray interface and a backing pressure is applied to the solutions. The tip o.d. is 1.71 ± 0.04 μm perpendicular to the divider (Figure 1a) and 1.36 ± 0.02 μm along the axis of the divider (Figure 1b). The thickness of the outer wall is uniform in both orientations (0.16 ± 0.02 μm) and is the same as the inner divider thickness (0.16 ± 0.01 μm). The length of the emitters is 5.47 ± 0.05 cm.
Figure 1.
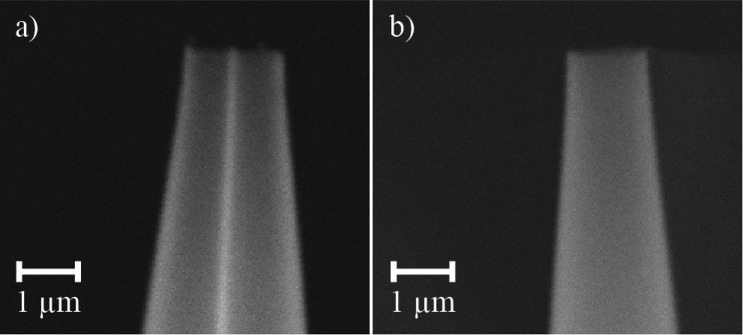
Electron micrographs of the tips of theta-glass emitters with the inner divider (a) perpendicular to and (b) parallel to the sample stand.
Measuring Relative Flow Rates of Individual Barrels
The overall flow rate from both barrels was obtained by measuring the change in volume and mass of an aqueous solution of 500 μM NaCl and 500 μM 18-crown-6 after spraying for ∼10 min (density of 1.0 mg/mL for water containing less than 1% NaCl).65 The flow rate is 1.4 ± 0.4 nL/s, which is 2 orders of magnitude lower than the flow rates of common mixers in which high mixing efficiency is achieved on the order of tens of microseconds.13 The flow rate remains relatively constant when the backing pressure is doubled and when the ionic strength of the solution differs by more than an order of magnitude (data not shown).
In order to obtain quantitative information from mixing experiments preformed using theta-glass emitters, the flow rate of each barrel must be measured individually. To determine the relative flow rate of each barrel, 10 μM solutions (pH = 2) of Leu-enkephalin (L-Enk) and Met-enkephalin (M-Enk) (polypeptides YGGFX, X = L and M, respectively) were prepared and loaded into the separate barrels. The protonated forms of the peptides were observed in the mass spectra at a ratio of 1.8 ± 0.1 to 1, L-Enk to M-Enk (Figure 2a). To determine the relative ionization efficiencies of these peptides, an equimolar mixture of L-Enk and M-Enk was prepared (5 μM, pH = 2) and loaded into both barrels of the theta-glass emitters. On the basis of the relative abundances of the protonated forms of the peptides, the relative ionization efficiency of L-Enk to M-Enk is 1.7 ± 0.1 (Figure 2b). Although these peptides differ by only a single amino acid, even minor differences in structure can lead to significant differences in ionization efficiencies.66 The relative flow rates of the individual barrels were established using the relative abundances and ionization efficiencies of the internal standards, and in this experiment, the relative flow rate of the L-Enk solution to the M-Enk solution was 1.1 ± 0.1 to 1, suggesting that relative flow rates are nearly even and are highly reproducible between tips.
Figure 2.

Representative ESI mass spectra of L-Enk and M-Enk solutions (a) loaded into separate barrels of a theta-glass emitter and (b) premixed and loaded into both barrels.
Mixing Efficiency
In order to determine the extent of mixing that occurs in these experiments, a fast complexation equilibrium reaction was performed using the theta-glass emitters. If incomplete mixing occurs in these experiments, only a portion of the reagents loaded into the opposite barrels will interact during the electrospray process and the ratio of products to reactants in the mass spectra will be lower than that at equilibrium. Complexation of 18-crown-6 (18C6) with K+ in water has a forward rate constant of 2.45 × 10⁹ mol s–1 and an equilibrium constant of 116.4 (values are averages of values measured by others).67 Protonated 18C6 is not observed in the mass spectra, so the product to reactant ratio cannot be measured directly. For this reason, 18C6 is mixed with Na+ to form the complex [18C6 + Na]+, which has an equilibrium constant of 7.0 (average of values measured by others).67
A solution (A) containing 100 μM 18C6 and 500 μM NaCl (pH = 2) was mixed with solutions (B) containing between 50 and 1000 μM KCl (pH = 2). A calibration curve for the ratio [18C6 + K]+/[18C6 + Na]+ was generated as a function of the initial concentration of K+ over the initial concentration of Na+ in solution ([K]o/[Na]o) (Figure 3a). A representative mass spectrum of a premixed solution of A and B, where the initial concentrations of Na+ and K+ are equal, is inset into Figure 3a. To determine how the relative abundances of the two complex ions reflect the corresponding abundances in solution, an equilibrium ratio is derived from the equilibrium constants of the two complexes. The equilibrium constants of these complexes are
| 1 |
where M = Na+ or K+, KM is the equilibrium constant of the reaction involving M, [18C6 + M]eq and [18C6]eq are the equilibrium concentrations of the complexed and uncomplexed forms of 18C6, respectively, and [M]eq is the equilibrium concentration of M. In all experiments, <1% of M is complexed with 18C6, so [M]eq is approximated as the initial concentration of M, [M]o. Solving eq 1 for both Na+ and K+, rearranging, and dividing [18C6 + K]eq by [18C6 + Na]eq gives eq 2:
| 2 |
The ratio [18C6 + K]eq/[18C6 + Na]eq as a function of the ratio [K]o/[Na]o is linear with a slope of 16.8 (Figure 3a), which is nearly the same as the expected value of KK/KNa = 16.6. This result indicates that the ratios of abundances of the two complex ions are approximately equal to their relative abundances in solution.
Figure 3.
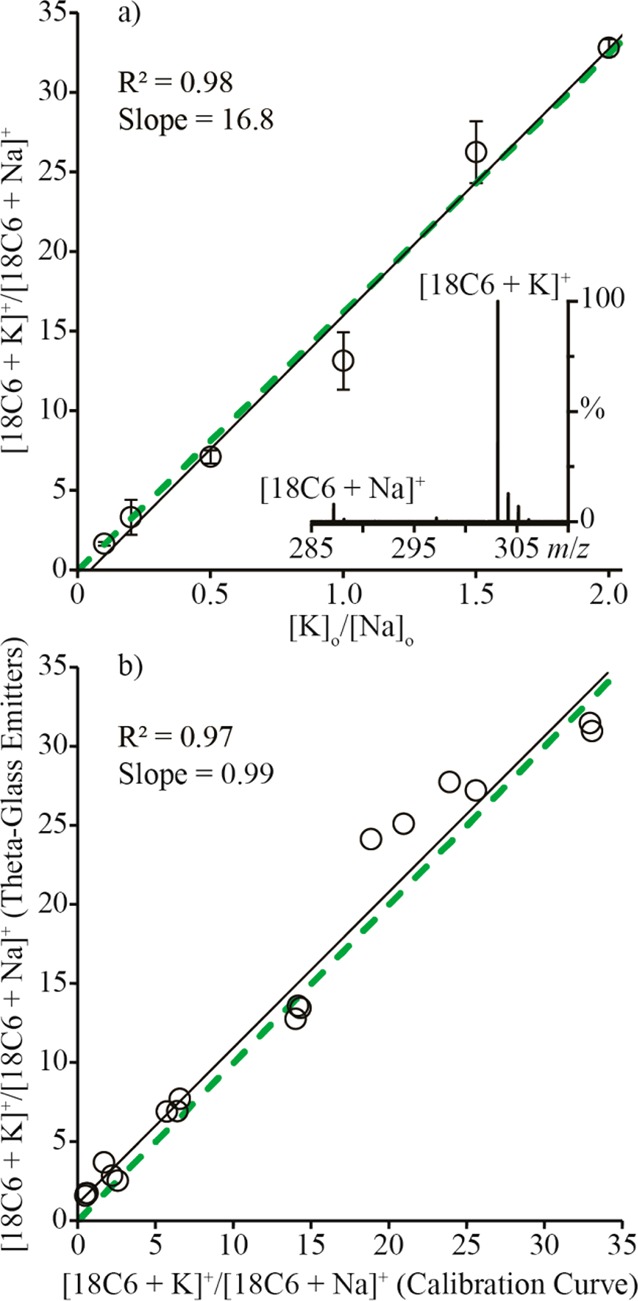
(a) The ratio [18C6 + K]+/[18C6 + Na]+ in the mass spectra of premixed solutions (circles) and predicted by eq 2 (dashed green line), both as functions of the ratio [K]o/[Na]o. The inset is a representative mass spectrum of a solution containing Na+/K+/18C6 at a ratio of 1:1:0.05. (b) The ratio [18C6 + K]+/[18C6 + Na]+ in the mass spectra from the theta-glass emitters as a function of the same ratio predicted by a linear fit to the calibration curve data (open circles). The dashed green line is a 1:1 correspondence between the axes. Black lines in both panel a and panel b are linear fits to the data.
The extent of mixing between two solutions loaded into opposite barrels of the theta-glass emitters was determined by loading solution A into one barrel and solutions of B into the other barrel. L-Enk and M-Enk were used as internal standards in these respective solutions to determine the relative flow rates of the two barrels. The initial concentrations of Na+ and K+ in the droplets were determined from the initial concentrations of the ions in the respective solutions and from the respective flow rates. The ratio [18C6 + K]+/[18C6 + Na]+ in the mass spectra of the solutions mixed from the theta-glass emitters as a function of the same ratio determined from the linear fit to the calibration curve data results in a line with a slope of 0.99 and a correlation coefficient of 0.97 (Figure 3b). These results indicate that the complexation of 18C6 with K+ reaches equilibrium during nano-ESI and that complete mixing occurs between solutions sprayed from opposite barrels of the theta-glass emitters.
Estimates of the Mixing Time
An estimate of the maximum time required for mixing to occur in the electrospray droplets was made by assuming that the mixing time is diffusion-limited. Concentration profiles in the droplet are modeled as a function of both the distance from the center of the droplet, d, and time, t, using the classical solution to Fick’s second law of diffusion for finite boundary conditions:
| 3 |
where c(d,t) is the concentration as a function of d and t, co is the concentration at t = 0, co/2 is the equilibrium concentration (assuming even flow from both barrels), erf is the error function, and D is the diffusion coefficient. Only diffusion in the direction perpendicular to the solution interface is considered, and the outer boundaries correspond to the droplet radius. Because there is significant uncertainty in the initial droplet size in these experiments, mixing times are calculated for droplets with initial diameters of one-half and one-tenth the outer diameter of the tip of the electrospray capillary (o.d.). Because mixing should occur across the interface between the solutions in the absence of turbulent flow, the tip diameter of 1.71 μm, measured perpendicular to the inner divider, is used as the o.d.
The concentration of K+, Na+, and 18C6 as a function of the distance from the center of a 0.86 μm droplet (one-half the o.d.) at 0, 23, and 732 μs are shown in Figure 4a–c, respectively. The relative concentrations of [18C6 + K]+ and [18C6 + Na]+ were calculated as a function of the distance from the center of the droplet using the concentration profiles in Figure 4a–c and the equilibrium constants (eq 1). Relative concentrations of the complexes as a function of the distance from the center of a 0.86 μm droplet at 0, 29, and 732 μs are shown in Figure 4d–f, respectively. From these data, the ratio [18C6 + K]+/[18C6 + Na]+ as a function of time can be determined. At 23 and 732 μs for all initial concentrations of K+ in solution B, this ratio is ∼42% and ∼90% of the equilibrium ratio, respectively. On the basis of the standard deviations of the calibration curve data (∼10% of the average values, Figure 3a), the ratio of the complexes at 732 μs would be nominally the same within the uncertainty of the measurement as that from a premixed solution and mixing would appear complete. Similar extents of diffusion-limited mixing in a 0.17 μm droplet (one-tenth the o.d.) would take 0.9 and 29 μs to occur, respectively. These mixing times are upper limits because droplet evaporation reduces the droplet radius39 and, therefore, the distance material must diffuse. Turbulence in the droplet will also significantly increase the rate of mixing over that of a diffusion-limited system.
Figure 4.

Concentrations of K+ (blue line), Na+ (red dots), and 18C6 (green dashes) as a function of the distance from the center of a 0.86 μm droplet at (a) 0, (b) 23, and (c) 732 μs. Relative abundances of [18C6 + K]+ (blue dots and dashes) and [18C6 + Na]+ (red double-dashes) as a function of the distance from the center of the droplet at (d) 0, (e) 23, and (f) 732 μs. Initial concentrations used to calculate relative abundances are 500 μM Na+ and 100 μM 18C6 in solution A and 250 μM K+ in solution B. Horizontal dashed, gray lines represent equilibrium concentrations (a–c) and abundances (d–f).
The effect that turbulence might have on the mixing times in these experiments is estimated by comparing the calculated diffusion-limited mixing times to the measured mixing times of coalescing ballistic microdroplets, studied by Graceffa et al.38 In that study, 80 μm diameter ballistic droplets were generated using two synchronized drop-on-demand inkjet systems, and droplets containing aqueous cytochrome c were collided with droplets containing aqueous sodium acetate buffer. Stroboscopic synchrotron radiation microbeam small-angle X-ray scattering was used to image the redistribution of cytochrome c within the newly formed 100 μm droplets, and cytochrome c was uniformly distributed after ∼10 ms. Diffusion of 18C6, K+, and Na+ in a 100 μm droplet would take ∼10 s to form the complexes [18C6 + K]+ and [18C6 + Na]+ at 90% of the equilibrium ratio, indicating that turbulence increased the mixing rate in the ballistic microdroplets by 3 orders of magnitude over the rate of diffusion-limited mixing. If turbulence contributes equally to mixing from the theta-glass emitters, complete mixing could occur in well under a microsecond.
To estimate the extent of mixing that occurs in the Taylor cone prior to droplet formation, the volume of solution in the Taylor cone is estimated as the volume of a cone with a height 4 times the o.d.68 and with a radius equal to the o.d. At the measured flow rate of 1.4 ± 0.4 nL/s, a reagent molecule spends less than 11 μs in the Taylor cone prior to droplet formation. This suggests that a significant extent of mixing will occur prior to droplet formation if contributions from turbulent mixing are significant, but mixing will primarily occur in the droplet if mixing is diffusion-limited.
Droplet Lifetimes
An upper limit to the lifetime of a droplet can be obtained by measuring the extent to which a reaction with a known rate constant occurs during nano-ESI. The reduction of 2,6-dichloroindophenol (DCIP) by l-ascorbic acid (L-AA) (Scheme 1) has a forward rate constant of 5.6 × 10⁴ L mol–1 s–1 at pH = 3.69 A solution (C) containing 10 μM DCIP (pH = 3) was loaded into one barrel of the theta-glass emitters, and solutions (D) containing between 10 and 50 mM L-AA (pH = 3) were loaded into the other barrel. Figure 5a shows a representative mass spectrum resulting from mixing solutions C and D (50 mM L-AA) from the theta-glass emitters. Due to the large excess of L-AA in solution, L-AA carries away a substantial fraction of the available charge in the form of protonated L-AA (m/z 177.039, data not shown), resulting in a low signal-to-noise ratio for DCIP. The protonated oxidized and reduced forms of DCIP have overlapping isotope distributions, but these ions can be readily resolved (inset to Figure 5a, the third isotope peak of oxidized DCIP and the first isotope peak of reduced DCIP are shown). The fraction of DCIP that is reduced increases as a function of the concentration of L-AA in solution D (Figure 5b).
Scheme 1. Reduction of 2,6-Dichloroindophenol by l-Ascorbic Acid.
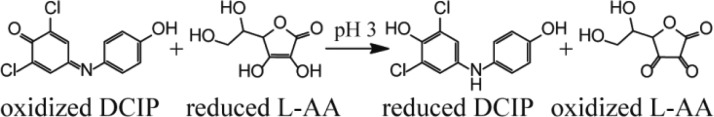
Figure 5.

(a) Representative mass spectrum of a 10 μM DCIP solution mixed with a 50 mM L-AA solution (both pH = 3) from a theta-glass emitter. The inset shows the third isotope peak of oxidized DCIP and the first isotope peak of reduced DCIP. (b) The fraction of DCIP reduced as a function of the concentration of L-AA in the opposite barrel. (c) Reaction times calculated from the relative abundances of oxidized and reduced DCIP using eq 6 as a function of the initial concentration of L-AA in solution.
Because the initial concentration of L-AA is in large excess of the initial concentration of DCIP, this reaction can be modeled using pseudo-first-order reaction kinetics. The pseudo-first-order integrated rate law for this reaction is
| 4 |
where [L-AA]o is the initial concentration of L-AA, kf is the forward reaction rate constant, t is the reaction time, and [oDCIP]o and [oDCIP]t are the concentrations of oxidized DCIP at times 0 and t, respectively. The initial concentration of oxidized DCIP in the droplet was determined using the initial concentration of oxidized DCIP in solution C and the relative abundances of the internal standards (L-Enk in solution C and M-Enk in solution D). [oDCIP]t was calculated from the abundances of the oxidized and reduced forms of DCIP using the equation
| 5 |
where AoDCIP and ArDCIP are the abundances of the oxidized and reduced forms of DCIP, respectively, and iDCIP is the relative ionization efficiency of the oxidized form of DCIP relative to the reduced form. iDCIP was measured separately (Figure S-1, Supporting Information) and is 1.0 ± 0.2, which is in good agreement with a previously published value2 of 1.09 ± 0.08. Combining eq 4 with eq 5 gives eq 6:
| 6 |
which was used to determine the apparent reaction time. On the basis of the rate constant from bulk solution, the average apparent reaction time is 274 ± 60 μs. This value does not appear to change as a function of the concentration of L-AA in solution D (Figure 5c).
The average apparent reaction time is an upper limit to the droplet lifetime because the rates of chemical reactions in rapidly desolvating droplets are greater than in bulk solution.58 The rapid desolvation of a droplet leads to increased reagent concentrations, a larger surface area to volume ratio, and a decrease in pH. Cumulatively, these factors can increase the rate of product formation within a rapidly desolvating droplet by between 1 and 3 orders of magnitude,58 but the relative contributions of each of these factors are poorly characterized. The forward rate constant for the reduction of DCIP by L-AA increases by less than 3% from pH = 3 to pH = 1,69 so pH changes likely have little impact on the rate of product formation in these experiments. However, increases in reagent concentrations and the surface area to volume ratio within the droplet occur, so the true average lifetime of a nano-ESI droplet may be between 10 and 1000 times less than the average apparent reaction time based on the bulk solution rate. Thus, mixing and reactions in these experiments likely occur between about 27 μs and 270 ns. Some product formation will occur in the Taylor cone, which will contribute to a greater apparent droplet lifetime, so the actual droplet lifetime is likely less than 27 μs. This same reaction was previously used to characterize a continuous flow mixing system combined with desorption electrospray (DESI) mass spectrometry of the subsequent liquid jet stream. A mixing time of 2.5 ms was reported, with an instrumental time resolution of 300 μs at longer times obtained by increasing the distance between the mixer and the DESI source. The mixing time we report for this reaction is at least 2 orders of magnitude lower.
The mixing time in conventional mixers is typically controlled by varying either the solution flow rate or the geometry of the mixing region.13 In nano-ESI, the droplet lifetime depends on the initial droplet diameter,39 and thus on the diameter of the tip of the electrospray capillary40 as well as the solution flow rate.42,53−55 It should be possible to acquire kinetic data at multiple time points using theta-glass emitters by varying either the diameter of the tip of the emitters or the backing pressure to control the solution flow rate.
Conclusions
Theta-glass emitters were used to mix two different solutions during the electrospray process at a flow rate of 1.4 ± 0.4 nL/s. This flow rate is 2 orders of magnitude less than typical flow rates for common mixers in which mixing is achieved in tens of microseconds.13 On the basis of probable sizes of electrospray droplets, rates of diffusion, and mixing times of coalescing ballistic microdroplets, complete mixing from theta-glass emitters likely occurs within a few microseconds. Thus, mixing from theta-glass emitters is competitive with the fastest mixers reported in the literature14 and 2 orders of magnitude faster than any mixer previously coupled to MS.3
The reduction of DCIP by L-AA performed using the theta-glass emitters was monitored with the mass spectrometer to obtain a lifetime of nano-ESI droplets. The resulting value of 274 ± 60 μs is an upper limit to the droplet lifetime because both the reagent concentrations and the surface area to volume ratio increase as the droplet evaporates and because some product formation likely occurs in the Taylor cone prior to droplet formation. On the basis of previously reported results that show that reaction rates in droplets can be 10–1000-fold higher than rates in bulk solution, we estimate that the true droplet lifetime is between 27 μs and 270 ns. The rapid mixing and short droplet lifetime achieved using these theta-glass emitters should make it possible to monitor fast reactions using MS. Because the initial droplet diameter, and therefore the droplet lifetime, depends on both the size of the tip of the electrospray capillary and the solution flow rate, the acquisition of reaction data at multiple time points should be possible by either using theta-glass emitters with variously sized tips or by changing solution flow rates.
Acknowledgments
The authors thank the National Institutes of Health (R01GM097357) for funding, Dr. Harry Sterling for helpful discussion, and the Robert D. Ogg Electron Microscope Lab at the University of California, Berkeley for use of the Hitachi TM-1000 scanning electron microscope.
Supporting Information Available
Relative ionization efficiency measurements of oxidized and reduced DCIP. This material is available free of charge via the Internet at http://pubs.acs.org.
The authors declare no competing financial interest.
Funding Statement
National Institutes of Health, United States
Supplementary Material
References
- Losey M.; Schmidt M.; Jensen K. Ind. Eng. Chem. Res. 2001, 40, 2555–2562. [Google Scholar]
- Miao Z.; Chen H.; Liu P.; Liu Y. Anal. Chem. 2011, 83, 3994–3997. [DOI] [PubMed] [Google Scholar]
- Vahidi S.; Stocks B. B.; Liaghati-Mobarhan Y.; Konermann L. Anal. Chem. 2013, 85, 8618–8625. [DOI] [PubMed] [Google Scholar]
- Gambin Y.; Simonnet C.; VanDelinder V.; Deniz A.; Groisman A. Lab Chip 2010, 10, 598–609. [DOI] [PubMed] [Google Scholar]
- Wang C.; Hu Y.; Hu T. Sensors 2009, 9, 5379–5389. [DOI] [PMC free article] [PubMed] [Google Scholar]
- Matsumoto S.; Yane A.; Nakashima S.; Hashida M.; Fujita M.; Goto Y.; Takahashi S. J. Am. Chem. Soc. 2007, 129, 3840–3841. [DOI] [PubMed] [Google Scholar]
- Majumdar Z. K.; Sutin J. D. B.; Clegg R. M. Rev. Sci. Instrum. 2005, 76, 125103. [Google Scholar]
- Bringer M.; Gerdts C.; Song H.; Tice J.; Ismagilov R. Philos. Trans. R. Soc., A 2004, 362, 1087–1104. [DOI] [PMC free article] [PubMed] [Google Scholar]
- Hassell D.; Zimmerman W. Chem. Eng. Sci. 2006, 61, 2977–2985. [Google Scholar]
- Li Y.; Zhang D.; Feng X.; Xu Y.; Liu B. Talanta 2012, 88, 175–180. [DOI] [PubMed] [Google Scholar]
- Park H.; Qiu X.; Rhoades E.; Korlach J.; Kwok L. W.; Zipfel W. R.; Webb W. W.; Pollack L. Anal. Chem. 2006, 78, 4465–4473. [DOI] [PubMed] [Google Scholar]
- Capretto L.; Cheng W.; Hill M.; Zhang X. Top. Curr. Chem. 2011, 304, 27–68. [DOI] [PubMed] [Google Scholar]
- Kathuria S. V.; Chan A.; Graceffa R.; Nobrega R. P.; Matthews C. R.; Irving T. C.; Perot B.; Bilsel O. Biopolymers 2013, 99, 888–896. [DOI] [PMC free article] [PubMed] [Google Scholar]
- Wu L.; Lapidus L. J. Anal. Chem. 2013, 85, 4920–4924. [DOI] [PubMed] [Google Scholar]
- Wilson D.; Konermann L. Anal. Chem. 2003, 75, 6408–6414. [DOI] [PubMed] [Google Scholar]
- Lee V.; Chen Y.; Konermann L. Anal. Chem. 1999, 71, 4154–4159. [DOI] [PubMed] [Google Scholar]
- Kolakowski B.; Konermann L. Anal. Biochem. 2001, 292, 107–114. [DOI] [PubMed] [Google Scholar]
- Orsnes H.; Graf T.; Degn H. Anal. Chem. 1998, 70, 4751–4754. [DOI] [PubMed] [Google Scholar]
- Chang D.; Lee C.; Shiea J. Anal. Chem. 2002, 74, 2465–2469. [DOI] [PubMed] [Google Scholar]
- Shieh I.; Lee C.; Shiea J. J. Proteome Res. 2005, 4, 606–612. [DOI] [PubMed] [Google Scholar]
- Hong C.; Tsai F.; Shiea J. Anal. Chem. 2000, 72, 1175–1178. [DOI] [PubMed] [Google Scholar]
- Shiea J.; Chang D.; Lin C.; Jiang S. Anal. Chem. 2001, 73, 4983–4987. [DOI] [PubMed] [Google Scholar]
- Chen H.; Venter A.; Cooks R. G. Chem. Commun. 2006, 2042–2044. [DOI] [PubMed] [Google Scholar]
- Law W. S.; Wang R.; Hu B.; Berchtold C.; Meier L.; Chen H.; Zenobi R. Anal. Chem. 2010, 82, 4494–4500. [DOI] [PubMed] [Google Scholar]
- Tian Y.; Chen J.; Ouyang Y.-z.; Qu G.-b.; Liu A.-f.; Wang X.-m.; Liu C.-x.; Shi J.-b.; Chen H.-w.; Jiang G.-b. Anal. Chim. Acta 2014, 814, 49–54. [DOI] [PubMed] [Google Scholar]
- Prudent M.; Rossier J. S.; Lion N.; Girault H. H. Anal. Chem. 2008, 80, 2531–2538. [DOI] [PubMed] [Google Scholar]
- Prudent M.; Mendez M. A.; Jana D. F.; Corminboeuf C.; Girault H. H. Metallomics 2010, 2, 400–406. [DOI] [PubMed] [Google Scholar]
- Miladinovic S. M.; Fornelli L.; Lu Y.; Piech K. M.; Girault H. H.; Tsybin Y. O. Anal. Chem. 2012, 84, 4647–4651. [DOI] [PubMed] [Google Scholar]
- Barbara J. E.; Eyler J. R.; Powell D. H. Rapid Commun. Mass Spectrom. 2008, 22, 4121–4128. [DOI] [PubMed] [Google Scholar]
- Miao Z.; Chen H. J. Am. Soc. Mass Spectrom. 2009, 20, 10–19. [DOI] [PubMed] [Google Scholar]
- Girod M.; Moyano E.; Campbella D. I.; Cooks R. G. Chem. Sci. 2011, 2, 501–510. [Google Scholar]
- Badu-Tawiah A. K.; Campbell D. I.; Cooks R. G. J. Am. Soc. Mass Spectrom. 2012, 23, 1077–1094. [DOI] [PubMed] [Google Scholar]
- Mark L. P.; Gill M. C.; Mahutc M.; Derrick P. J. Eur. J. Mass Spectrom. 2012, 18, 439–446. [DOI] [PubMed] [Google Scholar]
- Fisher C. M.; Kharlamova A.; McLuckey S. A. Anal. Chem. 2014, 86, 4581–4588. [DOI] [PubMed] [Google Scholar]
- Akiyama S.; Takahashi S.; Kimura T.; Ishimori K.; Morishima I.; Nishikawa Y.; Fujisawa T. Proc. Natl. Acad. Sci. U.S.A. 2002, 99, 1329–1334. [DOI] [PMC free article] [PubMed] [Google Scholar]
- Acevedo-Malavé A.; García-Sucre M. AIP Adv. 2011, 1, 032118. [Google Scholar]
- Song H.; Chen D. L.; Ismagilov R. F. Angew. Chem., Int. Ed. 2006, 45, 7336–7356. [DOI] [PMC free article] [PubMed] [Google Scholar]
- Graceffa R.; Burghammer M.; Davies R. J.; Riekel C. Appl. Phys. Lett. 2012, 101, 254101. [Google Scholar]
- Grimm R. L.; Beauchamp J. L. Anal. Chem. 2002, 74, 6291–6297. [DOI] [PubMed] [Google Scholar]
- Schmidt A.; Karas M.; Dülcks T. J. Am. Soc. Mass Spectrom. 2003, 14, 492–500. [DOI] [PubMed] [Google Scholar]
- Meesters G. M. H.; Vercoulen P. H. W.; Marijnissen J. C. M.; Scarlett B. J. Aerosol Sci. 1992, 23, 37–49. [Google Scholar]
- Wilm M. S.; Mann M. Int. J. Mass Spectrom. Ion Processes 1994, 136, 167–180. [Google Scholar]
- Chen X.; Jia L.; Yin X.; Cheng J.; Lu J. Phys. Fluids 2005, 17, 032101. [Google Scholar]
- Tang K.; Gomez A. J. Aerosol Sci. 1994, 25, 1237–1249. [Google Scholar]
- Rosell-Llompart J.; Fernandez De La Mora J. J. Aerosol Sci. 1994, 25, 1093–1119. [Google Scholar]
- Gomez A.; Tang K. Phys. Fluids 1994, 6, 404–414. [Google Scholar]
- Sankar S. V.; Weber B. J.; Kamemoto D. Y.; Bachalo W. D. Appl. Opt. 1991, 30, 4914–4920. [DOI] [PubMed] [Google Scholar]
- Olumee Z.; Callahan J. H.; Vertes A. J. Phys. Chem. A 1998, 102, 9154–9160. [Google Scholar]
- Gemci T.; Hitron R.; Chigier N. Proceedings of the 18th Annual Conference on Liquid Atomization & Spray Systems, Zaragoza, Spain, Sept 9–11, 2002; http://www.ilasseurope.org/ICLASS/ilass2002/papers/114.pdf.
- Nemes P.; Marginean I.; Vertes A. Anal. Chem. 2007, 79, 3105–3116. [DOI] [PubMed] [Google Scholar]
- Chen D.; Pui D. Y. H.; Kaufman S. L. J. Aerosol Sci. 1995, 26, 963–977. [Google Scholar]
- Chen D.; Pui D. Y. H. Aerosol Sci. Technol. 2009, 27, 367–380. [Google Scholar]
- Gañán-Calvo A. M.; Dávila J.; Barrero A. J. Aerosol Sci. 1997, 28, 249–275. [Google Scholar]
- Pfeifer R. J.; Hendricks C. D. AIAA J. 1968, 6, 496–502. [Google Scholar]
- Fernandez De La Mora J.; Loscertales I. G. J. Fluid Mech. 1994, 260, 155–184. [Google Scholar]
- Gatlin C.; Tureček F. Anal. Chem. 1994, 66, 712–718. [Google Scholar]
- Girod M.; Dagany X.; Antoine R.; Dugourd P. Int. J. Mass Spectrom. 2011, 308, 41–48. [Google Scholar]
- Badu-Tawiah A. K.; Campbell D. I.; Cooks R. G. J. Am. Soc. Mass Spectrom. 2012, 23, 1461–1468. [DOI] [PubMed] [Google Scholar]
- Badu-Tawiah A. K.; Campbell D. I.; Cooks R. G. J. Am. Soc. Mass Spectrom. 2012, 23, 1077–1084. [DOI] [PubMed] [Google Scholar]
- Badu-Tawiah A. K.; Li A.; Jjunju F. P. M.; Cooks R. G. Angew. Chem., Int. Ed. 2012, 51, 9417–9421. [DOI] [PubMed] [Google Scholar]
- Jurchen J. C.; Williams E. R. J. Am. Chem. Soc. 2002, 125, 2817–2826. [DOI] [PMC free article] [PubMed] [Google Scholar]
- Harned H.; Nuttall R. J. Am. Chem. Soc. 1947, 69, 736–740. [DOI] [PubMed] [Google Scholar]
- Fell C. J. D.; Hutchison H. P. J. Chem. Eng. Data 1971, 16, 427–429. [Google Scholar]
- Leaist D. G. J. Chem. Soc., Faraday Trans. 1991, 87, 597–601. [Google Scholar]
- CRC Handbook of Chemistry and Physics, 55th ed.; Weast R. C., Ed.; CRC Press: Boca Raton, FL, 1974. [Google Scholar]
- Oss M.; Kruve A.; Herodes K.; Leito I. Anal. Chem. 2010, 82, 2865–2872. [DOI] [PubMed] [Google Scholar]
- Izatt R. M.; Bradshaw J. S.; Nielsen S. A.; Lamb J. D.; Christensen J. J.; Sen D. Chem. Rev. 1985, 85, 271–339. [Google Scholar]
- Wang Y.; Tan M. K.; Go D. B.; Chang H. Europhys. Lett. 2012, 99, 64003. [Google Scholar]
- Karayannis M. I. Talanta 1976, 23, 27–30. [DOI] [PubMed] [Google Scholar]
Associated Data
This section collects any data citations, data availability statements, or supplementary materials included in this article.