Abstract
We recently discovered that the protein phosphatase 2A (PP2A) B55α subunit (PPP2R2A) is under-expressed in primary blast cells and is unfavorable for remission duration in AML patients. In this study, reverse phase protein analysis (RPPA) of 230 proteins in 511 AML patient samples revealed a strong correlation of B55α with a number of proteins including MYC, PKC α, and SRC. B55α suppression in OCI-AML3 cells by shRNA demonstrated that the B subunit is a PKCα phosphatase. B55α does not target SRC, but rather the kinase suppresses protein expression of the B subunit. Finally, the correlation between B55α and MYC levels reflected a complex stoichiometric competition between B subunits. Loss of B55α in OCI-AML3 cells did not change global PP2A activity and the only isoform that is induced is the one containing B56α. In cells containing B55α shRNA, MYC was suppressed with concomitant induction of the competing B subunit B56α (PPP2R5A). A recent study determined that FTY-720, a drug whose action involves the activation of PP2A, resulted in the induction of B55α In AML cells, and a reduction of the B subunit rendered these cells resistant to FTY-720. Finally, reduction of the B subunit resulted in an increase in the expression of miR-191-5p and a suppression of miR-142-3p. B55α regulation of these miRs was intriguing as high levels of miR-191 portend poor survival in AML, and miR-142-3p is mutated in 2% of AML patient samples. In summary, the suppression of B55α activates signaling pathways that could support leukemia cell survival.
Keywords: B55α, AML, Relapse, Cell signaling, miR-142, miR-191
1. Introduction
Acute myeloid leukemia (AML) is a cancer of the myeloid hematopoietic cells that accounts for ~80% of all adult acute leukemias. AML remains a highly fatal disease given that relapse is common following standard chemotherapy [4,6]. Hence, there is a great urgency to develop novel targeted therapies with enhanced efficacy. In this regard, strategies that target signal transduction pathways supporting tumor cell growth and survival are considered as one approach to optimize AML chemotherapy [1–4].
Using reverse phase protein array technology (RPPA), we have recently found that the expression of the protein phosphatase 2A (PP2A) regulatory B subunit B55α (gene symbol PPP2R2A) is reduced in acute myeloid leukemia cells compared to their normal hematopoietic cell counterparts [5]. While the expression of B55α did not correlate with overall survival, there was a positive correlation between its expression and remission duration (RD) in AML patients. There is growing evidence suggesting that PP2A isoforms can function as tumor suppressors [27, 28]. Such a role for B55α would be expected since it is a key regulator of cell growth and survival, and it is down regulated in many cancers including AML [5]. Furthermore, a number of reports have identified that the B55α gene (located at chromosome 8p in humans) is deleted in breast cancer [29], prostate cancer [30], primary plasma cell leukemia, and multiple myeloma [31]. B55α has been implicated in regulating the PP2A isoform that targets AKT [7]. In our dataset, the expression of B55α negatively correlated with AKT phosphorylation, which was consistent with a role for B55α as a negative regulator of AKT in AML cells [5]. B55α appears to also be important in mitosis/cell cycle progression with targets including CDK1 substrates [8] and FOXM1 [9].
The current study examined the potential mechanistic underpinning associated with the regulation of B55α expression and the possible role for the B subunit as a tumor suppressor in AML. The results presented here identify survival proteins and pathways that appear to be activated by the loss of B55α expression in malignant hematopoietic cells, and, for the first time, we implicate B55α in the regulation of miR expression. In doing so, we provide a clinically relevant model to explain why shorter RD is more likely in AML patients with diminished B55α expression.
2. Material and methods
2.1. Patient samples
Peripheral blood and bone marrow specimens were collected prior to therapy from 511 patients with newly diagnosed AML at the University of Texas MD Anderson Cancer Center between September of 1999 and March of 2007. The samples were acquired (lab protocol 01-473) during routine diagnostic assessments and analyzed (analysis protocol 05-0654) in accordance with the regulations approved by the Institution's Investigational Review Board. Informed consent was obtained in accordance with the Declaration of Helsinki. The patient characteristics and sample preparation have been described previously [14].
2.2. RPPA
Proteomic profiling of the AML patient samples was accomplished using RPPA. The method and validation of the technique has been described previously [5,14].
2.3. Cell treatment and cytotoxicity assessments
Cells were treated with the indicated doses of cytarabine (AraC), FTY-720, and dasatinib (all purchased from LC Laboratories, Woburn, MA, USA) or MK-2206 (Selleck Chemicals, Houston, TX) for various times. For cell viability and apoptosis, the cells were washed in PBS, resuspended in binding buffer containing annexin V (Roche Diagnostics, Indianapolis, IN, USA). The percentages of viable and dead cells (i.e., annexin V negative or positive, respectively) were assessed by analytical flow cytometry using a Becton Dickinson LSR II flow cytometer (Becton Dickinson, San Jose, CA, USA). Counting beads were used to determine total cell number.
2.4. B55α (PPP2R2A) knockdown cells
PPP2R2A was knocked down by lentiviral transduction using a gene-specific shRNAmir transfer vector (clone V3LHS_377709, targeting residues 1563–1581 on RefSeq NM_002717.3 and residues 1295–1313 on RefSeq NM_001177591.1) (Open Biosystems, Huntsville, AL, USA). The lentivirus was prepared by co-transfection of HEK293T cells (ATCC, Manassas, VA, USA) with an equal molar mix of transfer vector and packaging plasmids (psPAX2 and pMD2.G from Addgene, Cambridge, MA, USA) using a JetPrime transfection reagent as directed by the manufacturer (Polyplus, Illkirch, France). Fresh lentiviral supernatants were passed through 0.45 micron pore surfactant-free cellulose acetate membranes and then used at once to infect OCI-AML3 cells by incubation overnight at 37 °C under 5% CO2. OCI-AML3 cells were a kind gift from Mark Minden (Ontario Cancer Institute; Toronto, Canada). Infected cells were identified by fluorescence microscopy by green fluorescent protein (GFP) expression and then selected with puromycin (Life Technologies, Grand Island, NY) starting at 1 µg/ml. In parallel, all cells were transduced using lentivirus delivering a non-specific control (Open Biosystems). Knockdown was verified by Western blot analysis and real time PCR.
To suppress B55α in OCI-AML3 cells, control (ON-TARGET plus Non-targeting Pool; Dharmacon) or B55αsiRNA (Smartpool ON-TARGETplus PPP2R2A; Dharmacon) was introduced into the cells. For both siRNAs, 100 nM of the siRNA was introduced into cells by electroporation using an Amaxa device (Lonza). Lonza Reagent T was used for the OCI-AML3 cells for electroporation. Cells were collected at 48 h and knock down was verified by Western blot analysis.
2.5. Gene and miR expression analysis
Gene expression analysis using qRT-PCR was performed as previously described [5]. Real-time PCR was conducted using an ABI Prism 7700 Sequence Detection System (Life Technologies). We ran duplicate 25 µl reactions containing 0.5 µl cDNA, and the reactions were repeated if the Ct values were more than 0.25 cycles apart. As primers and probes we used TaqMan Gene Expression Assays (Life Technologies) specific for the genes of interest in this study (Supplementary Table 1) as directed by the manufacturer. We used ABL as a housekeeping gene to normalize gene expression. To calculate the relative abundance (RA) of each transcript of interest relative to that of ABL, the following formula was employed: RA = 100 × 2[−ΔCt], where ΔCt is the mean Ct of the transcript of interest minus the mean Ct of the transcript for ABL.
2.6. Confocal immunofluorescence microscopy
OCI-AML3 cells expressing non-specific control shRNA and cells expressing B55α shRNA were centrifuged onto slides using a Statspin Cytofuge 12 (Cytofuge, Westwood, MA, USA), fixed with 4% paraformaldehyde and permeabilized with 100% methanol. The cells were incubated in blocking solution (3% FBS/1% BSA/1 × PBS). B55α mouse monoclonal antibody (Santa Cruz Biotechnology) was added to cells at a 1:200 dilution in blocking solution. Cells were washed and secondary antibody (Alexa 594-tagged donkey anti-mouse, Life Technologies) was added in blocking solution. Cells were washed, stained with 4′,6-diamidino-2-phenylindole (DAPI, an nuclear stain, Life Technologies), washed again, and visualized using an Olympus FV1000 Laser Scanning Confocal microscope (Center Valley, PA, USA).
2.7. miR expression profiles
DNA microarray analysis was performed using the Human OneArray miRNA v2 (Phalanx Biotech, Belmont, CA, USA). RNA quality and integrity were determined utilizing an Agilent 2100 Bioanalyzer (Agilent Technologies, Palo Alto, CA, USA) and absorbance at A260, A280 and A230. The RNA was enriched using a 2-step process with Nanosep 100k (Pall, Port Washington, NY, USA) and Vivaspin 500 3k filters (Sartorius, Göttingen, Germany). Small RNA was labeled with Cy5-ULS (Kreatech Diagnostics, Amsterdam, Netherlands). Labeled RNA was hybridized at 37 °C overnight using miRNA OneArray Hybridization Chamber with 1 × OneArray Hybridization Buffers I and II (Phalanx Biotech). After hybridization, the arrays were washed according to the OneArray protocol. Raw intensity signals for each microarray were captured using a Molecular Dynamics Axon 4100A scanner and assessed using GenePixPro software. The data from all microarrays in each experimental set was then passed to RLimma, RColorBrewer, and Genefilter for combining technical replicates and performing statistical analyses.
2.8. Statistical analyses
For RPPA, super curve algorithms were used to generate a single value from the five serial dilutions [15]. Loading control and topographical normalization procedures accounted for protein concentration and background staining variations [16]. Analysis using unbiased clustering perturbation bootstrap clustering, and principle component analysis was then done as fully described in a previous publication [17]. Variables were divided into sixths based on the range of expression of all 511 samples. Comparison of the protein levels between paired samples was done by performing paired Student t-test. Association between protein expression levels and categorical clinical variables were assessed in R using standard Student t-tests, linear regression, or mixed effects linear models. Association between continuous variable and protein levels were assessed by using the Pearson and Spearman correlation and linear regression. Bonferroni corrections were done to account for multiple statistical parameters for calculating statistical significance (GraphPad Prism version 6.0 software, GraphPad Software, Inc., San Diego, CA, USA). Where indicated, the results are expressed as the mean value of triplicate samples ± SD (error bars). All means ± SD for triplicate samples were calculated with Microsoft Excel 2003 SP2 software (Microsoft Corporation, Seattle, WA). In all statistical analyses, the results were considered statistically significant when p < 0.05 using the Student t-test.
3. Results
3.1. B55α protein levels correlate strongly with a distinct set of signaling proteins in AML blast cells
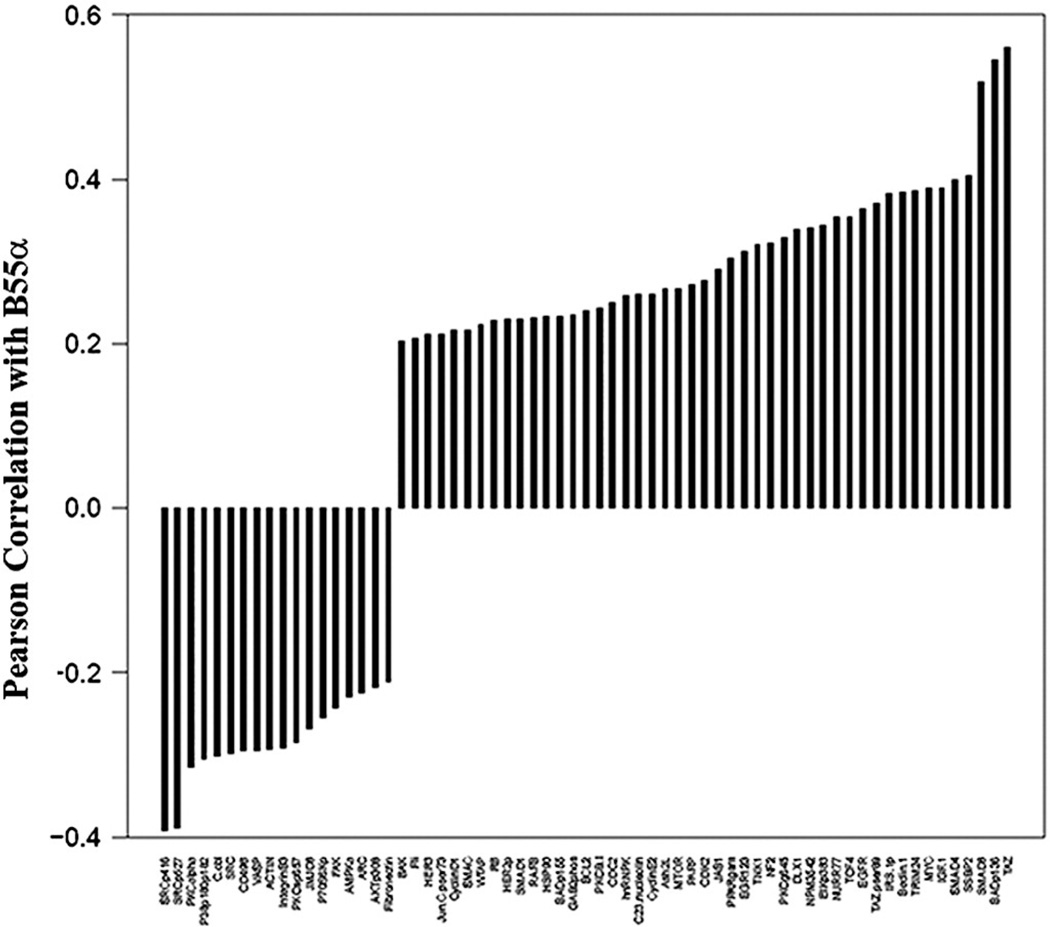
We have previously used RPPA to study the PP2A substrate specificity defining B55α protein in AML blast cells to examine the role of the PP2A subunit in regulating AKT signaling [5]. While B55α was shown to be an important regulator of AKT in AML, the role of the phosphatase in regulating other targets was not clear. RPPA was used to examine correlations of B55α with 230 proteins in the blast cells from 511 AML patients. As shown in Fig. 1, over 70 proteins showed a statistically significant (p < 0.0001) correlation with B55α, and it was positively correlated with myelocytomatosis viral oncogene homolog (MYC) expression. PP2A has been shown to regulate MYC expression [21]. In addition to our finding that B55α appears to be associated with MYC regulation, the B subunit family B56 has also been implicated in this process via its members B56α (gene symbol PPP2R5A) [21] and B56δ (gene symbol PPP2R5D) [22]. It is also interesting to note that MYC supports pro-death pathways when partnered with the early growth response family member 1 [20], which was also positively correlated with the expression of B55α in the AML patient samples (Fig. 1).
Fig. 1.
Proteins correlated with B55α PP2A expression. Negative and positive correlation from a list of 230 proteins also assayed using the same reverse phase proteomics analysis on the same samples; Pearson correlation coefficient R > 0.2, p < 0.001 or< 0.001.
3.2. Reduction of B55α in OCI-AML3 cells by shRNA reduces PKCα but not SRC phosphorylation
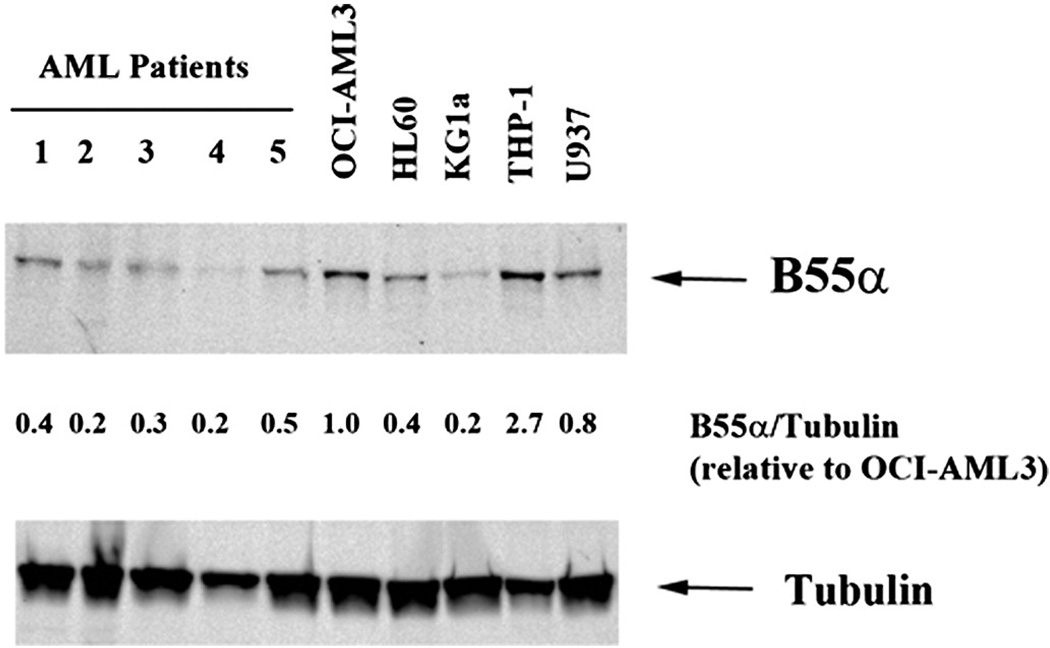
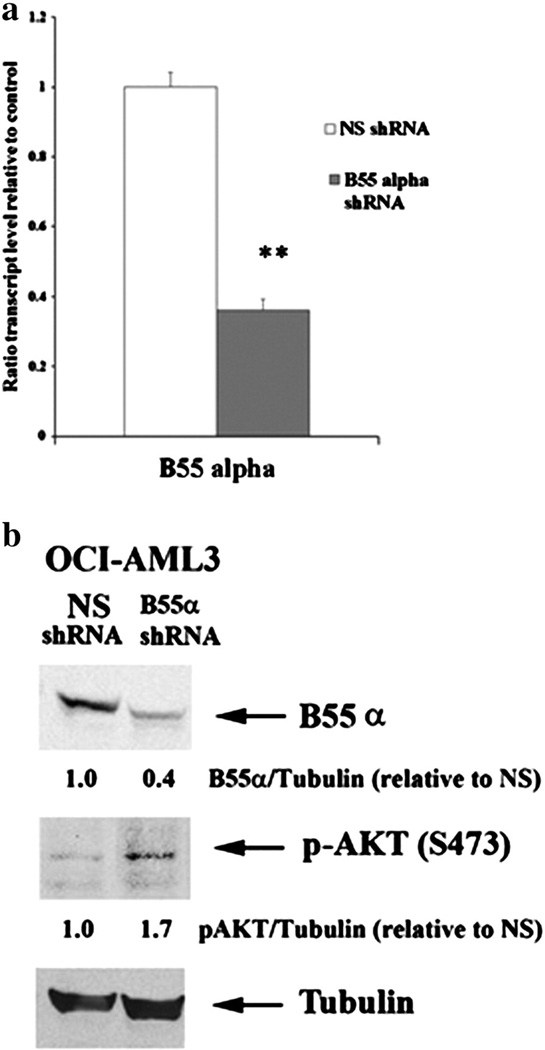
We previously have found by RPPA analysis that B55α expression is variable among AML patient samples [5]. To compare B55α expression levels in primary AML samples and AML cell lines, expression of B55αin five primary AML patient samples and five AML cell lines was measured by Western blot analysis (Fig. 2). AML cell lines included OCI-AML3, HL60, KG1a, THP-1, and U937. Consistent with our previous study, when normalized to Tubulin expression of the B subunit is variable among the patient samples. As shown in Fig. 2, this is also the case for the AML cell lines. The cell lines in general express more B55α compared to the primary samples. Expression of the B subunit in OCI-AML3 cells was two to five fold higher compared to the AML patient samples (Fig. 2). Lentivirus was used to deliver plasmid containing shRNA against B55α or a control shRNA into OCI-AML3 cells. The control shRNA targeted a non-human gene (i.e., GFP). The B55α shRNA cells had approximately 60% reduction in B55α gene transcript as demonstrated by qRT-PCR (Fig. 3a) and protein as determined by Western blot analysis (Fig. 3b). Consistent with the clinical correlations with AKT activation in the AML patient cohort previously published [5], reduction of B55α results in increased AKT phosphorylation (Fig. 3b).
Fig. 2.
Expression of B55α in AML primary cells and cell lines. Protein lysate (200,000 cell equivalents) from five primary AML patient blast cells and five AML cell lines including OCI-AML3, HL60, KG1a, THP-1, and U937 was subject to SDS/PAGE and Western blot analysis performed for B55α and Tubulin. Ratio of B55α to Tubulin was determined by densitometric analysis of the bands depicted in the figure.
Fig. 3.
Suppression of B55α in OCI-AML3 cells, (a) RNA was isolated from OCI-AML3 cells containing control (NS, non-specific) lentiviral plasmid or cells containing B55α shRNA lentiviral plasmid. Gene expression was determined by qRT-PCR using ABI assay primers for the B subunit and 18S RNA as described in the Materials and methods section. The t-test was performed to determine statistical significance (p < 0.0001). (b) Protein lysate (200,000 cell equivalents) from OCI-AML3 cells containing control (NS) lentiviral plasmid or cells containing B55α shRNA lentiviral plasmid was subject to SDS/PAGE and Western blot analysis performed for B55α, p-AKT (S473), and Tubulin. Ratio of B55α or p-AKT to Tubulin was determined by densitometric analysis of the bands depicted in the figure.
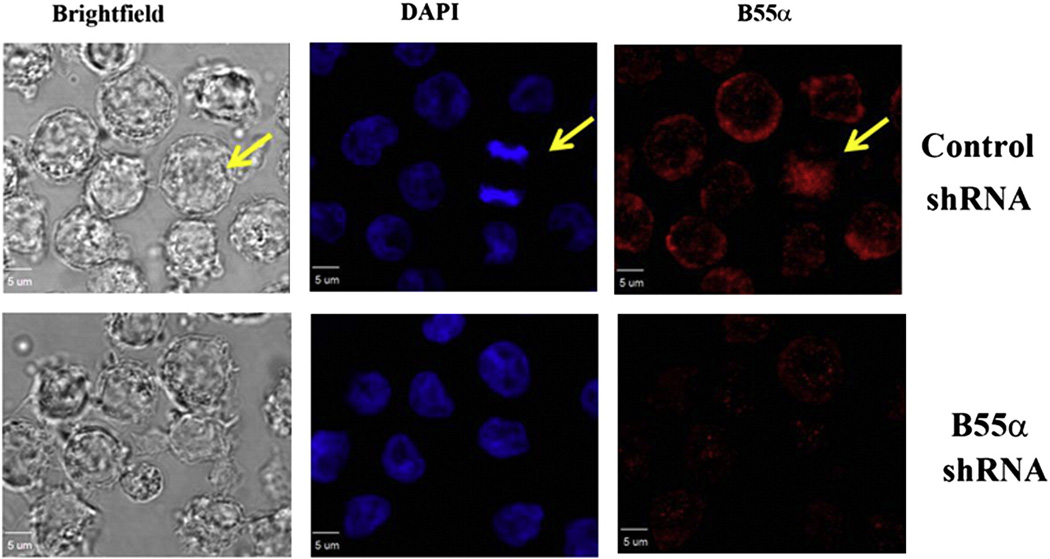
We examined the suppression of B55α in the OCI-AML3 shRNA transductants using confocal immunofluorescence microscopy. In the images in Fig. 4, the B55α is indicated by red fluorescence and nuclei are designated by blue fluorescence. In the cells expressing the control shRNA, B55α is abundant and it is primarily localized in the cytoplasm. Conversely, in the cells expressing B55α shRNA, the B55α appears to have very little fluorescence intensity.
Fig. 4.
Imaging of B55α in OCI-AML3 cells by confocal immunofluorescence microscopy. B55α was imaged in OCI-AML3 cells containing control (NS) lentiviral plasmid or cells containing B55α shRNA lentiviral plasmid by confocal IF microscopy as described in the “Materials and methods”. Images are Brightfield (gray), DAPI stained nuclei (blue), and B55α stained (red).
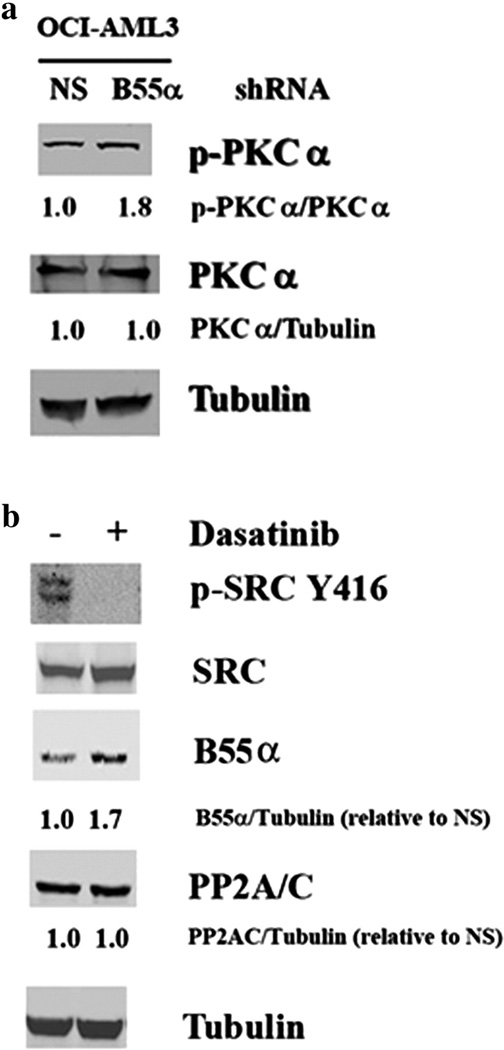
Our RPPA data showed a strong, negative correlation between B55α and PKCα serine 657 phosphorylation (Fig. 1). Serine 657 phosphorylation of protein kinase Cα (PKCα) was determined by Western blot analysis in OCI-AML3 cells expressing control shRNA or B55α shRNA. Consistent with having a role as a PKCα phosphatase, there is a nearly 2-fold increase in PKCα phosphorylation in the cells where B55α was suppressed (Fig. 5a).
Fig. 5.
Effect of B55α reduction on PKCα and SRC in OCI-AML3 cells. Protein lysate (200,000 cell equivalents) from OCI-AML3 cells containing control (NS) lentiviral plasmid or cells containing B55α shRNA lentiviral plasmid was subject to SDS/PAGE and Western blot analysis performed for p-PKCα (a), PKCα (a), p-SRC Y416 (b), SRC (b), B55α (b), PP2A/C (b), and Tubulin (a and b). Ratios were determined by densitometric analysis of the bands depicted in the figure.
Of the proteins examined by RPPA, B55α displayed the strongest negative correlation with SRC phosphorylated at tyrosine 527 or tyrosine 416 (Fig. 1). Therefore, it is possible that B55α either induces a tyrosine phosphatase or suppresses the tyrosine kinase that phosphorylates SRC. To test this hypothesis, the OCI-AML3 cells were treated with 100 nM dasatinib (a tyrosine kinase inhibitor that has been shown to inhibit SRC) [32] for 24 h. As shown in Fig. 5b, this drug markedly inhibited the phosphorylation of SRC at tyrosine 416. The dasatinib-treated cells also showed a 1.7-fold increase in the expression of B55α, which suggested a potential role for SRC as a regulator of B55α (Fig. 5b).
3.3. Loss of B55α induces competing B subunit B56α with concomitant suppression of MYC expression
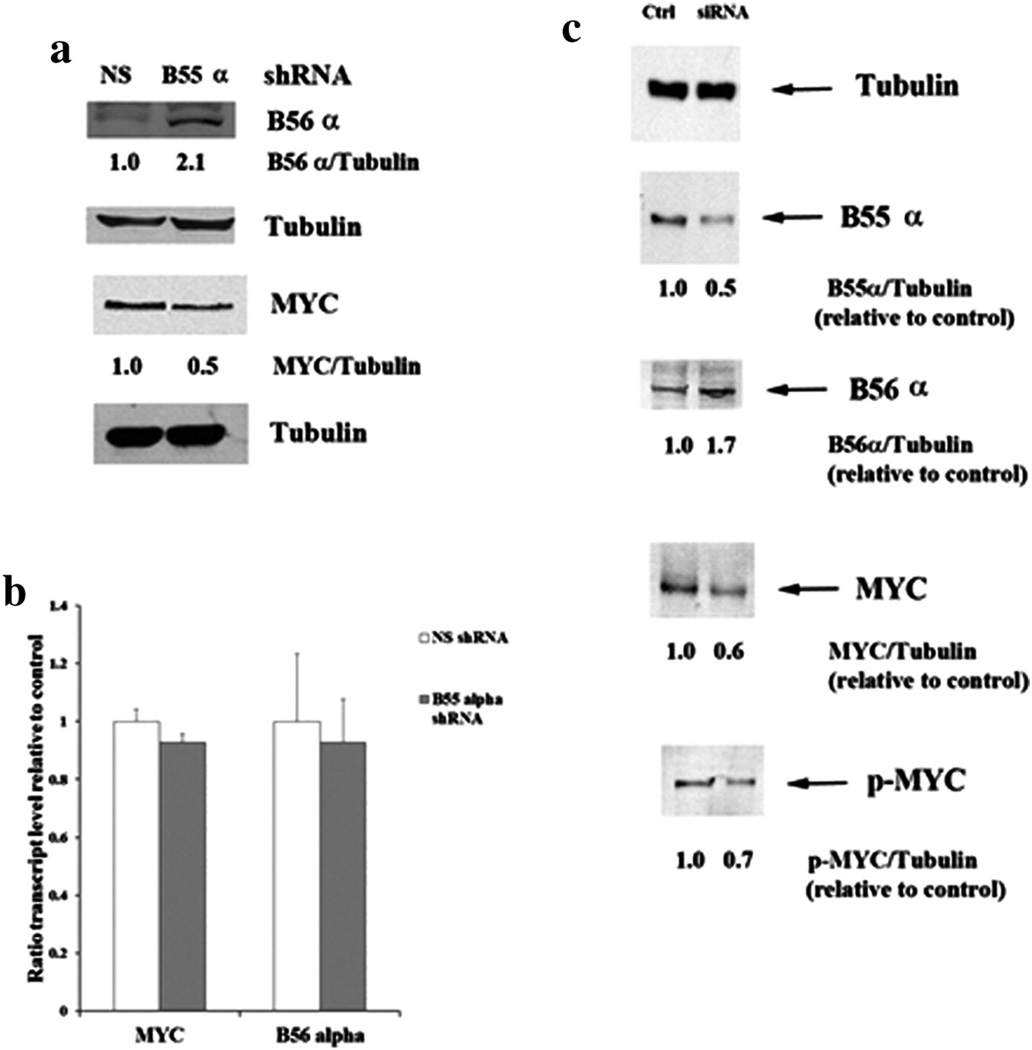
We have observed in acute lymphoblastic leukemia cells that B55α levels were increased in cells where expression of B56α was suppressed [24]. B56α expression was compared in OCI-AML3 cells with control shRNA plasmid and OCI-AML3 cells with B55α shRNA plasmid. As shown in Fig. 6a, the cells with suppressed B55α displayed an almost 2-fold increase in B56α.
Fig. 6.
Effect of B55α suppression on MYC and B56 α in OCI-AML3 cells. (a) Protein lysate (200,000 cell equivalents) from OCI-AML3 cells containing control (NS) lentiviral plasmid or cells containing B55α shRNA lentiviral plasmid was subject to SDS/PAGE and Western blot analysis performed for B56α, MYC, and Tubulin. Ratios were determined by densitometric analysis of the bands depicted in the figure. (b) RNA was isolated from OCI-AML3 cells containing control (NS) lentiviral plasmid or cells containing B55α shRNA lentiviral plasmid. Gene expression was determined by qRT-PCR using ABI assay primers for MYC, B56α, and 18S RNA as described in the “Materials and methods”. The Student t-test was performed to determine statistical significance (p > 0.05 in all cases). (c) Protein lysate (200,000 cell equivalents) from OCI-AML3 cells treated with control siRNA or B55α siRNA was subject to SDS/PAGE and Western blot analysis performed for B55α, B56α, MYC, p-MYC, and Tubulin. Ratios were determined by densitometric analysis of the bands depicted in the figure.
The protein stability of MYC has been shown to be regulated by B56α [21]. B56α de-phosphorylation of the PEST sequence in MYC protein results in ubiquitination and proteasomal degradation of the transcription factor. A Western blot analysis revealed that the OCI-AML3 cells with the control shRNA expressed nearly 2-fold more MYC compared to the cells with the B55α shRNA (Fig. 6a). The reduction of MYC expression by the suppression of B55α was not due to transcriptional mechanisms since the qRT-PCR results of gene expression levels in the control and B55α shRNA cells were similar (Fig. 6b).
To test for effects of lentivirus on B55α suppression, siRNA was used to suppress the B subunit in the OCI-AML3 cells. Control siRNA with minimal homology to human gene sequences (Dharmacon Non-targeting SMARTPool; 100 nM) or B55α siRNA (Dharmacon PPP2R2A SMARTPool; 100 nM) was introduced into cells by electroporation and cells were collected at 48 h. B55α siRNA was able to reduce levels of the B subunit by 60% compared to cells treated with control siRNA (Fig. 6c). Consistent with results observed with the lentiviral shRNA (Fig. 4), reduction of the B subunit by siRNA resulted in reduced expression of MYC and increased expression of B56α (Fig. 6c). Consistent with a model where MYC protein is degraded in response to dephosphorylation, serine 58/62 phosphorylation of MYC was reduced in the OCI-AML3 cells treated with B55α siRNA (Fig. 6c). In addition, phosphorylation of PKCα was increased by 50% in cells treated with B55α siRNA compared to control siRNA (data not shown).
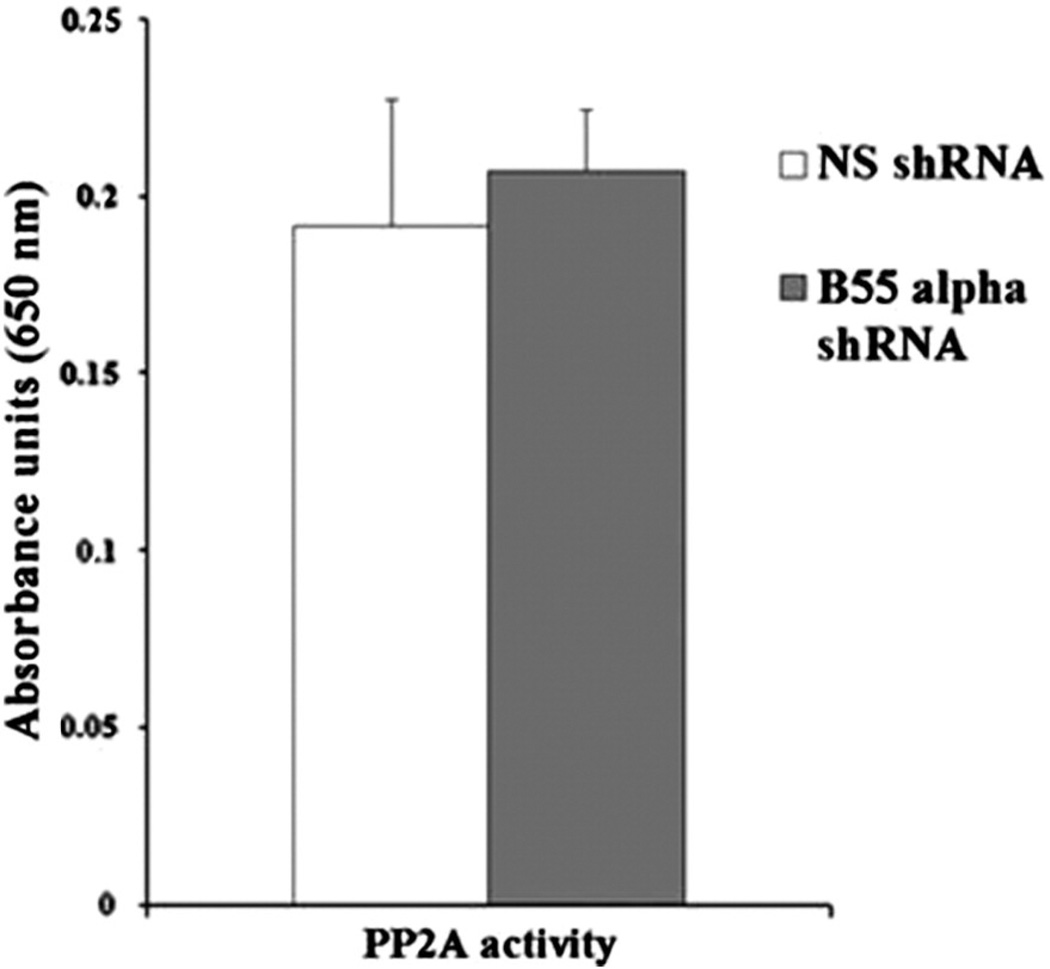
A molybdate dye assay measuring the dephosphorylation of phosphopeptides by immunoprecipitated PP2A was used to determine the effect of B55α expression on cellular PP2A activity. Using this assay, we observed that the PP2A activity was similar in cells despite the reduction of B55α expression (Fig. 7). Considering that PP2A phosphatase is an obligate hetero-trimer [18,19], it is likely that expression of B56α and other PP2A B subunits that would be induced with B55α loss would sustain PP2A activity in the B55α shRNA cells.
Fig. 7.
Effect of B55α suppression on PP2A activity in OCI-AML3 cells. PP2A activity was determined in OCI-AML3 cells containing control (NS) lentiviral plasmid or cells containing B55α shRNA lentiviral plasmid by spectrophotometric analysis of molybdate dye assay using phospopeptide substrate as described in the “Materials and methods”. Activity is presented as absorbance units.
3.4. OCI-AML3 cells with B55α shRNA exhibit reduced the sensitivity to FTY-720
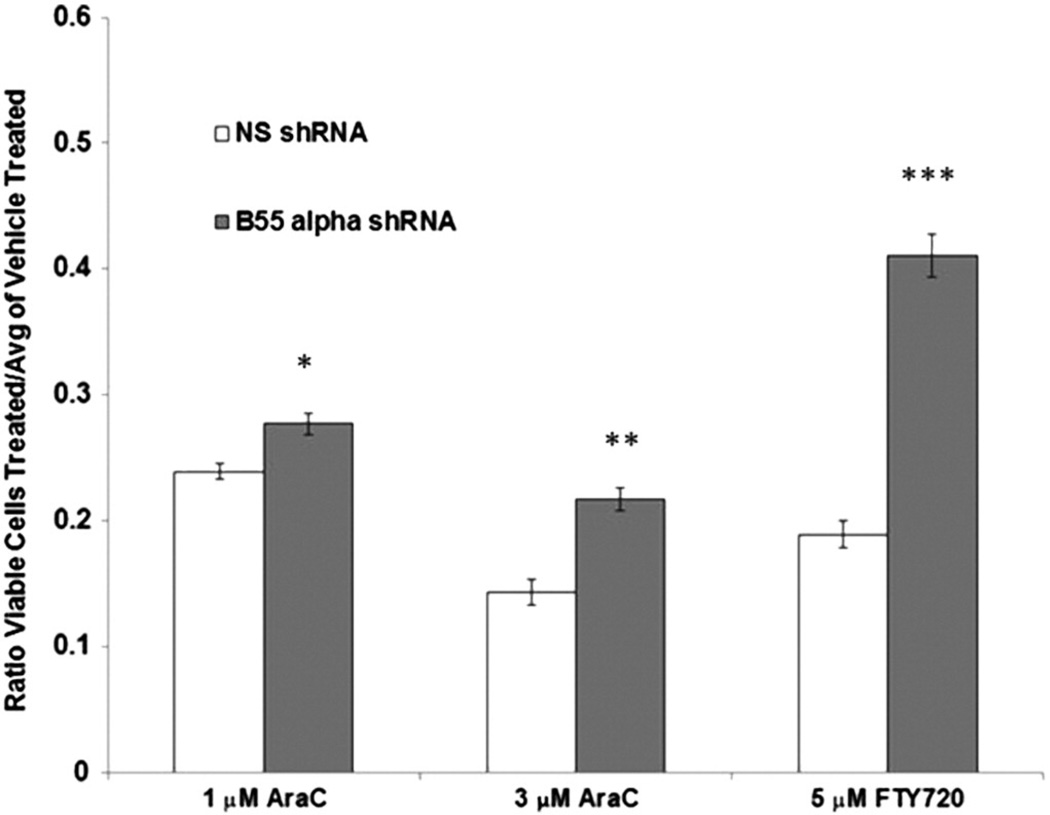
Yang and colleagues recently demonstrated that the PP2A activating drug FTY-720 could induce B55α and apoptosis in Kasumi-1 and HL60 AML cells, as well as primary c-KIT-mutant AML cells [23]. However, it is not known if the FTY-720-induced apoptosis required the induction of B55α. OCI-AML3 cells were treated with 5 µM FTY-720 for 48 h. The suppression of B55α in the B55α shRNA cells resulted in a marked, statistically significant protection against FTY-720-induced apoptosis (Fig. 8). These results suggested that B55α expression was necessary, but not sufficient for FTY-720-induced apoptosis. Considering the effect of B55α as a negative regulator of AKT and PKC survival pathways, it could be expected that the inhibition of B55α in B55α shRNA cells would render them more resistant to certain drugs. OCI-AML3 cells with B55α shRNA or control shRNA were treated with the chemotherapeutic agent AraC for 48 h. The suppression of B55α resulted in a statistically significant protection of B55α cells from 1 and 3 µM doses of AraC (Fig. 8).
Fig. 8.
Effect of B55α suppression on drug resistance in OCI-AML3 cells. OCI-AML3 cells containing control (NS) lentiviral plasmid or cells containing B55α shRNA lentiviral plasmid were treated with vehicle (0.1% DMSO), 1 µM AraC, 3 µM AraC, or 5 µM FTY-720 for 48 h. Total viable cells were determined by analytical flow cytometry as described in the “Materials and methods”. The Student t-test was performed to determine statistical significance (*, p = 0.014; **, p = 0.006, ***, p b 0.001).
3.5. Suppression of B55α affects the expression of miRs in OCI-AML3 cells
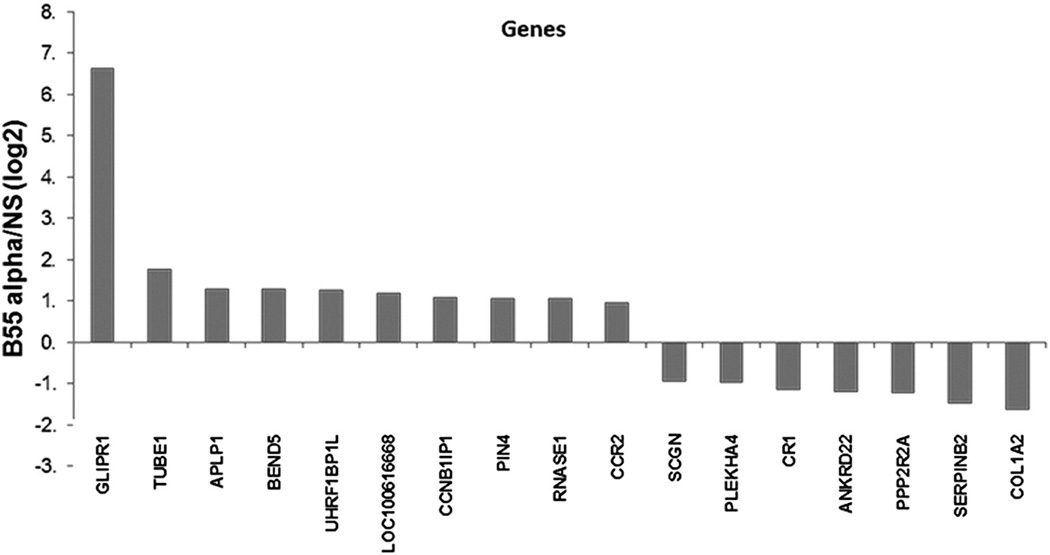
It would be reasonable to expect that B55α could influence gene expression considering that it has been shown to regulate transcription factors such as FOXM1 [9]. Since B55α levels appear to influence the expression of MYC (Fig. 9a), we would also suggest the possible control of miR expression by this protein given that MYC has been shown to regulate a number of miRs including those in the miR 17–92 [33]. RNA was isolated from OCI-AML3 cells expressing control NS shRNA and OCI-AML3 cells expressing B55α shRNA. Gene expression profiling revealed few major changes in mRNA expression in the cells when B55α was suppressed. The reduction of B55α in OCI-AML3 cells leads to a statistically significant increase of >2-fold (i.e., log2 difference of 1 or greater) expression in only 10 genes (Fig. 9). There was also a statistically significant decrease of >2-fold in only seven genes including the B55α (PPP2R2A) gene. The gene most affected by the reduction of B55α was GLIPR1 (whose expression was increased by >100-fold; Fig. 9). GLIPR1 has been shown to be a tumor suppressor in solid tumors [26], so this observed effect would suggest that the loss of B55α might have some protective effects. However, despite the increased transcription of the GLIPR1 gene, there was no difference in protein expression in the OCI-AML3 cells with B55α shRNA (data not shown).
Fig. 9.
Effect of B55α suppression on gene expression in OCI-AML3 cells. RNA was isolated from OCI-AML3 cells containing control (NS) lentiviral plasmid or cells containing B55α shRNA lentiviral plasmid. DNA microarray analysis was performed using the Human Whole Genome OneArray v5 (Phalanx Biotech, Belmont, CA, USA) as described in the “Materials and methods”.
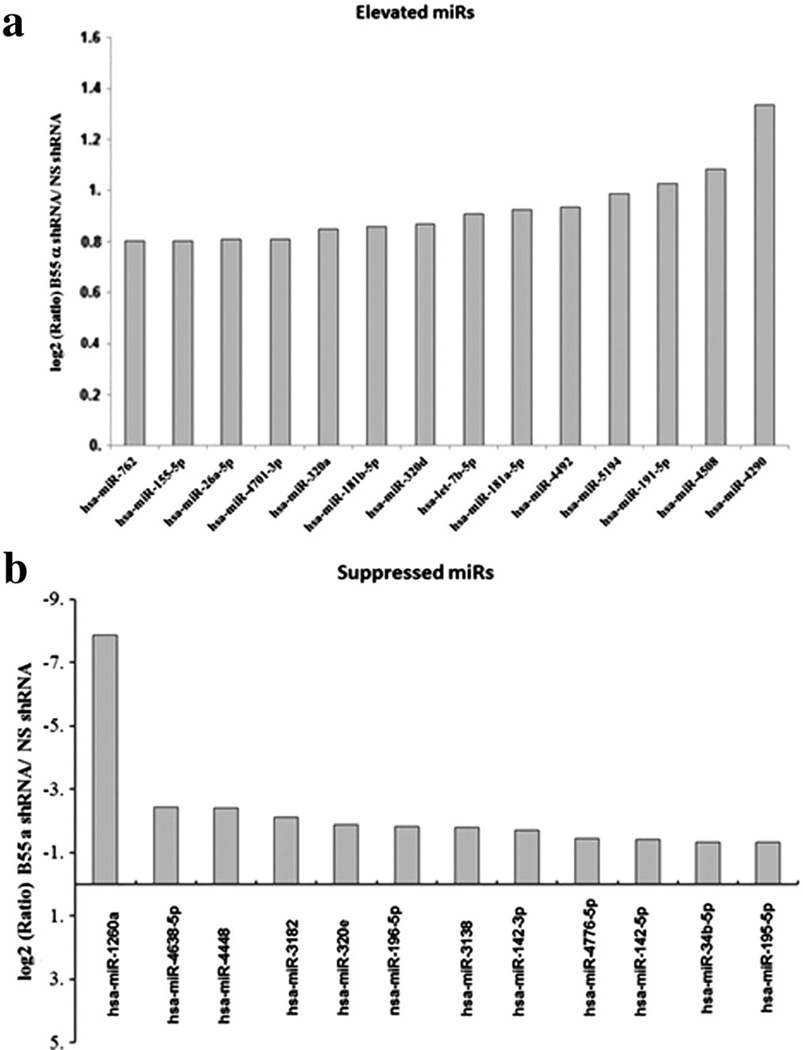
While effects on gene transcription were minimal in response to suppression of B55α, reduction of B55α affected expression of a number of miRs (Fig. 10 a and b). Only three miRs were significantly elevated by at least 2-fold in response to suppression of the B55α. These were miR-4290, miR-4508, and miR-191-5p (Fig. 10a). Not much has been reported about miR-4290 and miR-4508, but miR-191-5p has been implicated as being detrimental for patient survival in AML [10]. Reduction of B55α in the OCI-AML3 cells had a greater effect in the suppression of a number of miRs. At least 32 miRs were significantly reduced by at least 2-fold in the B55α shRNA cells (Fig. 10b). A reduction of >200-fold was observed for miR-1260a. Unfortunately, not much has been reported about this miR so the significance of its reduction in the cells is not clear. Among the other miRs that were suppressed are miR-142-3p and miR-142-5p (Fig. 10b). These miRs have been shown to be mutated in lymphoma and AML [12,13]. MiR-142-3p has been implicated in control of myeloid differentiation by amechanism involving TGF-beta activated kinase 1/MAP3K7 binding protein 2 (AB2) and Cyclin T2 (CCNT2) [11]. While there was not a significant increase in TAB2 in the OCI-AML3 cells with B55α shRNA, there was an increase in CCNT2 gene expression (log2 increase of 0.4; p = 0.004).
Fig. 10.
Effect of B55α suppression on miR expression in OCI-AML3 cells. RNA was isolated from OCI-AML3 cells containing control (NS) lentiviral plasmid or cells containing B55α shRNA lentiviral plasmid. DNA microarray analysis was performed using the Human OneArray miRNA v2 (Phalanx Biotech, Belmont, CA, USA) as described in the “Materials and methods”. A list of elevated miRs is presented in (a) and the suppressed miRs are listed in (b).
4. Discussion
We have previously determined that B55α expression is positively correlated with RD [5]. Consistent with a role for the B subunit as a positive regulator of stress signaling in leukemia cells, the suppression of B55α in OCI-AML3 cells renders these cells resistant to the conventional chemotherapeutic drug AraC and the PP2A activating drug FTY-720 (Fig. 8). The suppression of B55α in the leukemia cells also induced the phosphorylation of AKT (Fig. 3b). Thus, B55α may have tumor suppressor functions in AML, and strategies to activate this PP2A isoform could be a novel target for AML chemotherapy.
Cells that are deficient in B55α activity could be prone to becoming malignant by a number of diverse mechanisms including the inability to activate p53, aberrant activation of survival signaling, and the deregulation of the cell cycle and mitosis [8,9,33–35]. For example, B55α is a critical regulator of CDC25 and WEE1 which controls how cells progress through the cell cycle [34]. Schmitz and colleagues have demonstrated that B55α regulates cellular reassembly mechanisms during mitotic exit in cooperation with importin-β1 [8]. In addition, B55α regulates temporal function of FOXM1 during the cell cycle. FOXM1 is normally only active during G2 but depletion of B55α results in premature activation of the transcription factor in G1/S [9]. A recent report has indicated that B55α is central to activation of p53 via a reactive oxygen species-dependent mechanism in response to glutamine deprivation. Furthermore, Reid et al. found that B55α can regulate cell metabolism, since it can modulate a p53-dependent metabolic adaptation to glutamine deprivation [33].
Our RPPA data revealed that the expression of B55α was negatively correlated with the phosphorylation of the cell survival kinases SRC and PKCα (Fig. 1). We speculate that B55α likely acts to dephosphorylate PKCα, since cells with B55α shRNA exhibited an almost 2-fold increase in phosphorylation of the kinase (Fig. 5a). There was no difference in phosphorylation of SRC in OCI-AML3 cells with B55α shRNA (data not shown). However, if SRC was inhibited in these cells using dasatinib, then the expression of B55α was increased by almost 2-fold (Fig. 5b). Inhibition of SRC did not affect expression of catalytic PP2A C subunit (Fig. 5b), so the induction was not due to increased PP2A catalytic core. The mechanism of how SRC negatively regulates B55α certainly merits further characterization.
The regulation of MYC by PP2A has been well studied but it is a B55α of another family (i.e. B56α) that has been shown to regulate MYC degradation [21]. OCI-AML3 cells with B55α shRNA displayed a >2fold increase in B56α suggesting that MYC induction in the cells was due to stoichiometric effects that result from competition between the B subunits (Fig. 6a and c). Consistent with degradation of MYC in response to B56α mediated dephosphorylation, suppression of B55α also resulted in decreased phosphorylation of MYC at serines involved in proteolytic control (i.e. serine 58/62; Fig. 6c).
Though the various PP2A family members regulate diverse cellular functions, very little is known how PP2A might regulate microRNA expression [36]. We find that the suppression of B55α in OCI-AML3 cells had little effect on gene expression (Fig. 9), but the reduction of B55α expression resulted in the altered expression of a number of miRs (Fig. 10a and b). The miR most affected was miR-1260a. OCI-AML3 cells with the B55α shRNA had N200-fold less miR-1260a compared to control cells (Fig. 10b). Unfortunately, at present the role of this miR in leukemia is unknown.
Two other miRs that were inhibited when B55α was reduced were miR-142-3p and miR-142-5p (Fig. 10b). These miRs are of particular interest as recent genome sequencing analysis of AML patients indicates that these miRs are mutated in 2% of the patients [13]. The importance of miR-142-3p in myeloid cell biology is emerging, since this miR appears to be a regulator of myeloid differentiation [11]. Furthermore, Dahlhaus and colleagues found that high expression of miR-142-3p was associated with a good prognosis for AML patients with intermediate cytogenetics [37]. The induction of miR-191 in response to B55α suppression in the OCI-AML3 cells was interesting, since elevated levels of miR-191 suggested a poor prognosis for AML patients [10]. In summary, B55α appears to be involved in preventing AML disease relapse by modulating cell survival signaling intermediates (e.g., AKT, PKCα, MYC, and SRC). Our results also indicate that B55α plays a role in the regulation of miR expression, although the mechanism involved is not clear. A model is presented in Fig. 11 depicting the diverse roles of B55α in regulation of these various processes. Given our data, we have proposed several novel functions for B55α in the regulation of signal transduction and gene expression. These cellular effects, as well as their possible feedback mechanisms, warrant further investigation.
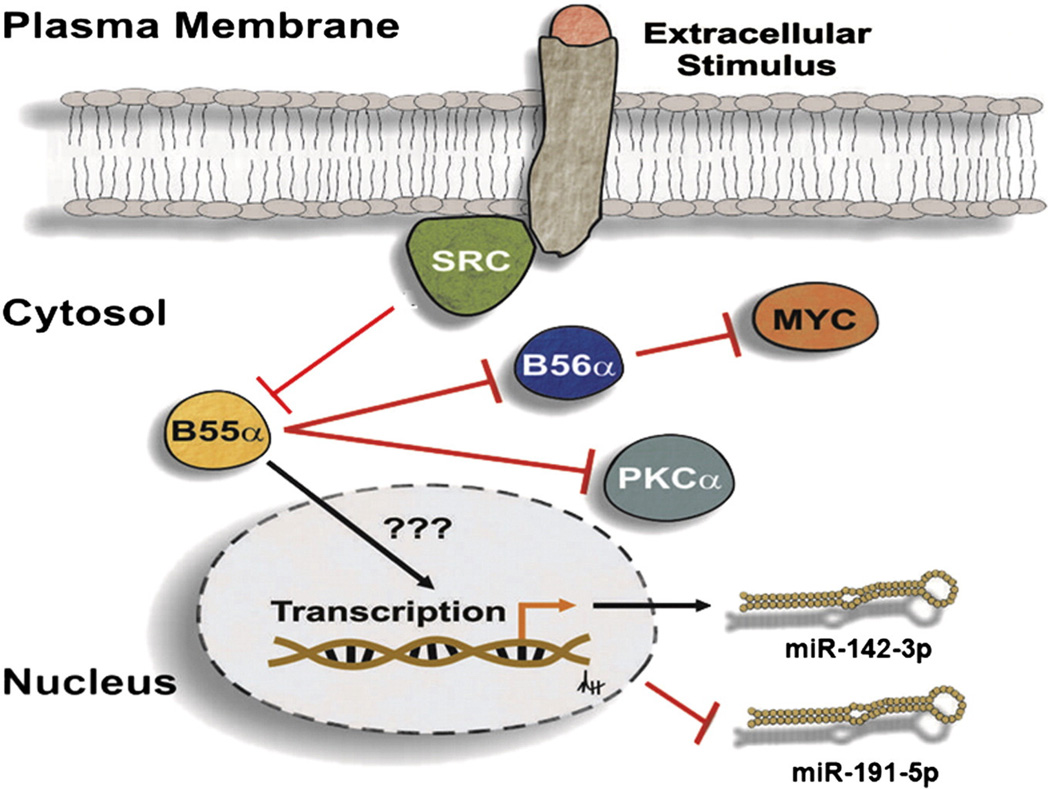
Fig. 11.
Model of B55α-mediated pathways in AML cells. Extracellular survival signals activate SRC which suppresses the B subunit. When SRC is suppressed, B55α is expressed resulting in dephosphorylation of PKCα and suppression of B56α protein expression with concomitant induction of MYC. Bymechanisms that are not clear, B55α supports expression ofmiR-142-3p and suppresses expression of miR-191-5p.
Supplementary data to this article can be found online at http://dx.doi.org/10.1016/j.bbamcr.2014.05.006.
Supplementary Material
Acknowledgements
This work was supported by awards from the John and Laura Arnold Foundation and The Center for Stem Cell and Developmental Biology at the University of Texas MD Anderson Cancer Center (PPR), the National Institutes of Health/National Cancer Institute grants CA55164-19 and CA100632-09 (both to MA) and CA016672-36 (MA, JKB), and by the Paul and Mary Haas Chair in Genetics (MA).
Abbreviations
- PP2A
protein phosphatase 2A
- AML
acute myeloid leukemia
- PKC
protein kinase C
- AKT
protein kinase B
- RPPA
reverse phase protein array
References
- 1.Andreeff M, Milella M, Carter BZ, Tabe Y, Ricciardi MR, Sneed T, et al. Targeted therapy of AML new concepts. Ann. Hematol. 2004;83(Suppl. 1):S51–S53. doi: 10.1007/s00277-004-0849-8. [DOI] [PubMed] [Google Scholar]
- 2.Kantarjian H, O'Brien S, Cortes J, Wierda W, Faderl S, Garcia-Manero G, et al. Therapeutic advances in leukemia and myelodysplastic syndrome over the past 40 years. Cancer. 2008;113:1933–1952. doi: 10.1002/cncr.23655. [DOI] [PMC free article] [PubMed] [Google Scholar]
- 3.Scott E, Hexner E, Perl A, Carroll M. Targeted signal transduction therapies in myeloid malignancies. Curr. Oncol. Rep. 2010;12:358–365. doi: 10.1007/s11912-010-0126-z. [DOI] [PubMed] [Google Scholar]
- 4.Estey EH. Acute myeloid leukemia: 2013 update on risk-stratification and management. Am. J. Hematol. 2013;88:318–327. doi: 10.1002/ajh.23404. [DOI] [PubMed] [Google Scholar]
- 5.Ruvolo PP, Qui YH, Coombes KR, Zhang N, Ruvolo VR, Borthakur G, et al. Low expression of PP2A regulatory subunit B55alpha is associated with T308 phosphorylation of AKT and shorter complete RD in acute myeloid leukemia patients. Leukemia. 2011;25:1711–1717. doi: 10.1038/leu.2011.146. [DOI] [PMC free article] [PubMed] [Google Scholar]
- 6.Walter RB, Kantarjian HM, Huang X, Pierce SA, Sun Z, Gundacker HM, et al. Effect of complete remission and responses less than complete remission on survival in acute myeloid leukemia: a combined Eastern Cooperative Oncology Group, Southwest Oncology Group, and M. D. Anderson Cancer Center Study. J. Clin. Oncol. 2010;28:1766–1771. doi: 10.1200/JCO.2009.25.1066. [DOI] [PMC free article] [PubMed] [Google Scholar]
- 7.Kuo YC, Huang KY, Yang CH, Yang YS, Lee WY, Chiang CW. Regulation of phosphorylation of Thr-308 of Akt, cell proliferation, and survival by the B55alpha regulatory subunit targeting of the protein phosphatase 2A holoenzyme to Akt. J. Biol. Chem. 2008;283:1882–1892. doi: 10.1074/jbc.M709585200. [DOI] [PubMed] [Google Scholar]
- 8.Schmitz MH, Held M, Janssens V, Hutchins JR, Hudecz O, Ivanova E, et al. Live-cell imaging RNAi screen identifies PP2A–B55alpha and importin-beta1 as key mitotic exit regulators in human cells. Nat. Cell Biol. 2010;12:886–893. doi: 10.1038/ncb2092. [DOI] [PMC free article] [PubMed] [Google Scholar]
- 9.Alvarez-Fernández M, Halim VA, Aprelia M, Laoukili J, Mohammed S, Medema RH. Protein phosphatase 2A (B55α) prevents premature activation of forkhead transcription factor FoxM1 by antagonizing cyclin A/cyclin-dependent kinase-mediated phosphorylation. J. Biol. Chem. 2011;286:33029–33036. doi: 10.1074/jbc.M111.253724. [DOI] [PMC free article] [PubMed] [Google Scholar]
- 10.Garzon R, Volinia S, Liu CG, Fernandez-Cymering C, Palumbo T, Pichiorri F, et al. MicroRNA signatures associated with cytogenetics and prognosis in acute myeloid leukemia. Blood. 2008;111:3183–3189. doi: 10.1182/blood-2007-07-098749. [DOI] [PMC free article] [PubMed] [Google Scholar]
- 11.Wang XS, Gong JN, Yu J, Wang F, Zhang XH, Tan ZQ, et al. MicroRNA-29a and microRNA-142-3p are regulators of myeloid differentiation and acute myeloid leukemia. Blood. 2012;119:4992–5004. doi: 10.1182/blood-2011-10-385716. [DOI] [PubMed] [Google Scholar]
- 12.Kwanhian W, Lenze D, Alles J, Motsch N, Barth S, Döll C, et al. MicroRNA-142 is mutated in about 20% of diffuse large B-cell lymphoma. Cancer Med. 2012;1:141–155. doi: 10.1002/cam4.29. [DOI] [PMC free article] [PubMed] [Google Scholar]
- 13.Cancer Genome Atlas Research Network. Genomic and epigenomic landscapes of adult de novo acute myeloid leukemia. N. Engl. J. Med. 2013;368:2059–2074. doi: 10.1056/NEJMoa1301689. [DOI] [PMC free article] [PubMed] [Google Scholar]
- 14.Kornblau SM, Singh N, Qiu Y, Chen W, Zhang N, Coombes KR. Highly phosphorylat-ed FOXO3A is an adverse prognostic factor in acute myeloid leukemia. Clin. Cancer Res. 2010;16:1865–1874. doi: 10.1158/1078-0432.CCR-09-2551. [DOI] [PMC free article] [PubMed] [Google Scholar]
- 15.Hu J, He X, Baggerly KA, Coombes KR, Hennessy BT, Mills GB. Non-parametric quantification of protein lysate arrays. Bioinformatics. 2007;23:1986–1994. doi: 10.1093/bioinformatics/btm283. [DOI] [PubMed] [Google Scholar]
- 16.Neeley ES, Kornblau SM, Coombes KR, Baggerly KA. Variable slope normalization of reverse phase protein arrays. Bioinformatics. 2009;25:1384–1389. doi: 10.1093/bioinformatics/btp174. [DOI] [PMC free article] [PubMed] [Google Scholar]
- 17.Kornblau SM, Tibes R, Qiu YH, Chen W, Kantarjian HM, Andreeff M, et al. Functional proteomic profiling of AML predicts response and survival. Blood. 2009;113:154–164. doi: 10.1182/blood-2007-10-119438. [DOI] [PMC free article] [PubMed] [Google Scholar]
- 18.Janssens V, Longin S, Goris J. PP2A holoenzyme assembly: in cauda venenum (the sting is in the tail) Trends Biochem. Sci. 2008;33:113–121. doi: 10.1016/j.tibs.2007.12.004. [DOI] [PubMed] [Google Scholar]
- 19.Strack S, Cribbs JT, Gomez L. Critical role for protein phosphatase 2A heterotrimers in mammalian cell survival. J. Biol. Chem. 2004;279:47732–47739. doi: 10.1074/jbc.M408015200. [DOI] [PubMed] [Google Scholar]
- 20.Boone DN, Hann SR. The Myc-ARF-Egr1 pathway: unleashing the apoptotic power of c-Myc. Cell Cycle. 2011;10:2043–2044. doi: 10.4161/cc.10.13.15711. [DOI] [PMC free article] [PubMed] [Google Scholar]
- 21.Arnold HK, Sears RC. Protein phosphatase 2A regulatory subunit B56alpha associates with c-myc and negatively regulates c-myc accumulation. Mol. Cell. Biol. 2006;26:2832–2844. doi: 10.1128/MCB.26.7.2832-2844.2006. [DOI] [PMC free article] [PubMed] [Google Scholar]
- 22.Liu L, Eisenman RN. Regulation of c-Myc protein abundance by a protein phosphatase 2A–glycogen synthase kinase 3β-negative feedback pathway. Genes Cancer. 2012;3:23–36. doi: 10.1177/1947601912448067. [DOI] [PMC free article] [PubMed] [Google Scholar]
- 23.Yang Y, Huang Q, Lu Y, Li X, Huang S. Reactivating PP2A by FTY720 as a novel therapy for AML with C-KIT tyrosine kinase domain mutation. J. Cell. Biochem. 2012;113:1314–1322. doi: 10.1002/jcb.24003. [DOI] [PubMed] [Google Scholar]
- 24.Ruvolo VR, Kurinna SM, Karanjeet KB, Schuster TF, Martelli AM, McCubrey JA, et al. PKR regulates B56(alpha)-mediated BCL2 phosphatase activity in acute lymphoblastic leukemia-derived REH cells. J. Biol. Chem. 2008;283:35474–35485. doi: 10.1074/jbc.M800951200. [DOI] [PMC free article] [PubMed] [Google Scholar]
- 25.Aguda BD, Kim Y, Piper-Hunter MG, Friedman A, Marsh CB. MicroRNA regulation of a cancer network: consequences of the feedback loops involving miR-17-92, E2F, and Myc. Proc. Natl. Acad. Sci. U. S. A. 2008;105:19678–19683. doi: 10.1073/pnas.0811166106. [DOI] [PMC free article] [PubMed] [Google Scholar]
- 26.Li L, Abdel Fattah E, Cao G, Ren C, Yang G, Goltsov AA, et al. Glioma pathogenesis-related protein 1 exerts tumor suppressor activities through proapoptotic reactive oxygen species-c-Jun-NH2 kinase signaling. Cancer Res. 2008;68:434–443. doi: 10.1158/0008-5472.CAN-07-2931. [DOI] [PubMed] [Google Scholar]
- 27.Perrotti D, Neviani P. Protein phosphatase 2A: a target for anticancer therapy. Lancet Oncol. 2013;14:e229–e238. doi: 10.1016/S1470-2045(12)70558-2. [DOI] [PMC free article] [PubMed] [Google Scholar]
- 28.Janssens V, Rebollo A. The role and therapeutic potential of Ser/Thr phosphatase PP2A in apoptotic signalling networks in human cancer cells. Curr. Mol. Med. 2012;12:268–287. doi: 10.2174/156652412799218930. [DOI] [PubMed] [Google Scholar]
- 29.Curtis C, Shah SP, Chin SF, Turashvili G, Rueda OM, Dunning MJ, et al. The genomic and transcriptomic architecture of 2,000 breast tumours reveals novel subgroups. Nature. 2012;486:346–352. doi: 10.1038/nature10983. [DOI] [PMC free article] [PubMed] [Google Scholar]
- 30.Liu W, Xie CC, Zhu Y, Li T, Sun J, Cheng Y, et al. Homozygous deletions and recurrent amplifications implicate new genes involved in prostate cancer. Neoplasia. 2008;10:897–907. doi: 10.1593/neo.08428. [DOI] [PMC free article] [PubMed] [Google Scholar]
- 31.Mosca L, Musto P, Todoerti K, Barbieri M, Agnelli L, Fabris S, et al. Genome-wide analysis of primary plasma cell leukemia identifies recurrent imbalances associated with changes in transcriptional profiles. Am. J. Hematol. 2013;88:16–23. doi: 10.1002/ajh.23339. [DOI] [PubMed] [Google Scholar]
- 32.Montero JC, Seoane S, Ocaña A, Pandiella A. Inhibition of SRC family kinases and receptor tyrosine kinases by dasatinib: possible combinations in solid tumors. Clin. Cancer Res. 2011;17:5546–5552. doi: 10.1158/1078-0432.CCR-10-2616. [DOI] [PubMed] [Google Scholar]
- 33.Kalev P, Simicek M, Vazquez I, Munck S, Chen L, Soin T, et al. Loss of PPP2R2A inhibits homologous recombination DNA repair and predicts tumor sensitivity to PARP inhibition. Cancer Res. 2012;72:6414–6424. doi: 10.1158/0008-5472.CAN-12-1667. [DOI] [PubMed] [Google Scholar]
- 34.Reid MA, Wang WI, Rosales KR, Welliver MX, Pan M, Kong M. The B55α subunit of PP2A drives a p53-dependent metabolic adaptation to glutamine deprivation. Mol. Cell. 2013;50:200–211. doi: 10.1016/j.molcel.2013.02.008. [DOI] [PubMed] [Google Scholar]
- 35.Lorca T, Castro A. The Greatwall kinase: a new pathway in the control of the cell cycle. Oncogene. 2013;32:537–543. doi: 10.1038/onc.2012.79. [DOI] [PubMed] [Google Scholar]
- 36.Liu X, Sempere LF, Ouyang H, Memoli VA, Andrew AS, Luo Y, et al. MicroRNA-31 functions as an oncogenic microRNA in mouse and human lung cancer cells by repressing specific tumor suppressors. J. Clin. Invest. 2010;120:1298–1309. doi: 10.1172/JCI39566. [DOI] [PMC free article] [PubMed] [Google Scholar]
- 37.Dahlhaus M, Roolf C, Ruck S, Lange S, Freund M, Junghanss C. Expression and prognostic significance of hsa-miR-142-3p in acute leukemias. Neoplasma. 2013;60:432–438. doi: 10.4149/neo_2013_056. [DOI] [PubMed] [Google Scholar]
Associated Data
This section collects any data citations, data availability statements, or supplementary materials included in this article.


