Abstract
A fast, easy, and scalable method to assess the properties of site-specific nucleases is crucial to understanding their in cellulo behavior in genome engineering or population-level gene drive applications. Here we describe an analytical platform that enables high-throughput, semiquantitative interrogation of the DNA-binding and catalytic properties of LAGLIDADG homing endonucleases (LHEs). Using this platform, natural or engineered LHEs are expressed on the surface of Saccharomyces cerevisiae yeast where they can be rapidly evaluated against synthetic DNA target sequences using flow cytometry.
Keywords: Homing endonuclease, Meganuclease, Yeast surface display, Yeast transformation, Flow cytometry, Binding affinity, Protein–DNA interaction
1. Introduction
LAGLIDADG homing endonucleases (LHEs) are a family of highly specific DNA-cleaving enzymes that have been discovered in diverse unicellular eukaryotes, bacteria, and viruses (1). LHE genes are able to surpass vertical patterns of inheritance by engaging in a horizontal transposition process called “homing.” There are two prerequisites for horizontal propagation: (1) recipient genomic locations which can accept the insertion of an autonomous genetic element without incurring a prohibitive fitness cost and (2) biochemical machinery that enables the transfer of genetic information into such a locus. LHE genes are embedded in and transpose to phenotypically neutral genomic locations, such as within self-splicing group I introns or as N- or C-terminal fusions with permissive recipient proteins (2, 3). Furthermore, LHE genes have devised a mechanism of transposition that relies on the nearly universal process of DNA repair by homologous recombination (4). LHE genes encode for DNA endonucleases and embed themselves within a cleaved target site; they become self-propagating by creating DNA breaks and using their own coding sequences as repair templates for homology-driven DNA break resolution (5).
The DNA target sequences bound and cleaved by LHEs are approximately 22 base pairs in length. Similar to microRNAs or commonplace PCR primers, this length of DNA surpasses a hypothetical threshold of uniqueness within a genome, thereby enabling genome-specific operations. LHEs are one of two (the other being the recently discovered TAL effector proteins) natural protein scaffolds currently known which are able to recognize DNA with specificity properties at or above this “genomic threshold.” Two decades of experimentation with natural LHEs has demonstrated that they can be expressed at high levels in orthogonal cell types, altering genomic loci without causing any overt toxicity, thereby confirming genomic-level DNA cleavage specificity (6–11). Two important overarching questions still dominate the LHE field: (a) what are the more in-depth patterns of their DNA recognition specificity, and (b) can their high level of specificity be redirected to target a broad range of nonnative sequences relevant to the research and/or therapeutic communities.
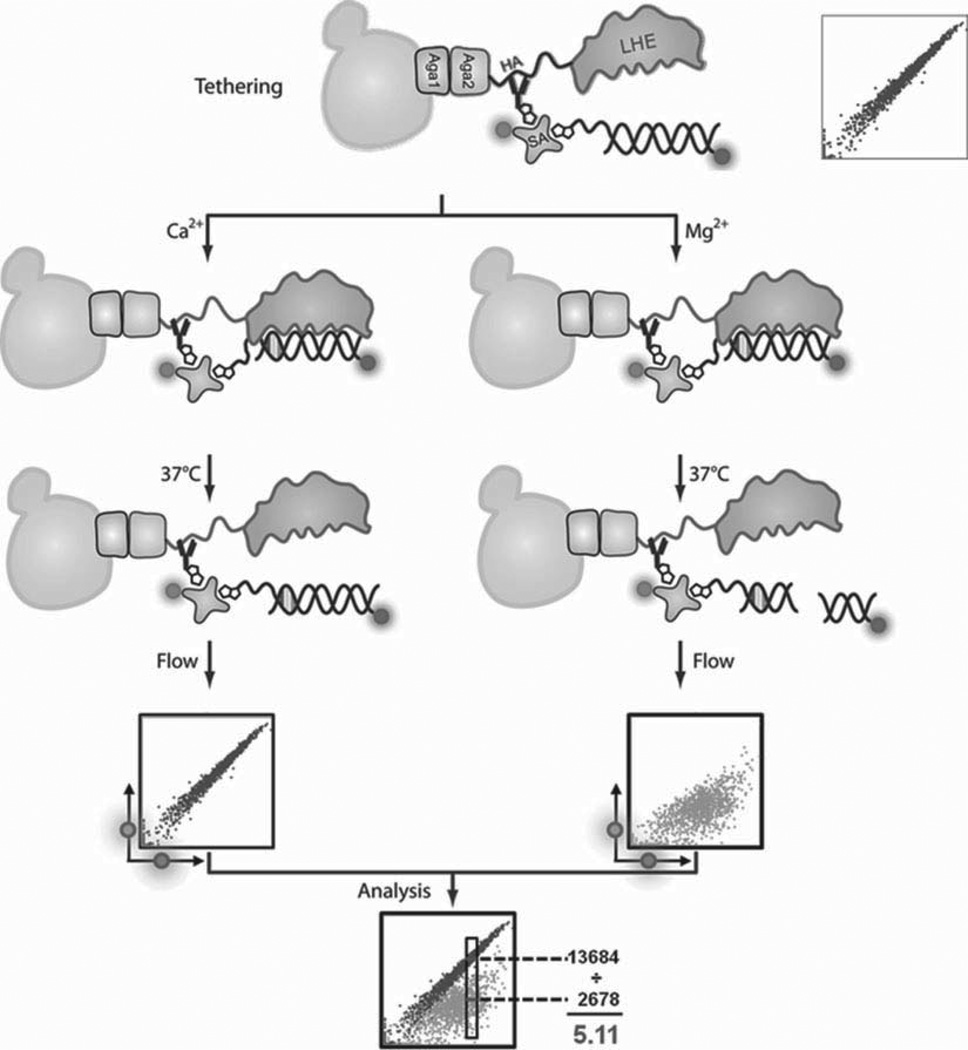
Here, we present flow cytometric methods that allow for efficient, semiquantitative analysis of homing endonuclease binding and cleavage activities (12,13). These assays can be performed to develop in-depth characterizations of LHE-DNA recognition properties. If carried out using a wide array of DNA substrate sequences, they can lead to a better understanding of correlations (or lack thereof) between DNA binding and cleavage and also how multiple simultaneous base pair substitutions influence the interaction. The system is fast to set up: following transformation with an episomal plasmid, yeast display on their cell surface a homing endonuclease of interest, and can be rapidly validated by antibody staining of a C-terminal Myc epitope to detect the presence of stable, full-length enzyme. Synthetically generated, fluorescently labeled DNA substrates are then used to perform fast, multi-well-scalable assays to uncover DNA-binding and cleavage properties of interest to the investigator (Fig. 1).
Fig. 1.
Schematic representation of a flow cytometric DNA cleavage assay. The homing endonuclease of interest is expressed on the surface of yeast through fusion with the yeast Aga2P protein. Aga2P forms a disulfide linkage with Aga1 P, which is co-induced in the EBY100 strain upon galactose induction. An N-terminal hemagglutinin (HA) tag enables cis-tethering of the double-stranded DNA substrate to the enzyme: a streptavidin-PE “bridge” connects the bound anti-HA-biotin with biotinylated and A647-labeled DNA substrate. This tethered target substrate results in the characteristic colinear PE and A647 fluorescence profile observed on the flow cytometer. With the addition of calcium, the enzyme may bind the DNA substrate, but it cannot cleave it; with the addition of magnesium, the enzyme is able to bind and cleave the substrate provided a productive interaction is formed. Cleavage of the tethered substrate leads to a loss of fluorescence in the A647 channel. This loss in A647 fluorescence can be used to quantify cleavage by gating on a population of yeast normalized for their PE signal and comparing the median A647 fluorescence intensities of the corresponding Ca2+ and Mg2+ samples.
2. Materials
Prepare all solutions using ultrapure RNAse- and DNAse-free water (0.22 µm filtered, deionized water) and analytical grade reagents. Cultures and reagents may be prepared at the bench, but care should be taken to use sterile components and aseptic technique.
2.1. Dual-Labeled Double-Stranded DNA Substrate
Platinum® Taq DNA Polymerase High Fidelity, with buffer and 50 mM MgSO4 (Invitrogen).
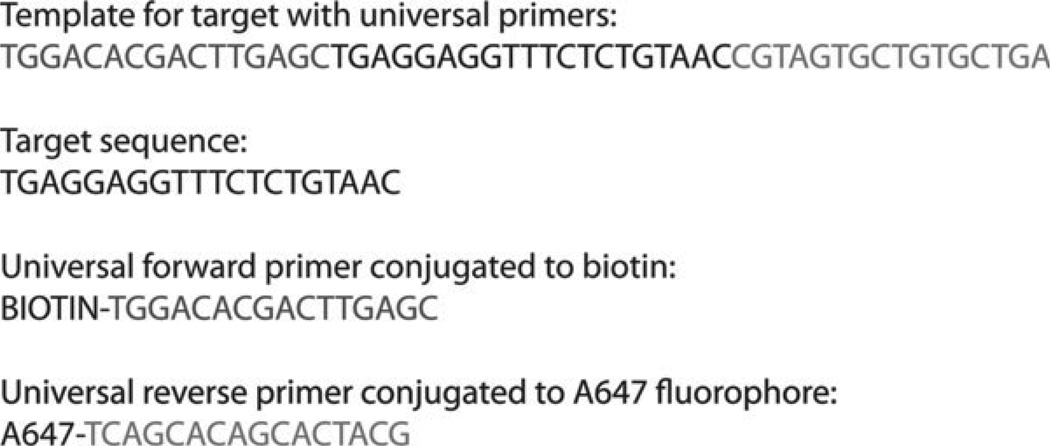
Target site oligo template, with flanking universal primer sites, standard desalting purification (Integrated DNA Technologies (IDT)) (Fig. 2).
Biotin-labeled universal forward primer (IDT) (Fig. 2) (see Note 1).
A647-labeled universal reverse primer (IDT) (Fig. 2).
10 mM dNTPs.
0.2 mL PCR strip tubes and 96-well PCR plates (Bio-Rad).
Thermal cycler.
Exonuclease I (New England Biolabs).
MultiScreen HTS-HV filter plate (Fisher Scientific).
Illustra sephadex G-100 (GE Healthcare): Make sephadex solution at 1 g/20 mL in water; allow at least 24 h for bead hydration; store at room temperature for a maximum of 4 months.
Odyssey infrared imaging system (LI-COR Biosciences) or UV transilluminator.
Nanodrop or similar microvolume spectrophotometer (Thermo Scientific).
Fig. 2.
Reagents for PCR production of DNA target oligo substrate. The desired target sequence should be flanked by forward and reverse “universal primer” sequences. The primers currently in use in our laboratories are listed; alternative universal primer schemes may be substituted. A647 and biotin moieties included on the primers result in the production of dual-labeled double-stranded DNA substrates for use in both the flow cytometric DNA cleavage and DNA-binding (where the biotin is obsolete) assays.
2.2. Polyacrylamide Gel
30% Acrylamide/bis (19:1) solution.
10× Tris/borate/EDTA (TBE) buffer (see Note 2).
N,N,N′,N′-tetramethylethylenediamine (TEMED).
Ammonium persulfate (Fisher Scientific): 10% w/v solution in water.
Plastic gel cassette, 1.0 mm.
Vertical gel electrophoresis apparatus.
6× Ficoll loading buffer: 18% (w/v) Ficoll-400 (Sigma-Aldrich) in 6× TBE, with NO added dyes.
2.3. Yeast Transformation
EBY100 yeast (Invitrogen).
2×YPAD nonselective yeast media: 20 g Bacto yeast extract, 40 g Bacto peptone, 100 mg adenine hemisulfate (Sigma-Aldrich), 50 g glucose, water to 1 L, pH to 6.0. Filter sterilize or autoclave and store at 4°C (see Note 3).
Salmon sperm DNA (Sigma-Aldrich), 2 mg/mL solution in 1× TE.
1 M Lithium acetate solution in water.
50% w/v Polyethylene glycol in water, MW 3350 (PEG 3350).
Plasmid DNA-encoding endonuclease in pCTCON2 yeast surface display vector (Fig. 3).
42°C water bath.
Yeast-selective growth media “SC-Ura-Trp”: 6.7 g yeast nitrogen base without amino acids (Sigma-Aldrich), 1.4 g yeast synthetic dropout media supplement without Trp, Ura, His, Leu (Sigma-Aldrich), 76 mg histidine, 380 mg leucine, 4.34 g MES, and water to 900 mL. Adjust pH to 5.25 with HCl. Sterilize by autoclaving 20 min. Prior to use, add penicillin (100 i.u./mL), streptomycin (100 µg/mL), and kanamycin (25 µg/mL). Store at 4°C.
20% w/v glucose solution, filter sterilized. Store at 4°C.
Selective growth media agar plates: Add 20 g of bacteriological agar to 900 mL of SC-Ura-Trp-selective growth media and autoclave for 20 min. Add 100 mL prewarmed (55°C) 20% w/v glucose and penicillin (100 i.u./mL), streptomycin (100 µg/mL), and kanamycin (25 µg/mL). Pour into Petri dishes and let it solidify at room temperature. Store plates at 4°C.
Water-jacketed incubator.
Fig. 3.
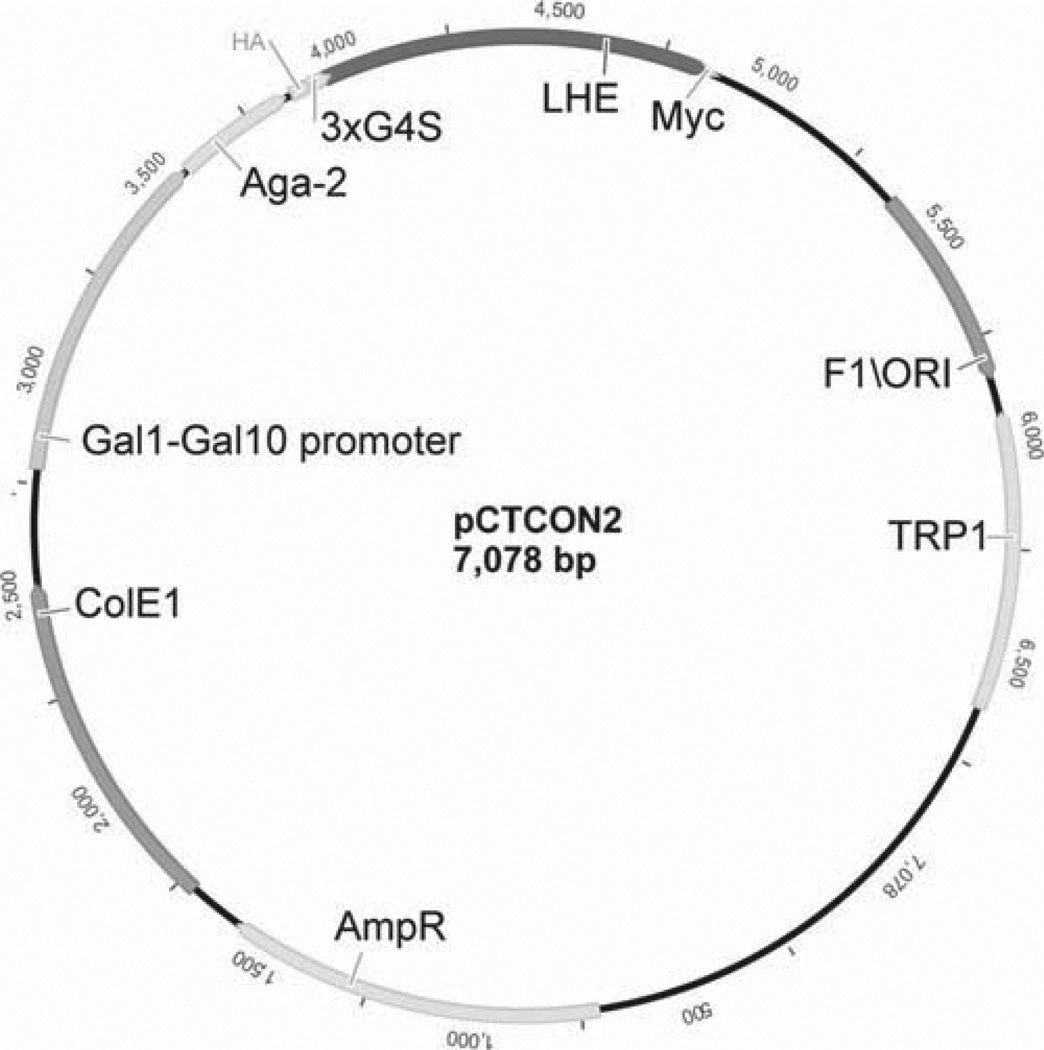
Schematic representation of pCTCON2 vector for LHE surface display. Gal1-10, galactose inducible promoter; HA, hemagglutinin epitope; 3×G4S, thrice repeated gly–gly–gly–gly–ser linker sequence; LHE, LAGLIDADG homing endonuclease coding sequence; Myc, cMyc epitope. Ampicillin resistance (AmpR) is included for selection in Escherichia coli, TRP1 marker used for auxotrophic selection in Saccharomyces cerevisiae.
2.4. Yeast Growth and Induction
EBY100 yeast transformed with surface-expression vector containing homing endonuclease of interest.
SC–Ura–Trp-selective growth media (for recipe, see Subheading 2.3).
20% w/v glucose solution, filter sterilized, store at 4°C.
20% w/v d-(+)-raffinose pentahydrate (Sigma-Aldrich) + 0.1% w/v glucose solution, filter sterilized, store at room temperature.
20% w/v d-(+)-galactose solution, filter sterilized, store at 4°C.
Baffled Erlenmeyer flask(s).
Disposable 15 mL culture tubes.
Deep-well 96-well plate (flat bottom).
Shaking incubator.
Spectrophotometer.
2.5. Yeast Surface Display Flow Cytometric DNA-Binding and Cleavage Assay
Induced EBY100 yeast with surface-expressed homing endonuclease.
10× Yeast staining buffer (YSB): 1.8 M KCl, 0.1 M NaCl, 0.1 M HEPES, 2% BSA, 1% w/v d-(+)-galactose, adjust pH to 7.5 with KOH (see Note 4). Filter sterilize and store at 4°C in a light-protected or foil-wrapped container.
1× High-salt yeast staining buffer (YSB + KCl): Dilute 10× YSB to 1× with 466 mM KCl for a final KCl concentration of 600 mM. Store at 4°C in light-protected or foil-wrapped container.
10× In vitro oligo cleavage buffer (IOCB): 1.5 M KCl, 0.1 M NaCl, 0.1 M HEPES, 0.05 M K-Glu (l-glutamic acid potassium salt monohydrate), 0.5% BSA, adjusted to pH 8.25 with KOH (see Note 4). Filter sterilize solution and store at 4°C in a light-protected or foil-wrapped container.
1 M CaCl2 solution. Filter sterilize and store at room temperature.
1 M MgCl2 solution. Filter sterilize and store at room temperature.
Biotin-labeled anti-HA antibody (Covance).
Streptavidin-PE (BD Biosciences).
FITC-conjugated chicken anti-cMyc antibody (Immunology Consultants Laboratory, Inc.).
Costar 96-well V-bottom plate (Sigma-Aldrich).
BD FACScalibur or LSRII™ cytometer (BD Biosciences) or other cytometer with equivalent optics.
FlowJo software (Tree Star Inc.).
3. Methods
Carry out all procedures on ice, unless otherwise specified.
3.1. Preparation of Dual-Labeled Double-Stranded DNA Substrates
In 0.2 mL PCR tubes, mix 0.08 µL Platinum High Fidelity Taq, 2 µL 10× Taq buffer, 1.3 µL 50 mM MgSO4, 0.4 µL 10 mM dNTPs, 2 nM (final concentration) target site template oligo, 0.55 nM (final concentration) of each the A647 universal FP and biotin universal RP. Add H2O to a final volume of 20 µL (see Note 5).
-
Thermal cycler program (for PCR amplification of target and incorporation of labels):
90°C × 1 min.
40× (86°C × 15 s, 48°C × 15 s, 60°C × 30 s).
60°C × 15 min.
40× (70°C × 30 s, decrease by 1°C every cycle) (see Note 6).
Hold at 4°C.
Digest excess single-stranded DNA with exonuclease I: Add 2 units of ExoI to each 20 µL PCR reaction in 2 µL total volume of water (see Note 7). Digest 1 h at 37°C. This reaction can be stored at 4°C overnight or at −20°C for extended periods.
Load the hydrated sephadex G-100 suspension into the filter plate. For each 20 µL PCR reaction to be purified, add 500 µL total volume of suspension to a filter plate well. This is best accomplished by loading 320 µL sephadex suspension (using wide bore tips) into each necessary well of the filter plate, centrifuging briefly up to a speed of 500 × g, discarding water, and adding the remaining 180 µL sephadex (see Note 8). The plate should then be dehydrated by centrifugation at 2,000 × g for 7 min.
Load the 22 µL PCR + ExoI reaction directly to the center of each sephadex column. Secure a 96-well PCR plate below the filter plate to catch the purified flow-through, using tape if necessary. Centrifuge for 5 min at 2,000 × g. Approximately 12–14 µL of flow-through should be present in each recipient well.
Determine the concentration of purified target site substrates using a nanodrop spectrophotometer. Target concentration should be approximately 10–25 ng/µL. A concentration greater than 25 ng/µL suggests inadequate ExoI digestion or sephadex purification.
Run target oligos on a 15% polyacrylamide gel. For a 7.5 mL gel, combine 0.75 mL 10× TBE, 3.75 mL 30% acrylamide/bis (19:1), and 2.9 mL water. Add 100 µL 10% APS and 10 µL TEMED, then immediately mix and pipette into the prepared gel cassette. Once the gel is set, load 0.5–1.0 mL purified tar get, diluted with 1.0 µL 6× Ficoll loading buffer and 4 µL water (see Note 9). Use 0.1 µL of the A647-labeled primer as a size standard. Run the gel for 90 min at 120 V.
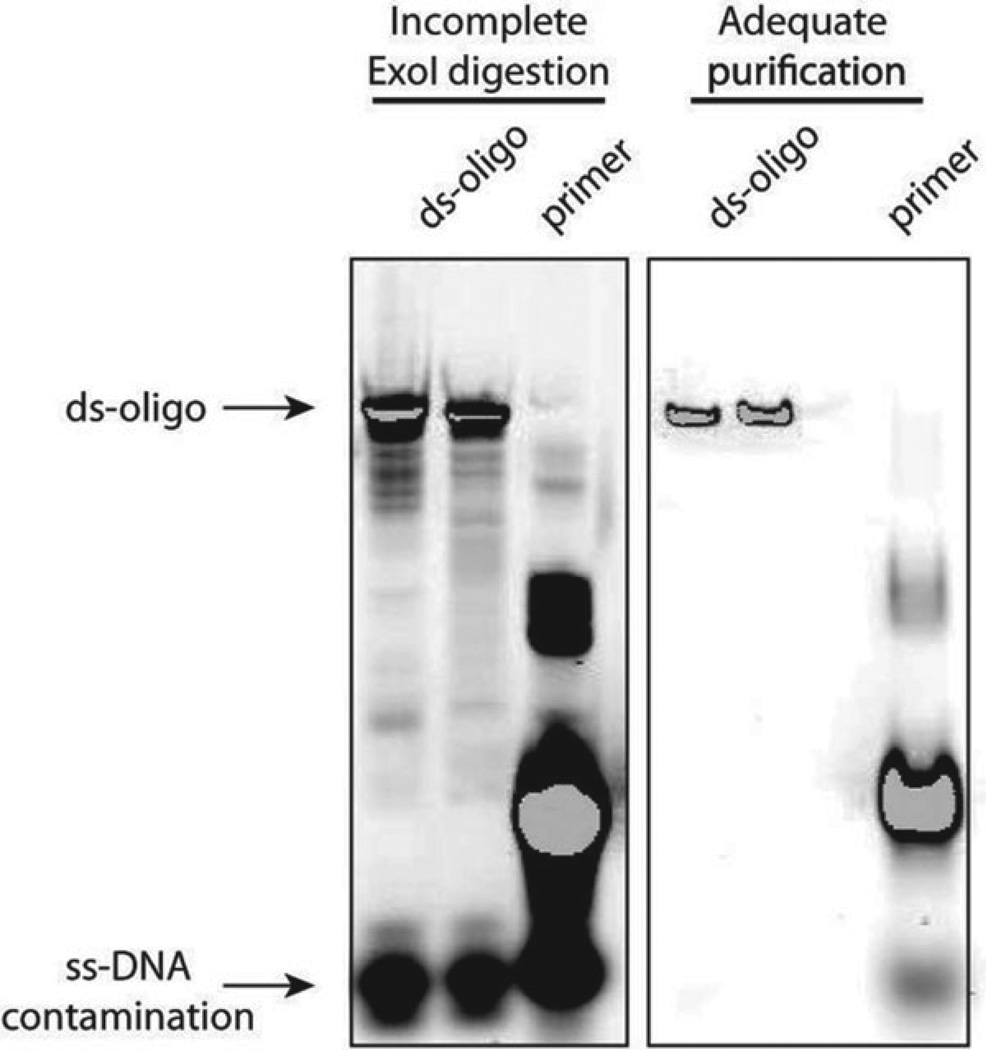
Visualize the gel on a LI-COR Odyssey infrared imager, using the 700 nM laser. The gel should show a prominent single PCR product and minimal contamination by other bands or leftover primers (Fig. 4). Alternatively, the gel can be stained with 1 × SybrGold in 1 × TBE for 20 min, washed in 1 × TBE or water, and visualized on a UV transilluminator.
Fig. 4.
DNA target production and purification. Following PCR amplification and annealing of double-stranded oligo target, ExoI digestion and sephadex G-100 filtration are used to remove contaminating ss-DNA and unincorporated nucleotides. Incomplete digestion with ExoI or inadequate G-100 purification, as can occur with cracked or incorrectly packed columns, leaves significant ss-DNA (left), which will lead to poor staining with the conjugated target-SAV-PE in the cleavage and binding assays. Correct purification leaves minimal ss-DNA contamination (right).
3.2. Yeast Transformation
(This transformation procedure is based on published protocols by Gietz and Schiestl) (14).
Thaw and spin down a frozen aliquot of EBY100 competent yeast cells (see Note 10).
Resuspend the pellet in the following transformation mixture: 50 µL denatured 2 mg/mL salmon sperm DNA (heat at 95°C for 5 min, then transfer immediately to ice), 36 µL 1 M LiAc, 260 µL 50% PEG 3350, and 14 µL water plus plasmid DNA (up to 1 µg) (see Notes 11 and 12).
Incubate the yeast and transformation mixture at 42°C for 40 min (see Note 13).
Fill the tube with SC–Ura–Trp + 2% glucose media and spin down the cells. Remove supernatant.
Resuspend the yeast pellet in 1 mL SC–Ura–Trp + 2% glucose media.
Plate 1–10 µL transformed yeast on selective growth media agar plates (SC–Ura–Trp + 2% glucose) and incubate in a 30°C water-jacketed incubator. Colonies of an appropriate size for picking should appear by 48 h.
3.3. Growth and Induction of Yeast
Transfer a single colony of transformed yeast into 1.5 mL SC–Ura–Trp + 2% raffinose + 0.1% glucose media (see Note 14).
Incubate overnight in a 15 mL culture tube at 30°C with 250 rpm shaking until the cells reach a density of 90–120 million/mL and place on ice for up to 24 h (see Note 15).
Wash 30 million cells twice with water and transfer to 1.5 mL of SC–Ura–Trp + 2% galactose media (see Note 16).
Incubate the galactose culture on the benchtop (room temperature with no shaking) for 16–18 h for optimal induction (see Note 17).
3.4. Yeast Surface Display Flow Cytometric DNA Cleavage Assay
All components should be kept on ice throughout the assay, unless otherwise specified, including YSB and IOCB buffers. If possible, the centrifuge should also be kept at 4°C.
Determine the density of induced yeast in the galactose culture. This can be accomplished using a hemocytometer and microscope or by spectrophotometer (see Note 18). Aliquot 500,000 yeast per sample into a 96-well, V-bottom plate (see Notes 19 and 20).
Wash cells twice with 200 µL 1× YSB, centrifuging the V-bottom plate at 3,000 × g for 2 min and discarding the supernatant.
Gently resuspend cells at a concentration of 50 million/mL in 1× YSB with 1:300 dilution of anti-HA-biotin antibody (i.e., consider the anti-HA-biotin to be a 300× stock). Incubate at 4°C for 30–60 min, mixing gently every 10–15 min.
During the anti-HA stain, prepare target oligos for conjugation in either 1.5 mL microcentrifuge tubes or plate format. For 500,000 cells (final cell density of 50 million/mL), use 25 µL total volume per well. SAV-PE should be diluted to 5 nM in the high-salt 1× YSB + KCl buffer. Add the labeled ds-oligo target to a final concentration of 50 nM (see Notes 21 and 22). Aliquot to plates (if necessary) and incubate in the dark and on ice for 20 min.
Following the anti-HA incubation, centrifuge cells for 2 min at 3,000 × g, and wash yeast cells twice with 200 µL ice-cold high-salt 1× YSB + KCl.
Following the second wash, resuspend yeast cells with oligo conjugates. Gently vortex or pipette to resuspend.
Incubate 30 min at 4°C, mixing briefly every 5–10 min.
During this incubation, make 5 mM MgCl2 and CaCl2 solutions in 1× IOCB, and prewarm to 37°C.
Following incubation with oligo, wash yeast with 200 µl ice-cold high-salt 1× YSB + KCl, and centrifuge for 2 min at 3,000 × g. Resuspend conjugated yeast in 200 µL ice-cold 1× IOCB (containing no divalent ions).
Create duplicate wells (one will contain calcium for no cleavage, and one will contain magnesium to allow cleavage) by transferring half of the resuspended volume into an adjacent set of wells. Bring volume back to 200 µL with ice-cold 1× IOCB. Centrifuge for 2 min at 3,000 × g. Discard the supernatant and blot/tap vigorously on paper towels to remove as much buffer as possible.
Add 30 µL 1× IOCB containing either Ca2+ or Mg2+ (pre-warmed to 37°C) to each set of duplicate wells. Add Ca2+ IOCB first to minimize background cleavage events in the negative control, and work as quickly as possible.
Incubate 20 min at 37°C.
Fill wells with ice-cold 1× YSB to stop the reaction, centrifuge 2 min at 3,000 × g, and discard the supernatant.
Resuspend in 25 µL 1× YSB containing 1:100 dilution of anti-Myc FITC to a final cell density of 100 million/mL.
Incubate 1–2 h at 4°C, with foil wrap or in a refrigerator to protect from light, vortexing occasionally to keep the cells in suspension (see Note 23).
Wash cells twice with 1× YSB, and resuspend in a final volume of 60 µL. This will lead to an acquisition rate of 1,000–2,000 events/s depending on the acquisition settings for the cytometer. Acquire data on a BD Biosciences LSRII with HTS. Record FSC-A, FSC-H, SSC-A, SSC-H, APC, PE, and FITC.
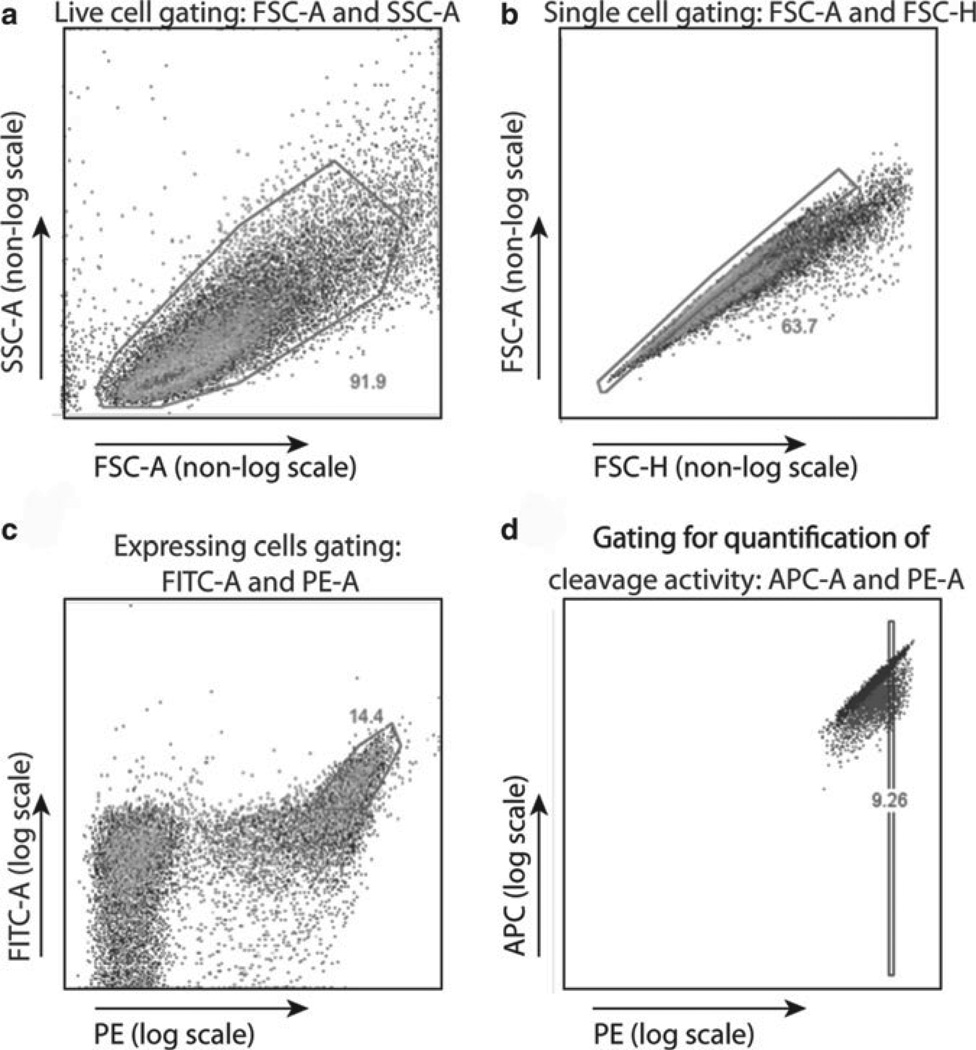
Analyze the flow cytometry data using FlowJo. Gate live cells (FSC-A by SSC-A), then singlets (FSC-H by FSC-A), then cells staining for both FITC and PE (representing full-length expression of both the C′ and N′ termini) (Fig. 5). Visualize this final subset as APC (y-axis) versus PE (x-axis). Superimpose the Ca2+ and Mg2+ samples to observe any cleavage-induced shift in APC signal. Quantitative measurements of cleavage efficiency can be obtained by determining the median APC signal within a small gated subset of live, singlet, expressing cells. A greater Ca2+-to-Mg2+ median APC ratio represents increased cleavage efficiency (Fig. 5d).
Fig. 5.
Analysis of flow cytometry data from on-cell cleavage assay. (a) Live cells are gated first, using FSC-A and SSC-A parameters, followed by (b) singlet cells using FSC-A and FSC-H. With proper induction conditions, approximately 50% of cells will display the enzyme, and (c) the high-expressing population is gated using PE (which is bound to the N-terminal HA tag) and FITC (which is bound by antibody directly to the C-terminal Myc tag). Cleavage activity is visualized within this expressing population in (d) a plot of A647 fluorescence (in the APC channel, bound to the free end of the conjugated DNA) versus PE. Cleavage activity can be quantified by gating on a PE-normalized subset of the expressing cells and taking the ratio of the median APC fluorescence for the control (Ca2+) and experimental (Mg2+) conditions.
3.5. Yeast Surface Display Flow Cytometric DNA-Binding Assay
Determine the density of induced yeast. This can be done using a hemocytometer or by spectrophotometry, as described above.
Aliquot 100,000 yeast to appropriate wells in a 96-well plate (for 384-well format, see Note 24) and wash once with 200 µL 1× IOCB containing 5 mM CaCl2. Centrifuge at 3,000 × g for 2 min and discard the supernatant.
Resuspend cells in 30 µL 1× IOCB containing 5 mM CaCl2, 1:100 anti-Myc FITC, and the desired concentration of target site oligo (see Note 25). Incubate at 4°C for 2 h, vortexing gently every 30 min.
Wash twice with 1× IOCB + 5 mM CaCl2.
Resuspend in 60 µL 1× IOCB + 5 mM Ca2+ for flow cytometry analysis. A final volume of 60 µL will lead to 500–1,000 events/s.
Acquire data on a BD Biosciences LSRII with HTS. Record FSC-A, FSC-H, SSC-A, SSC-H, APC, and FITC. If using HTS for collecting 96- or 384-well plate samples, set machine to mix samples minimum 3×.
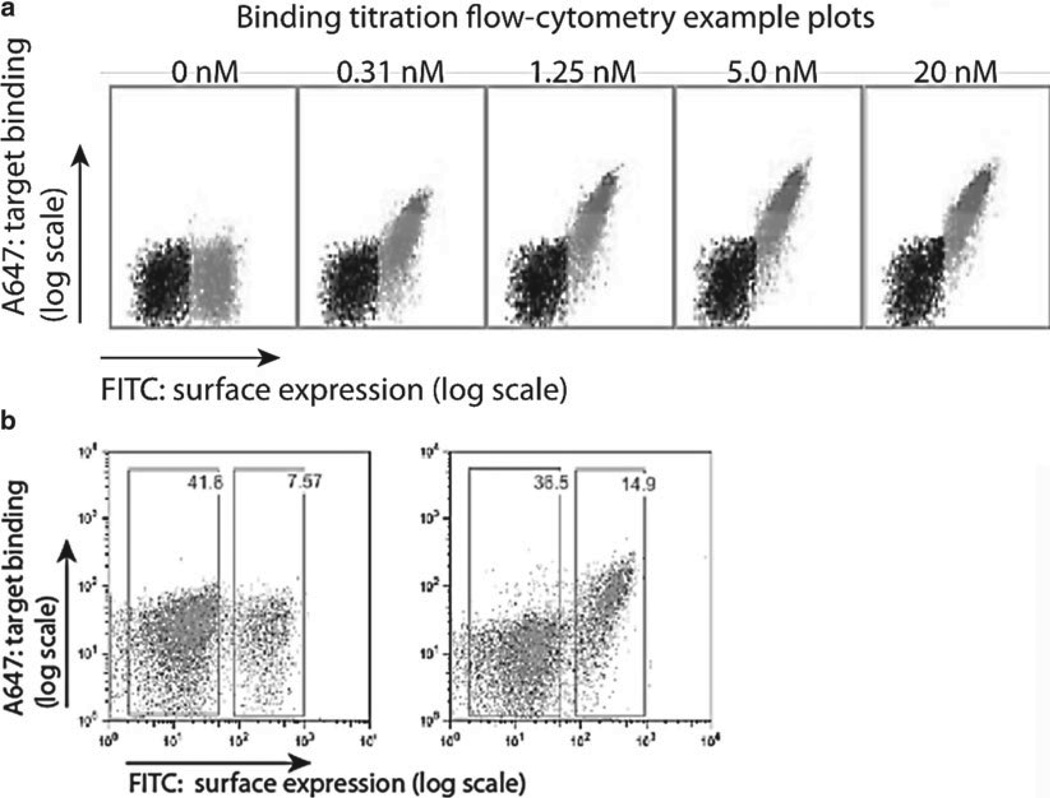
Analyze the flow cytometry data using FlowJo. Gate first the live cells, then singlets, then expressing cells, as described above. APC signal represents binding of the A647-labeled oligo to the surface-expressed homing endonuclease. Quantitative measurements of binding can be obtained by determining the ratio of median APC signal of the FITC-positive cells (which are expressing homing endonuclease) to the median APC signal of the FITC-negative cells (no homing endonuclease expression) (Fig. 6).
Fig. 6.
Example of binding titration and analysis of flow cytometry data from on-cell binding assay. Live and singlet cells are gated as in the cleavage assay. Anti-Myc FITC staining delineates the population of yeast expressing enzyme, and A647 signal represents binding of the A647-labeled target oligo substrate. (a) Binding affinity on individual clones or sorted population can be quantified using binding titrations where cells expressing enzyme are incubated with a range of target substrate concentrations (0–20 nM as indicated in the depicted experiment). (b) Binding affinity can be approximated by gating a FITC-normalized subset of the expressing cells and plotting the median APC fluorescence to a nonlinear regression curve as described previously (12).
Footnotes
The biotin and A647 labels can be affixed to either the forward or the reverse primer. Maximum cleavage signal is achieved empirically by testing each endonuclease with both labeling schemes. For reasons that remain speculative, a more pronounced cleavage shift may occur with the A647 label on one end of the oligo versus the other.
10× Tris/acetate/EDTA (TAE) buffer can be used in place of 10× TBE buffer. If this substitution is made, be sure to use 1× TAE as the gel running buffer in place of 1× TBE.
If autoclaving, add the glucose after autoclaving. To increase the shelf life of this media, make a 50× stock of the adenine hemisulfate and add it at 1× concentration just prior to use. Store the 50× stock at −20°C (upon thawing, there will be a small amount of precipitation which will not go back into solution).
Solution should be adjusted to pH 7.5 using KOH. This limits introduction of additional sodium ions.
Target oligo can be made in large batches and stored at −80°C in a light-protected container. One 20 µL PCR reaction should yield approximately 12–14 µL of purified 300–500 nM substrate. When scaling up production of these substrates, maintain 20 µL PCR reaction volumes, and increase the number of reactions simultaneously run.
This gradual decrease in final temperature allows for high-efficiency annealing into double-stranded DNA target oligo (leaving minimal single-stranded or mis-annealed target).
ExoI is diluted with water to a total volume of 2 µL per sample for ease and accuracy of transfer to the PCR reaction. Do not add any of the supplied ExoI buffer.
Special care should be taken to avoid any bubbles in the sephadex suspension when mixing or aliquoting to the filter plate. Bubbles will lead to cracks within the final, centrifuged sephadex columns, and cracked columns should be discarded. We find that careful pipetting, using wide bore tips or standard p200 tips cut at approximately the 50 µL gradation, reduces frequency of cracking. We also find that allowing 30 min between pipetting and centrifugation can significantly reduce column cracking.
While it is more difficult to load samples without dye in the loading buffer, this allows for clear visualization of the target oligo and A647-labeled primer. Colored dyes will fluoresce under the LI-COR excitation and confound the image.
Frozen competent cells are prepared according to the published protocol by Gietz and Schiestl (15). Add 2.5 × 10⁹ EBY100 cells from an overnight 2× YPAD culture to 500 mL fresh 2× YPAD media. Grow at 30°C to a density of at least 20 million/mL. Pellet the cells and wash with sterile water. Resuspend the washed cell pellet in 5 mL of 5% v/v glycerol + 10% v/v DMSO in water. Aliquot 50 µL volumes to microcentrifuge tubes. Pack the tubes into a Styrofoam rack with lid (or similar form of insulation) and place at −80°C. (The insulation allows for gradual freezing of the cells).
When transforming a library of variant homing endonucleases, increase the number of yeast and volume of the transformation mixture according to Gietz and Schiestl (16).
When transforming high-quality plasmid DNA, a single frozen aliquot of competent yeast cells in the described volume of transformation mixture can be used for multiple reactions. In this case, divide the resuspended cells (prior to addition of DNA) into up to 15 equal volumes and add up to 1 µL total volume of plasmid DNA to each aliquot. Proceed to the incubation step.
We have found that an incubation time of 40–42 min at 42°C provides the highest transformation efficiency with lowest cell death. Longer incubation times can lead to significant cell death. If using a high-quality plasmid, a shorter incubation time of 20 min will suffice for the generation of transformed clones.
Raffinose cultures can be successfully started using a single colony from a selective media + glucose plate. Alternatively, we have found that an initial overnight incubation in YPAD media (at 30°C with 250 rpm shaking) can substantially increase induction efficiency, and the absence of selective media at this stage does not result in significant plasmid loss.
When using vertical tube racks inside a shaking incubator, position the 15 mL culture tubes at a slant to allow for maximum aeration, and do not use more than 1.5 mL of media.
Care should be taken to wash yeast from the raffinose culture at least twice before transferring to the galactose media. This limits carry-over of raffinose and/or glucose.
Induced cultures should be kept on ice or at 4°C following the galactose induction, in the 2% galactose media. Well-folded homing endonucleases will be stably expressed on the yeast surface for several days, although the total expression levels and catalytic activity may decrease slightly, depending on endonuclease.
On our spectrophotometer, the density of a yeast culture can be estimated by mixing a 1:10 dilution of yeast in water and measuring the resulting OD600. A simple calculation of OD600×300 provides an estimated value for density of the culture in millions of cells per milliliter. The validity of this estimate should be checked when using a different instrument.
If running a large number of samples, the assay can be performed in a 384-well conical-bottom plate, with 50,000 cells/well. Volumes for staining and wash steps for a 384-well plate are 8 µL anti-HA stain, 8 µL conjugated DNA-SAV-PE stain, and 10 µL anti-Myc FITC stain. All washes should use a minimum 100 µL buffer.
If running a small number of samples, the assay can be performed using 1.5 mL microcentrifuge tubes. In this format, cells can be spun down in a tabletop centrifuge at speeds up to 10,000 × g for 1 min. Perform 4°C incubation steps on slow rotator, if possible.
Include the volume of target oligo in calculations for total conjugation reaction, as the dilution volume should be around 1:8–1:14, and is therefore substantial. The resulting slight decrease in IOCB salt concentration is not problematic at this point and can be disregarded.
If using 1.5 mL microcentrifuge tubes, pipette the oligo onto the side of the tube not contacting SAV-PE, then gently vortex to mix SAV-PE and oligo quickly. Likewise, in plate format the oligo should be pipetted onto the side of plate wells not contacting the SAV-PE mixture, if possible, and quickly mixed by vortex or multichannel pipette.
Yeast can be left in anti-Myc FITC stain overnight, if necessary. Due to relatively low affinity of this antibody, FITC-stained cells should not be washed or diluted greater than 2× if cells are to sit for more than 4 h prior to acquisition.
25,000 yeast can be assayed in a 384-well plate format. Use a total volume of 20 µL. Low cell number is important to ensure that the effective concentration of ds-oligo substrate is not altered in affinity titration experiments.
For the I-OnuI family of homing endonucleases, specific binding can be detected from 100 pM to 50 nM. Higher concentrations of oligo may be nonspecifically bound and lower concentrations can be difficult to detect. This protocol can also be used to determine binding along a titration of various oligo concentrations.
References
- 1.Takeuchi R, Lambert AR, Mak AN-S, Jacoby K, Dickson RJ, Gloor GB, Scharenberg AM, Edgell DR, Stoddard BL. Tapping natural reservoirs of homing endonucleases for targeted gene modification. Proc Natl Acad Sci USA. 2011;108(32):13077–13082. doi: 10.1073/pnas.1107719108. [DOI] [PMC free article] [PubMed] [Google Scholar]
- 2.Heath PJ, Stephens KM, Monnat RJ, Stoddard BL. The structure of I-Crel, a group I intron-encoded homing endonuclease. Nat Struct Biol. 1997;4(6):468–476. doi: 10.1038/nsb0697-468. [DOI] [PubMed] [Google Scholar]
- 3.Duan X, Gimble FS, Quiocho FA. Crystal structure of PI-SceI, a homing endonuclease with protein splicing activity. Cell. 1997;89(4):555–564. doi: 10.1016/s0092-8674(00)80237-8. [DOI] [PubMed] [Google Scholar]
- 4.Gimble FS. Invasion of a multitude of genetic niches by mobile endonuclease genes. FEMS Microbiol Lett. 2000;185(2):99–107. doi: 10.1111/j.1574-6968.2000.tb09046.x. [DOI] [PubMed] [Google Scholar]
- 5.Jurica MS, Stoddard BL. Homing endonucleases: structure, function and evolution. Cell Mol Life Sci. 1999;55(10):1304–1326. doi: 10.1007/s000180050372. [DOI] [PMC free article] [PubMed] [Google Scholar]
- 6.Thermes V, Grabher C, Ristoratore F, Bourrat F, Choulika A, Wittbrodt J, Joly JS. I-SceI meganuclease mediates highly efficient transgenesis in fish. Mech Dev. 2002;118(1–2):91–98. doi: 10.1016/s0925-4773(02)00218-6. [DOI] [PubMed] [Google Scholar]
- 7.Gouble A, Smith J, Bruneau S, et al. Efficient in toto targeted recombination in mouse liver by meganuclease-induced double-strand break. J Gene Med. 2006;8(5):616–622. doi: 10.1002/jgm.879. [DOI] [PubMed] [Google Scholar]
- 8.Arnould S, Perez C, Cabaniols JP, Smith J, Gouble A, Grizot S, Epinat JC, Duclert A, Duchateau P, Paques F. Engineered I-CreI derivatives cleaving sequences from the human XPC gene can induce highly efficient gene correction in mammalian cells. J Mol Biol. 2007;371(1):49–65. doi: 10.1016/j.jmb.2007.04.079. [DOI] [PubMed] [Google Scholar]
- 9.Gao H, Smith J, Yang M, et al. Heritable targeted mutagenesis in maize using a designed endonuclease. Plant J. 2010;61(1):176–187. doi: 10.1111/j.1365-313X.2009.04041.x. [DOI] [PubMed] [Google Scholar]
- 10.Windbichler N, Papathanos PA, Catteruccia F, Ranson H, Burt A, Crisanti A. Homing endonuclease mediated gene targeting in Anopheles gambiae cells and embryos. Nucleic Acids Res. 2007;35(17):5922–5933. doi: 10.1093/nar/gkm632. [DOI] [PMC free article] [PubMed] [Google Scholar]
- 11.Smith F, Rouet P, Romanienko PJ, Jasin M. Double-strand breaks at the target locus stimulate gene targeting in embryonic stem cells. Nucleic Acids Res. 1995;23(24):5012–5019. doi: 10.1093/nar/23.24.5012. [DOI] [PMC free article] [PubMed] [Google Scholar]
- 12.Jarjour J, West-Foyle H, Certo MT, Hubert CG, Doyle L, Getz MM, Stoddard BL, Scharenberg AM. High-resolution profiling of homing endonuclease binding and catalytic specificity using yeast surface display. Nucleic Acids Res. 2009;37(20):6871–6880. doi: 10.1093/nar/gkp726. [DOI] [PMC free article] [PubMed] [Google Scholar]
- 13.Volná P, Jarjour J, Baxter S, Roffler SR, Monnat RJ, Stoddard BL, Scharenberg AM. Flow cytometric analysis of DNA binding and cleavage by cell surface-displayed homing endonucleases. Nucleic Acids Res. 2007;35(8):2748–2758. doi: 10.1093/nar/gkm182. [DOI] [PMC free article] [PubMed] [Google Scholar]
- 14.Gietz RD, Schiestl RH. High-efficiency yeast transformation using the LiAc/SS carrier DNA/PEG method. Nat Protoc. 2007;2(1):31–34. doi: 10.1038/nprot.2007.13. [DOI] [PubMed] [Google Scholar]
- 15.Gietz RD, Schiestl RH. Frozen competent yeast cells that can be transformed with high efficiency using the LiAc/SS carrier DNA/PEG method. Nat Protoc. 2007;2(1):1–4. doi: 10.1038/nprot.2007.17. [DOI] [PubMed] [Google Scholar]
- 16.Gietz RD, Schiestl RH. Large-scale high-efficiency yeast transformation using the LiAc/SS carrier DNA/PEG method. Nat Protoc. 2007;2(1):38–41. doi: 10.1038/nprot.2007.15. [DOI] [PubMed] [Google Scholar]


