Abstract
State-dependent neuronal firing patterns reflect changes in ongoing information processing and cortical function. A disruption of neuronal coordination has been suggested as the neural correlate of anesthesia. Here, we studied the temporal correlation patterns of ongoing spike activity, during a stepwise reduction of the volatile anesthetic desflurane, in the cerebral cortex of freely moving rats. We hypothesized that the recovery of consciousness from general anesthesia is accompanied by specific changes in the spatiotemporal pattern and correlation of neuronal activity. Sixty-four contact microelectrode arrays were chronically implanted in primary visual cortex (contacts spanning 1.4 mm depth and 1.4 mm width) for recording of extracellular unit activity at four steady-state levels of anesthesia (8%–2% desflurane) and wakefulness. Recovery of consciousness was defined as the regaining of the righting reflex (near 4%). High-intensity firing (HI) periods were segmented using a threshold (200 ms) representing the minimum in the neurons’ bimodal interspike interval histogram under anesthesia. We found that the HI periods were highly fragmented in deep anesthesia and gradually transformed to a near-continuous firing pattern at wakefulness. As the anesthetic was withdrawn, HI periods became longer and increasingly correlated among the units both locally and across remote recording sites. Paradoxically, in 4 of 8 animals, HI correlation was also high at the deepest level of anesthesia (8%) when local field potentials (LFP) were burst-suppressed. We conclude that recovery from desflurane anesthesia is accompanied by a graded defragmentation of neuronal activity in the cerebral cortex. Hypersynchrony during deep anesthesia is an exception that occurs only with LFP burst suppression.
Keywords: Consciousness, Anesthesia, Correlation, Synchrony, Burst suppression
INTRODUCTION
Spatiotemporal patterns of neuronal activity are strongly influenced by altered states of consciousness such as anesthesia, sleep and wakefulness. Anesthetic agents suppress firing rate (Detsch et al., 2002, Hudetz et al., 2009, Villeneuve et al., 2009), synaptic connectivity (Vizuete et al., 2012), and rhythms of population activity in neuronal networks (Hudetz et al., 2011, Lewis et al., 2012) These changes are thought to impair information processing and consciousness (Alkire et al., 2008, Lee et al., 2009, Brown et al., 2010).
A recent study in human patients demonstrated rapid spatial and temporal fragmentation of neuronal activity during propofol-induced unconsciousness (Lewis et al., 2012). Likewise, in rodents anesthetized with urethane, neurons tend to fire in synchronous bursts in a pattern different from normal ongoing activity in wakefulness (Erchova et al., 2002). The alternation of neuronal spiking periods under urethane and ketamine/xylazine anesthesia associated with shifts in bistable membrane potential and slow electrocortical oscillations have also been known as UP/DOWN states (Kasanetz et al., 2002, Clement et al., 2008, Destexhe, 2009). Similar behavior has been observed in natural slow-wave sleep (Destexhe et al., 2007).
Most earlier studies were made in relatively deep anesthesia and thus little is known about the spatiotemporal properties of neuronal firing at shallower and graded anesthesia levels, particularly those associated with loss and return of consciousness. A few recent investigations examined the graded effect of isoflurane on spontaneous or stimulus-evoked local field potential and unit activity in the cerebral cortex of rodents and ferrets. Only one of these studies included measurements in unrestrained wakeful animals (Sellers et al., 2013).
To learn more about the neuronal dynamics during the transition between anesthetized and wakeful states, here we set out to investigate the graded effect of anesthesia on cortical unit activity in chronically instrumented, unrestrained rats. The primary focus of the study was the state-dependent change in temporal correlation of high-frequency firing periods similar, although not identical, to UP/DOWN or ON/OFF states. We chose to investigate the effect of anesthesia during emergence, that is, during a stepwise reduction of the anesthetic dose from deep to light levels and finally, to wakefulness. To aid this protocol, we chose to use desflurane - a modern, clinically used anesthetic that has the property of rapid equilibration and ease of control at steady-state condition. The range of anesthetic depths were chosen to include those closely associated with the recovery of consciousness – a phenomenon whose neuronal correlates are of significant interest.
EXPERIMENTAL PROCEDURES
The experimental procedures and protocols were reviewed and approved by the Institutional Animal Care and Use Committee. All procedures conformed to the Guiding Principles in the Care and Use of Animals of the American Physiologic Society and were in accordance with the Guide for the Care and Use of Laboratory Animals (National Academy Press, Washington, D.C., 1996). All efforts were made to minimize discomfort and the number of animals used.
Electrode Implantation
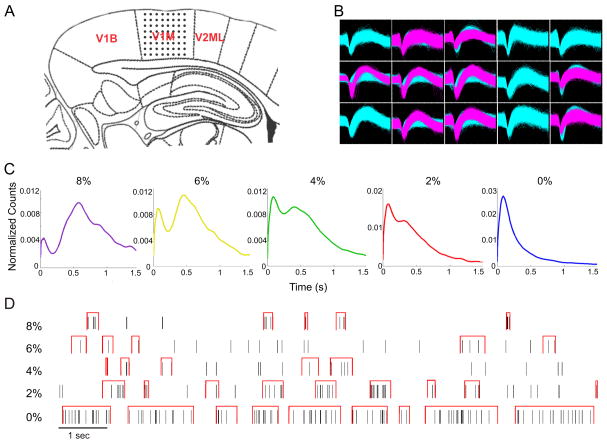
Experiments were performed on eight adult (260–440 gm) male Sprague-Dawley rats (Harlan Laboratories, Madison, WI). All animals were kept on a reversed light-dark cycle in dedicated rooms of the Animal Resource Center for at least one week prior to physiological experiments. On the day of the aseptic surgery, the rat was anesthetized using isoflurane (Abbot Laboratories, Chicago, IL) in an anesthesia box. The animal’s head was then secured in a rat stereotaxic apparatus (Model 900, Kopf Instruments, Tujunga, CA) and a gas anesthesia adaptor (Stoelting Co., Wood Dale, IL) was placed over the snout to continue anesthesia at ~2.0 % isoflurane. Body temperature was rectally monitored and maintained at 37° C via an electric heating pad (TC-1000, CWE Inc., Ardmore, PA). The antibiotic, Enrofloxacin (10mg/kg s.c.), was administered prior to surgery onset. The dorsal surface of the head was prepared for sterile surgery with betadine and alcohol. Bupivicaine, a local anesthetic, was injected under the skin prior to surgery. A midline incision was then made and the skin was laterally reflected to expose the cranium. Connective tissue was gently scraped and any bleeding was cauterized. A multishank, 64-contact microelectrode array (Neuronexus Technologies, Ann Harbor, MI; 5 mm length, 200 μm electrode spacing, 200 μm shank spacing) was chronically implanted within V1 (7.0 mm posterior, 3.0–3.5 mm lateral, relative to bregma), spanning the entire depth of the cortex (Figure 1A).
Figure 1.
Multichannel spike recording and delineation high-intensity firing (HI) vs. low-intensity firing (LO) states. Multichannel recording, spike-field correlation and duration-weighted interspike-interval histogram. (A) Electrode placement of the 64-contact neural probe in the rat primary visual cortex monocular region (V1M) in the right hemisphere. Each dot represents the approximate location of an electrode contact. Schematic is overlaid on a stereotaxic drawing obtained from the Paxinos rat brain atlas (sagittal slice, 7.0 mm posterior, 3.0–3.5 mm lateral, relative to bregma). (B) Example of recorded spike waveforms from 15 channels in one experiment. Waveforms of different colors represent different sorted units. (C) Interspike interval distributions in five anesthetic conditions (8%–0% desflurane). The distributions are bimodal with a minimum near 200 ms at all anesthetic levels except at wakefulness. (D) Illustration of HI periods (red brackets) at five anesthetic conditions in the same experiment. HI periods were defined as relatively tight spike groups (minimum of 3 spikes, consecutive spikes separated by <200 ms).
To implant the microelectrode array, a craniotomy of rectangular shape of approximately 2×4 mm was prepared using a low speed, compressed air-driven dental drill and bur No. FG 1 (Sullivan/Schein Dental, Melville, NY). The exposed dura mater was then resected and the electrode array inserted using a micromanipulator. The electrode was subsequently advanced at increments of 10 μm to a depth of approximately 2.1 mm below the brain surface. To secure the neural probe, the perimeter was covered with silicon gel (Kwik-Sil, World Precision Instruments, Sarasota, FL). A reference wire, attached to the neural probe, was wrapped around a cranial steel screw located between bregma and lambda in the opposite hemisphere (~4.0 mm posterior, ~2.0 mm lateral, relative to bregma). Additional sterilized stainless steel screws (MX-080-2, #0-80 × 1/8″, Components Supply Co Inc, Fort Meade, FL) were used to secure the electrode to the cranium. The whole assembly was embedded with Cerebond (MyNeurolab, Saint Louis, MO), a nontoxic skull fixture adhesive, such that the connectors protruded from the skull fixture adhesive cap. Carprofren (5 mg/kg s.c. once daily) and Enrofloxacin (10 mg/kg s.c. once daily) were administered for 2 and 7 days, respectively. The animal was then observed for 7–10 days for any infection or other complications.
Experimental Protocol
On the day of the experiment, the rat was placed in a cylindrical anesthesia chamber ventilated with a heated, humidified gas mixture of 30% O2, balance N2. Inspired O2 and anesthetic gas concentrations were continuously monitored (POET IQ2, Criticare Systems, Waukesha, WI). Since monitoring accuracy is 0.1%, an indication of the target or target ±0.1% concentration was accepted. Body temperature was rectally monitored and maintained at 37° C. The room was then darkened and the rat was allowed to freely move around in the box for approximately one hour to accommodate to the environment. Under 8% desflurane anesthesia, the headstage (64-channel zif-clip, Tucker-Davis Technologies, Alachua, FL) was connected to the implanted electrode array with connecting wire bundle that terminated on the preamplifier outside the anesthesia chamber. Extracellular potentials were recorded using a 64-channel neural acquisition system (Cerebus, Blackrock Microystems, Salt Lake City, UT) and analyzed for ongoing unit activity and local field potentials (LFP). For unit activity, the signal was analog-filtered at 250–7500 Hz, digitally sampled at 30 kHz and auto-thresholded using a root mean square multiplier of −6.25. For LFP, the signal was analog-filtered at 0.3–500 Hz and digitally sampled at 1 kHz. Ten minutes of ongoing activity was sequentially recorded under 8%, 6%, 4%, and 2% desflurane anesthesia and at wakefulness (0%). An equilibration time of 15–20 minutes was allowed before recording in each condition. In one experiment at 2% desflurane, the headstage was accidently disconnected; therefore data in this condition were not obtained.
Spike sorting
Extracellular unit activity from each electrode contact was sorted into individual units using the public domain offline spike sorter PowerNAP (OSTG, Inc., Fremont, CA); examples are illustrated in Figure 1B. This software applies principal component analysis (PCA) along with various clustering methods for sorting (Fee et al., 1996, Hudetz et al., 2009, Vizuete et al., 2012). A scatter plot using the first two principal components was constructed and K-means clustering analysis was used to define the cluster boundaries of individual units. Occasional remaining outliers were removed manually, if necessary. Active units with a spike rate of at least 1 s−1 were used for further analysis.
Segmentation of spike trains
In all experiments, analysis was performed on 2–5-min segments of data that were free from motion artifacts. Motion artifacts were manually identified by the presence of abrupt, large-amplitude deflections in the LFP. Sorted spikes for each unit were assigned to 1 ms bins and the current value of interspike interval (ISI) was assigned to each bin. A histogram of ISI values with 10 ms bins was calculated using the method of mean integrated squared error (MISE) (Shimazaki and Shinomoto, 2007), normalized to the total number of counts and smoothed using a 9-point moving average. With the exception of the wakeful condition, the resulting ISI histograms were generally bimodal with a local minimum at approximately 200 ms (Figure 1C). It was seen that the shorter mode of ISI values represented fast firing and the longer ISI mode represented the gaps between fast firing periods. The time series of spikes were then segmented into high-intensity firing (HI) and low-intensity firing (LO) periods. HI was defined as a period containing at least three consecutive spikes with less than 200 ms ISI (Cocatre-Zilgien and Delcomyn, 1992). All other periods were defined as LO. Figure 1D illustrates the segmentation of spikes into HI and LO periods in the five experimental conditions of the same animal.
Correlation of HI periods
The temporal correlation of HI periods among active units was calculated in a pairwise manner. Pearson’s correlation coefficient was obtained at zero lag from binary sequences of 0 and 1, where 1 and 0 marked the time points within HI and LO, respectively at 1 ms time bins. The correlation coefficient calculated by Pearson’s formula from binary data is equivalent to the sum of HI time points coincident between a select pair of units, normalized to the geometric mean of the sum of HI time points of the two units. Regarding the selection of unit pairs, we examined the local correlation of each unit with its 8 neighbors (fewer neighbors at edges and corners of the recording array), the all pair-wise correlation of 8 recording sites along the same electrode shank, and the all pair-wise correlation of 8 recording sites at the same recording depth. When computing correlations within the same recording depth, correlation coefficients were normalized to the total number of active units observed at the respective cortical depth. This helped compensate for higher probability of finding active units at shallower cortical depths. Recording sites with absent unit activity were excluded from the correlation calculations.
Spike-field correlation
The phasic relationship of LFP and unit activity was quantified by calculating the LFP-spike rate cross-correlogram (CCG). Ten minutes of LFP and unit data were used from each anesthetic condition and each animal. The LFP was band-pass filtered at 1–100 Hz (1st order Butterworth analog filter). For artifact rejection, LFP absolute values greater than 3 standard deviation were substituted with zero. Spike time stamps from sorted units with a minimum rate of 1 spike/s were used to form a population vector and spike rate histogram vs. time with 1 ms bins to match the 1 kHz sampling rate of the LFP. The CCG of the filtered LFP and population spike rate was calculated with lags from −1 to +1 seconds at 1 ms increment. The ACGs from all rats were averaged at each desflurane level. A second order polynomial was fitted to data from individual rats. Population vector and spike rate histogram calculations were done using the Neuroexplorer software (Version 4.091, Nex Technolgies, Madison, AL, USA).
LFP burst suppression
The degree of burst suppression was quantified by the burst suppression ratio (BSR), defined as the total length of time when the LFP was suppressed divided by the length of the recording. The LFP patterns from the various recording sites were similar; therefore, a representative LFP trace was chosen to calculate the BSR. The LFP was band-pass filtered at 8–100 Hz (1st order Butterworth analog filter), rectified, and smoothed by applying 500-point (0.5 s) moving average. From the obtained time series of amplitude values, those smaller than 1.5 standard deviation of the entire set were considered suppressed and counted toward the duration of the suppressed period.
Statistical analysis
The concentration-dependent effect of desflurane on the number of units and HI and LO duration were tested using repeated measures analysis of variance (RM-ANOVA) with desflurane concentration as within-factor, the subject (rat) as random variable, and the number of active units and duration as response variables. The distributions of baseline, HI and LO spike rates were tested for normality using the Kolmogorov-Smirnov (K-S) test. When distributions deviated from normal (effect of desflurane on the baseline spike rate, K-S, p<0.05), Kruskal-Wallis one-way analysis of variance (KW-ANOVA) was used. Deviation of the slope from zero was tested using a linear trend planned comparison test. The Within-shank and same-depth correlation data were tested using two-way ANOVA with the desflurane concentration and shank (or depth) as a fixed factor. The concentration-dependent effect of desflurane on the nearest neighbor correlation was tested with RM-ANOVA with type (HI vs LO) as between-factor, desflurane concentration as within-factor, and the rat as subject (random) variable. When the interaction term was significant, the component effects were further examined using Tukey-Kramer Multiple-Comparison test (T-K). BSR values were stratified into high and low groups with K-means clustering at K=2. Statistical analyses were performed using NCSS 2007 (NCSS, Kaysville UT) or MATLAB R2007b (Mathworks, Natick, MA).
RESULTS
Behavioral observations
Spontaneous movement at 8% and 6% desflurane concentration was completely absent, operationally confirming unconsciousness. The moderate depth of anesthesia (4% desflurane), was characterized by sporadic and brief behavioral changes such as, temporary whisker twitching or chewing, as well as partial or complete return of the righting reflex suggesting a transition to consciousness. During light anesthesia (2% desflurane), most rats displayed frequent head and limb movements and postural changes that lasted for several seconds. During wakefulness (0% desflurane), rats displayed typical intermittent grooming and exploratory behaviors as well as quiet, but alert immobility.
Unit activity and LFP
Spikes were detected at approximately half of the recording sites (58±12%). Spike sorting yielded one to three units from each electrode contact. Decreasing desflurane concentration from 8% to 0% was accompanied by an increase in the number of active units (F7,4=31.80, p=0.001, N=40, RM-ANOVA) and baseline spike rate (H4=226.25, p=0.001, N=1779, K-W) (Table 1) with a significant linear trend for the number of units (t28=11.21, p=0.001, N=40) and spike rate (t1774=16.14, p=0.001, N=1779).
Table 1.
Number of active units, spike rate and HF/LF durations at four depths of anesthesia and wakefulness.
| Desflurane (%) | ||||
|---|---|---|---|---|
| 8 | 6 | 4 | 2 | |
| Number of units* | 254 | 302 | 388 | 425 |
| Spike rate, 1/s* | 2.0 (1.8, 2.2) | 2.7 (2.4, 3.1) | 3.1 (2.8, 3.4) | 4.1 (3.6, 4.7) |
| HI spike rate, 1/s* | 32.4 (31.0, 33.6) | 23.9 (22.9, 25.1) | 24.7 (24.1, 25.3) | 22.2 (1.5, 22.8) |
| LO spike rate, 1/s* | 1.2 (1.2, 1.3) | 2.0 (1.7, 2.2) | 2.2 (2.0, 2.3) | 2.6 (2.4, 2.8) |
| HI duration, s* | 0.120 (0.119, 0.121) | 0.174 (0.172, 0.176) | 0.194 (0.193, 0.195) | 0.236 (0.234, 0.238) |
| LO duration, s* | 1.293 (1.268, 1.318) | 0.701 (0.691, 0.711) | 0.708 (0.700, 0.716) | 0.588 (0.582, 0.594) |
HI: high-intensity firing period, LO: low-intensity firing period. Data represent median with 95% confidence.
p<0.05, linear trend
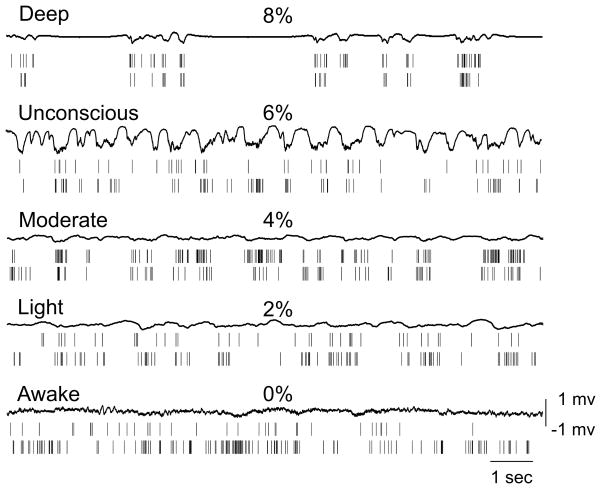
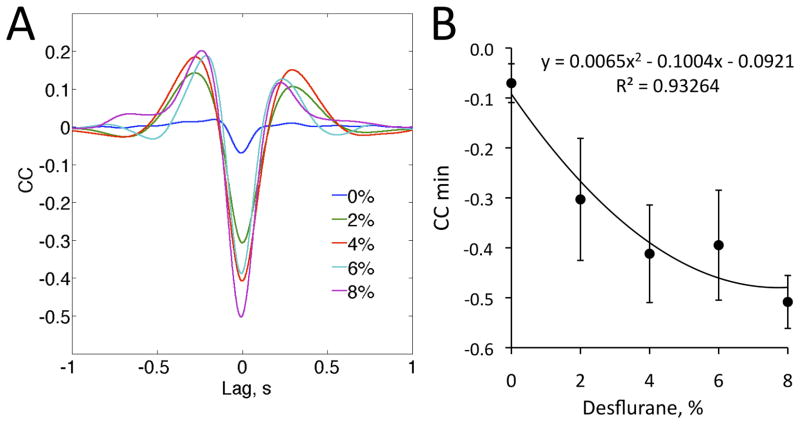
The temporal pattern of unit activity changed in parallel with the appearance of LFP (Figure 2). Under anesthesia, spikes tended to group according to the negative phase of the LFP. This was clearly reflected by the LFP-spike CCG, revealing a concentration-dependent effect of desflurane on the strength of the correlation quantified by the minimum value of the CCG (t4=3.18, p<0.005, N=40, quadratic trend) (Figure 3). During wakefulness, unit activity was nearly continuous. The grouping of spikes was particularly evident when burst suppression in the LFP was present. In this case, unit activity was absent during the suppressed LFP periods. Burst suppression occurred in half of the animals at 8% desflurane. The BSR values in rats 4–8 at 8% desflurane were distinctly higher than all other BSR values in eight rats (F38,1=2034, p<0.001, N=40, K-means) (Table 2). At 6%–0% desflurane, the BSR was negligibly small in all rats.
Figure 2.
Example of local field potential (LFP) and spike recordings in five conditions in the same animal. Spikes tend to group according to the negative phase of LFP under anesthesia. At 8% desflurane, LFP burst-suppression is present in this animal.
Figure 3.
Spike-field correlation. (A) Cross correlogram (CCG) between LFP and spike rate at four desflurane concentrations (8%–2%) and wakefulness (0%). (B) Effect of desflurane concentration on the minimum value of the CCG. CCG and data represent mean and standard deviation from eight animals.
Table 2.
Burst suppression ratio in eight rats
| Desflurane | |||||
|---|---|---|---|---|---|
| 8% | 6% | 4% | 2% | 0% | |
| Rat 1 | 0.0000 | 0.0000 | 0.0000 | 0.0008 | 0.0000 |
| Rat 2 | 0.0000 | 0.0000 | 0.0000 | 0.0003 | 0.0015 |
| Rat 3 | 0.0390 | 0.0000 | 0.0000 | 0.0000 | 0.0000 |
| Rat 4 | 0.0028 | 0.0000 | 0.0013 | 0.0174 | 0.0012 |
| Rat 5 | 0.7047* | 0.0036 | 0.0288 | 0.0075 | 0.0003 |
| Rat 6 | 0.5897* | 0.0000 | 0.0117 | 0.0000 | 0.0003 |
| Rat 7 | 0.5581* | 0.0000 | 0.0000 | 0.0000 | 0.0000 |
| Rat 8 | 0.7460* | 0.0019 | 0.0022 | 0.0390 | 0.0000 |
p<0.001 vs. all other
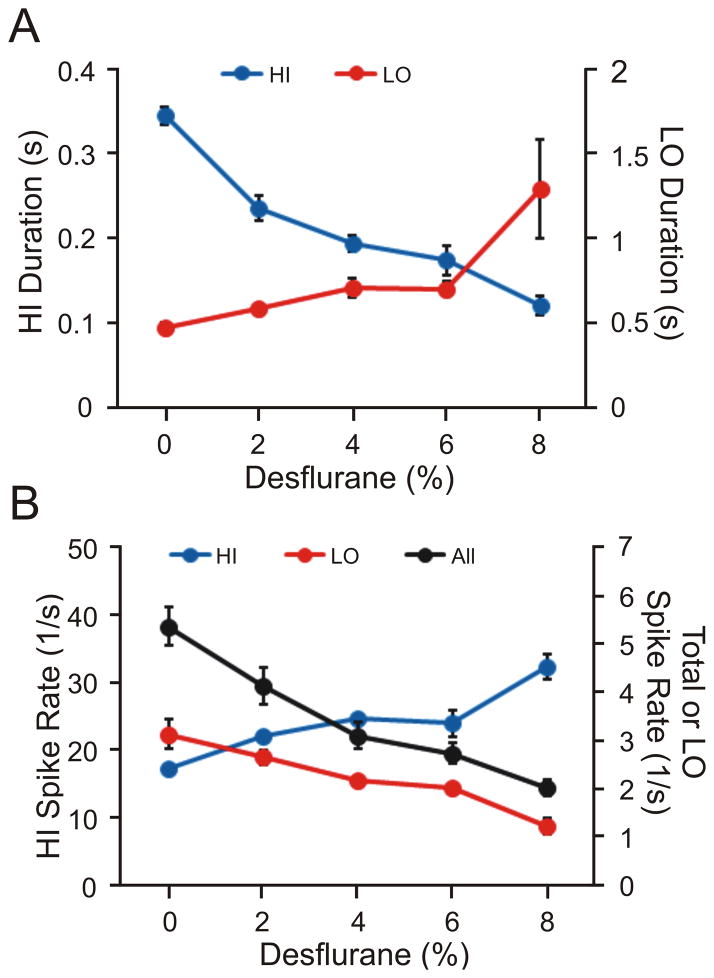
To quantify the temporal variation in unit activity, the spike trains were divided into high-intensity firing (HI) and low-intensity firing (LO) periods. As the anesthetic was stepwise withdrawn, the duration of HI periods increased (t28=12.6, p=0.001, N=40, linear trend) and the duration of LO periods decreased (t28=9.10, p=0.001, N=40, linear trend) (Figure 4A). From 8% desflurane to waking, the corresponding changes in HI and LO durations were 188% and –63%, respectively. Simultaneously, from deep anesthesia to waking, the spike rate during HI periods decreased (t1767=25.40 p=0.001, N=1772, linear trend) and the spike rate during LO periods increased (t1770=17.50, p=0.001, N=1775, linear trend) (Figure 4B). The corresponding changes were –47% and 158%. These results showed that spike rates became more balanced between the HI and LO periods. The overall spike rate (HI + LO) also increased by 170% (t1774=16.14, p=0.001, N=1779, linear trend).
Figure 4.
Concentration-dependent effect of desflurane on the firing properties of all recorded units. (A) Duration of high- intensity firing (HI) and low- intensity firing (LO) periods. Significant linear trends in both HI and LO duration as a function of desflurane concentration are present. (B) Average spike rates during HI/LO periods. Also shown is the average spike rate for the entire recording period (All). A significant linear trend is present in all cases. Data represent means and standard deviation.
Correlation of high-intensity firing periods
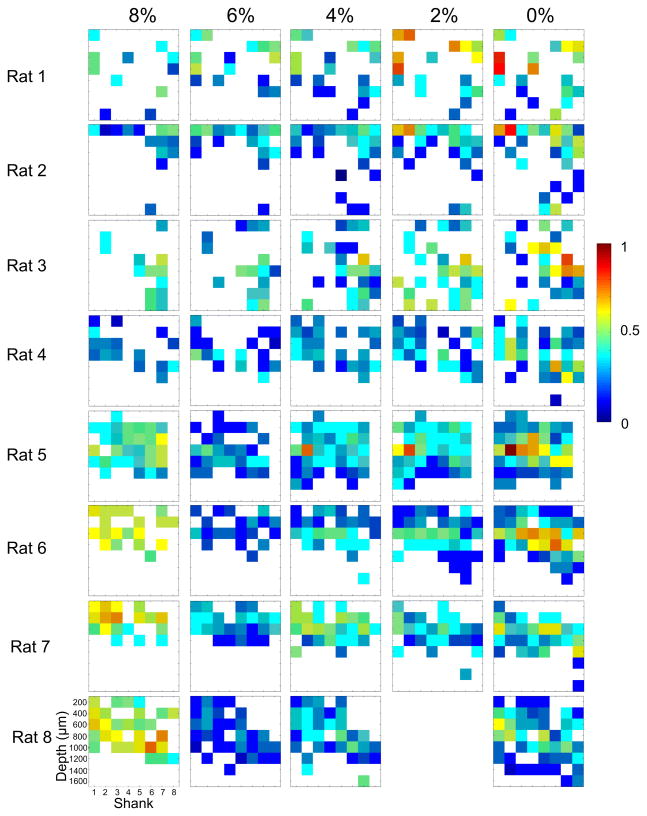
Figure 5 illustrates the nearest neighbor correlation of HI periods in each animal. The temporal pattern of unit activity was substantially different when burst suppression in the LFP was present. Therefore, the data were collapsed into two animal groups; those that had LFP burst suppression at 8% desflurane (rats 5–8) and those that did not (rats 1–4). As shown in Figure 6A, in the range of 6% to 0% desflurane, the correlation of HI periods changed similarly in all animals (t512=8.36, p=0.001, N=529, linear trend, change: –63%). The same was true to the non-bursting group including the 8% level (t201=10.27, p=0.001, N=209, linear trend). A significant group difference in correlation values at 8% desflurane only was present (p<0.05, N=95, T-K). In the LFP burst suppression group, the increase in correlation between 6% and 8% desflurane was 50%.
Figure 5.
Nearest neighbor correlation maps of high-intensity firing (HI) periods at four depths of anesthesia and wakefulness (8% to 0% desflurane) in eight rats. The color of each cell represents the average correlation coefficient of the respective cell with its eight neighbors (fewer neighbors at the array boundaries). Empty cells have no significant correlation. Rats 5–8 displayed burst suppression in the local field potential (LFP) at 8% desflurane that was associated with significantly higher correlation (hypersynchrony) of the HI periods.
Figure 6.
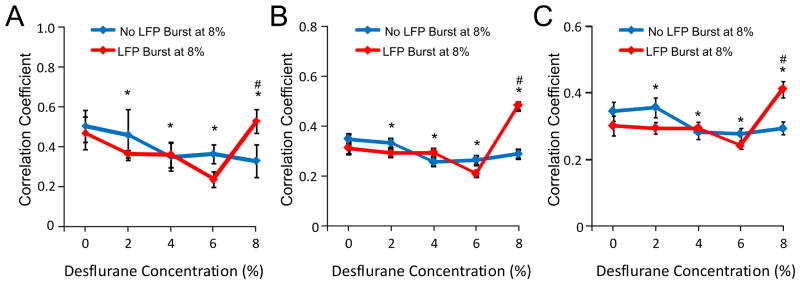
Pair-wise correlation of high-intensity firing (HI) periods from all units as a function of anesthetic state. Data are shown separately for two groups of rats; those that experienced local field potential (LFP) burst suppression at 8% desflurane and those that did not. (A) Correlation among units recorded from neighboring electrode sites (data from Figure 5). (B) Correlation among units recorded at the same electrode shank. (C) Correlation among units recorded from electrode sites at the same cortical depth. In each case, correlation showed significant linear trend at between 6% and 0% desflurane. The correlation coefficients at 8% desflurane were significantly different between the two groups, suggesting hypersynchrony in the presence of burst suppression. *: p<0.001, linear trend across 8%–0% desflurane in the non-bursting group. #: p<0.05 vs. other group at 8% desflurane.
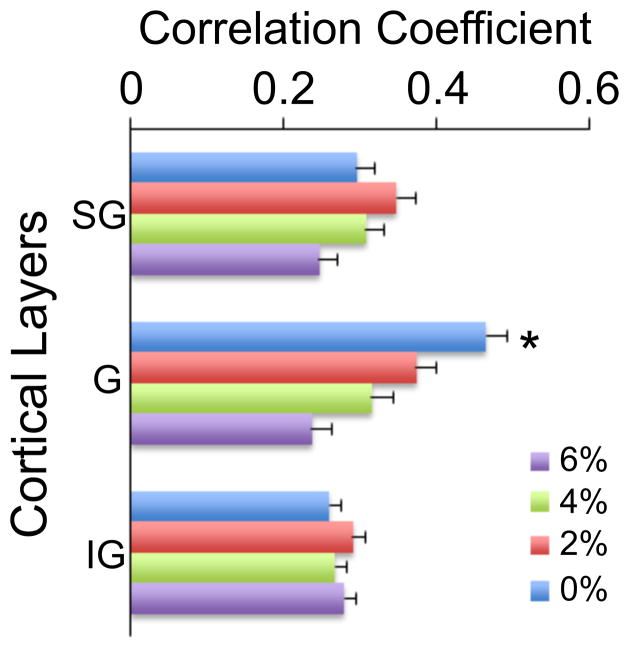
The correlation of HI periods was also examined across or within each recording depth. To this end, all pair-wise correlation of HI periods was first calculated within each electrode shank and then averaged. There was no systematic difference among the electrode shanks, i.e. with position within the cortex (p>0.05, N=256, T-K); therefore the data were collapsed across the shanks. The group results shown in Figure 6B were similar as before, predicting a significant change with anesthetic level in the range of 6%–0% (t186=7.76, p=0.001, N=256, linear trend). Alternatively, all pair-wise correlation coefficients from recording sites at similar cortical depths in each animal were computed and then averaged across the rats. Again, the results were qualitatively similar as before (Figure 6C) (t186=3.55, p=0.001, N=256, linear trend). Although there was no overall difference in correlation as a function of cortical depth, there was a significant interaction term between the depth and desflurane concentration (F7,21=2.147.67, p=0.004, N=256). To follow up, the data were grouped into supragranular (200–400 μm), granular (600–800 μm), and infragranular (1000–1600 μm) domains, and the effect of desflurane concentration was tested in each domain separately. The analysis revealed a significant effect of desflurane in the granular layer only (F7,3=12.72, p=0.001, N=64, RM-ANOVA (Figure 7).
Figure 7.
Correlation of high-intensity firing (HI) periods within supragranular (SG), granular (G), and infragranular (IG) layers from all experiments. A significant concentration-dependent effect of desflurane at 6% to 0% is present in the granular layer only. *: p<0.001, significant linear trend.
Spatial gradient of correlations
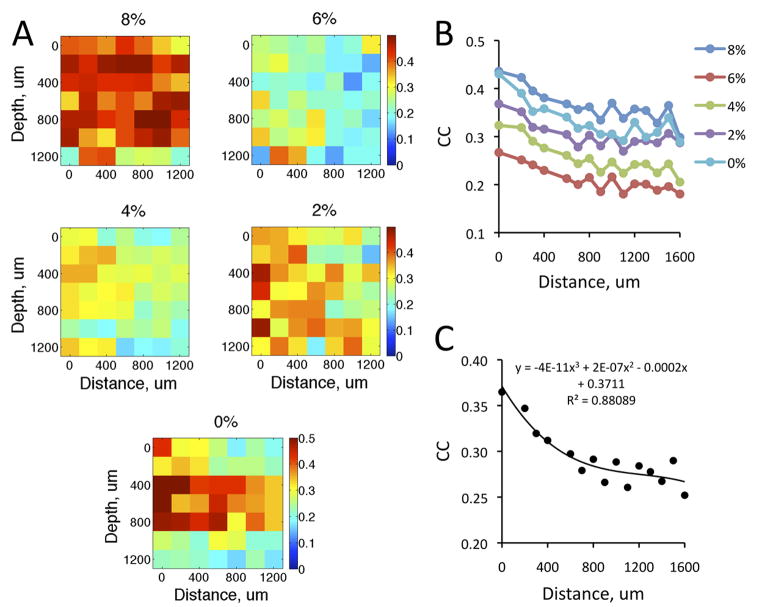
The dependence of HI correlations on the distance of recording sites was examined two different ways. First, the correlation data were analyzed as a function the distance between recording sites at each depth separately. Figure 8A shows the results from eight animals in five conditions. As before, the correlations were quite high at 8% desflurane due to LFP bursting. Because of the paucity of data at every distance, the results were not separated into two groups according to LFP burst suppression. A decrease in correlation with distance was suggested especially at the lighter anesthesia levels and at intermediate recording depths (400–800 μm). Second, we examined the correlation as a function of the Euclidean distance between all pairs of recording sites, i.e., including those between different shanks and different depths. A consistent decrease in correlation values with distance was now evident at all anesthetic conditions and wakefulness (Figure 8B). The decrease in correlation with distance was nonlinear (t14=22.54, p<0.001, N=75, quadratic trend, Figure 8C).
Figure 8.
Correlation of high-intensity firing periods as a function of distance between recording sites at four anesthetic desflurane levels (8%–2%) and wakefulness (0%). (A) Pseudo-color display of correlation coefficients (CC) as a function of distance between electrode shanks at various recording depths in cortex. Values at zero distance indicate CC between units recorded at the same electrode site. (B) CC as a function of the Euclidean distance between all electrode sites. (C) Significant curve fit to data in panel B collapsed across five conditions.
DISCUSSION
Two main observations of the present study are emphasized. First, we found that in a relatively wide range of anesthesia levels, unit activity was substantially intermittent, alternating between high-intensity firing and low-intensity firing patterns that gradually resolved to virtually continuous firing in the wakeful condition. Second, we found that with reduced depth of anesthesia, HI periods became increasingly correlated, both locally and across cortical subregions or across cortical depth. An exception to this trend occurred only when population activity entered a state of burst-suppression in local field potentials.
The fact that neuronal activity can become conspicuously intermittent under the influence of anesthetic agents has been known for some time. Several studies have demonstrated the characteristic alternation of neuronal spiking in the form of UP/DOWN states during urethane or ketamine/xylazine anesthesia (Kasanetz et al., 2002, Clement et al., 2008, Destexhe, 2009). However, this pattern may be different with other anesthetics. For example, volatile anesthetics including isoflurane, sevoflurane, and desflurane primarily potentiate inhibitory neurotransmission at GABAA containing synapses (Rudolph and Antkowiak, 2004, Alkire et al., 2008) that is different from the mechanism of action of urethane or ketamine/xylazine (Harrison and Simmonds, 1985, Hara and Harris, 2002, Sceniak and Maciver, 2006). Moreover, the spatiotemporal patterns of unit activity under shallow, graded anesthetic levels may be substantially different from that seen in deep anesthesia normally associated with the prototypical version of UP/DOWN states. In a former study, Erchova et al found increasing synchronization of multiunit activity under deep urethane anesthesia associated with complete unresponsiveness to painful stimuli (Erchova et al., 2002). This depth of anesthesia is comparable to that with 8% desflurane, at which a paradoxical increase in the correlation of HI periods was observed in the presence of LFP burst-suppression.
Although our HI/LO periods as defined in this work may be perceived analogous to UP/DOWN states (Kasanetz et al., 2002, Clement et al., 2008, Destexhe, 2009), the latter are precisely defined by repetitive spike discharges that occur during transient membrane depolarization. Since we only measured extracellular activity, we conservatively chose to use a different terminology. Likewise, the so-called ON/OFF periods of neuronal populations (Vyazovskiy et al., 2011) were defined by the simultaneous silence of all units of a neuronal population, whereas the HI/LO periods were defined with respect to individual units. While there was a high correlation of HI/LO periods during burst-suppression, this was not typical in lighter states of anesthesia or wakefulness.
In our experiments, we started with the deepest anesthetic level and decremented the anesthetic concentration stepwise to zero. Most studies in the past followed the opposite design, i.e., incrementing the anesthetic dose. It has been suggested that the two protocols may result in slightly different thresholds for specific behavioral and electrophysiological endpoints, indicating the presence of pharmacodynamic hysteresis or “neuronal inertia” (Friedman et al., 2010). Also, neuronal response properties in mouse visual cortex differed between relatively fast wash-in and wash-out periods (5–10 minutes) of isoflurane (Land et al., 2012). However, in preliminary studies we found that with the adopted timeline of anesthetic changes, there was no difference in spike rate or ISI distribution between the increasing and decreasing protocols. Converging to the same neuronal state regardless of the prior history of anesthetic administration was certainly facilitated by the particularly rapid equilibration property of desflurane (Eger and Johnson, 1987), which was in fact the primary reason for its choice in this study.
Because we compared steady-state anesthesia levels and did not record neuronal activity during the transition periods, we cannot say if the changes in HI/LO activity and correlations were continuous or abrupt as a function of changing anesthetic depth. The correlation graphs taken from the five steady state conditions do not suggest an abrupt change at a particular desflurane concentration. Nevertheless, abrupt changes in the correlation of individual unit pairs cannot be excluded. In fact, even during stable anesthesia, spontaneous changes in the level of neuronal activity can sometimes be seen. Land et al (Land et al., 2012) saw a sudden increase in multiunit activity during continuously decreasing isoflurane level. Our current methodology would not reveal such a transition.
Our method of segmentation of the spike trains to HI and LO periods was based on the ISI histogram, somewhat similar to other ISI-based methods (Cocatre-Zilgien and Delcomyn, 1992, Bakkum et al., 2013). This was different from common approaches used to detect spike bursts including the Poisson-surprise method (Palm, 1981, Legendy and Salcman, 1985) or some nonparametric approach (Gourevitch and Eggermont, 2007). For example, the Poisson-surprise method extracts significant bursts in a spike train by comparing the observed interspike intervals to those produced by a random Poisson process. These methods were designed to detect bursts in spike trains assuming continuous firing activity. While this may be favorable under active states, it is not applicable when the ongoing firing pattern is frequently interrupted as often observed in deep anesthesia. In that case, the common detection methods would only further segment the sparsely occurring bursts. Therefore, we identified the HI periods by a critical threshold based on the bimodal ISI histogram. For the LFP, more advanced methods for the estimation of burst suppression probability have now been developed (Chemali et al., 2011) and may be applied in future work in the subject.
To-date, few studies have examined the dose-dependent effect of inhalational anesthetics on the correlation of neuronal activity recorded in multiple cortical depths. Land et al (Land et al., 2012) investigated the effect of isoflurane on spontaneous and stimulus-evoked LFP and unit activity in visual cortex of mice. A slow increase in isoflurane concentration from 0.7% to 2.5% induced a gradual increase of the cross-correlation of multiunit activity recorded at different cortical depths on the same electrode shank. The correlation reached maximum near the onset of burst suppression. Our observations were different in that the correlation of HI periods was lower at deeper than lighter anesthesia except during burst suppression, when the correlation was paradoxically high. The experimental protocol in Land’s study utilized a continuous change in isoflurane, as opposed to steady state levels, that could have made a difference in the results. Also, the lowest level of isoflurane studied was 0.7%, corresponding to approximately 3% desflurane; therefore, a comparison of the results to ours in wakefulness or light anesthesia is not possible. However, a relatively large change in LFP-spike correlation occurred between light anesthesia and wakefulness.
Using a different volatile anesthetic, Wang et al (Wang et al., 2006) studied the effect of halothane at 0.75%, 1.5% and 2.0% steady sate concentrations on the correlation dimension D2 of LFP recorded at different depths of the rat somatosensory cortex. They found that D2 was the highest in cortical layer IV and it was significantly reduced at increasing concentrations of halothane in layers II-IV. The 0.75% halothane is equivalent to about 4.0% desflurane; thus, the corresponding changes at light anesthesia and wakefulness are not known. Nevertheless, the preferential effect of the anesthetic in the middle cortical layers is consistent with our findings in an overlapping anesthetic range.
Recently, the cortical layer-specific effects of isoflurane plus xylazine on spontaneous LFP and multiunit activity (MUA) were examined in a ferret model (Sellers et al., 2013). Isoflurane at 0.5% and 0.75% concentration increased MUA in layer IV of visual cortex but decreased it in superficial and deep layers. Cross-correlation of LFP across cortical depths also decreased similar to the change in correlation of HI firing periods in our study. Cross-correlation of MUA was not determined; thus, a direct comparison of the results was not possible. However, similar to our findings, spike-field coherence was low in wakeful animals and was strongly increased in isoflurane anesthesia. Interestingly, the latter effect was restricted to supragranular and infragranular layers. It remains to be seen if the laminar profile of LFP-spike correlation is similar under desflurane anesthesia.
The present study was limited to measurements in primary visual cortex, therefore an obvious question is whether the results can be generalized to other cortical regions. We previously compared the dynamic spike correlation between visual cortex and parietal cortex at three anesthesia levels with desflurane. We did not see a difference in resting-state correlations between the two regions suggesting that the present findings can probably be generalized to at least extrastriate and parietal cortex. However, more systematic testing with similar grid-type microelectrode arrays as used here will be required to support this preliminary conclusion. In fact, region-specific differences in the responses of LFP and MUA to isoflurane between visual and prefrontal cortex have been recently observed (Sellers et al., 2013). In prefrontal cortex, the laminar changes were rather uniform and the LFP correlations were increased with isoflurane (the opposite to that seen in visual cortex). The occipito-frontal shift in LFP correlation was consistent with the frontal synchronization of low-frequency EEG power in anesthesia (Purdon et al., 2013).
The general significance of the present results is that they lend further insight into the anesthetic modulation of neuronal dynamics in the vicinity of the transition between unconscious and conscious states. As already mentioned, the spatiotemporal fragmentation of cortical neuronal activity has been suggested as an important component of neuronal changes associated with, or even contributing to, the loss of consciousness during induction of propofol anesthesia (Lewis et al., 2012). Here we saw the counterpart of this observation during stepwise emergence from desflurane anesthesia: a graded defragmentation of spiking activity. This defragmentation was reflected by the reduced intermittency of firing and the increased correlation of HI firing periods as the anesthetic was gradually withdrawn. These events have not been studied at finely graded anesthetic levels that closely bracket the unconscious and conscious states. Although the precise definition and independent assessment of these states is challenging, in rodents, the righting reflex has been widely used as a surrogate behavioral index of loss and return of consciousness (Franks, 2008). In prior studies we determined that the righting reflex of rats was lost at an average desflurane concentration of 4.3±0.5% (Imas et al., 2005). Therefore, in the present study, rats were considered operationally unconscious at 6%, and conscious at or below 4% desflurane. However, from a theoretical point view, the state of consciousness may have been altered in a graded manner (Alkire et al., 2008), along with the dose-dependent changes in HI/LO properties and correlations.
It has been proposed that anesthetics may suppress consciousness by one of two mechanisms: by desynchronization, by functionally disconnecting neurons locally and among remote cortical areas, or by hypersynchronization, by reducing the brain’s repertoire to a few stereotypic patterns (Alkire et al., 2008). Seizures and burst-suppression are two examples of the latter. If the magnitude of correlation of the HI periods had any association with the conscious state, then it is surprising why the correlation was quite high during burst-suppression at 8% desflurane when the animals were most certainly unconscious. A major difference is, however, that during burst suppression neuronal activity is highly fragmented and therefore incompatible with a continuous stream of (conscious) information processing. Although burst-suppression in the LFP was not seen at the shallower anesthesia levels (4%–6%), unit activity was still partially fragmented and changed in a graded manner. In contrast, LFP bursts are stereotypic, all-or-none patterns associated with neuronal hypersynchrony. They are inconsistent with the conscious state that depends on an unfragmented stream of specific neuronal firing patterns.
Finally, the dominant neuronal effects of anesthesia in the granular layer now confirmed with multiple volatile anesthetics (Wang et al., 2006, Sellers et al., 2013) suggests that the site of anesthetic modulation of correlated unit activity are the cells and synapses along the specific thalamocortical input. A disruption of thalamic information transfer, i.e., turning off the “thalamic switch”, was once proposed as a major mechanistic candidate of anesthetic-induced unconsciousness (Alkire et al., 2000). However, it is equally possible that the critical targets of anesthetic modulation are postsynaptic cells of the neocortex (Hentschke et al., 2005, Alkire et al., 2008).
Conclusions
In summary, our results demonstrate that a graded increase in the spike rate, duration of high firing periods, and their correlation is associated with the graded recovery from anesthesia to wakefulness. The temporal defragmentation of neuronal activity is not all-or-none, but occurs gradually as the anesthetic is withdrawn. This process may play a role in the recovery of consciousness from the anesthetized state.
The spatiotemporal pattern of cortical unit activity is fragmented in deep anesthesia.
During emergence, high-intensity firing periods become correlated locally and across remote sites.
Recovery of consciousness is accompanied by spatiotemporal defragmentation of unit activity.
Hypersynchrony of units occurs in deep anesthesia during LFP burst suppression only.
Acknowledgments
Research reported in this publication was supported by the National Institute of General Medical Sciences of the National Institutes of Health under Award Number R01-GM056398 (to AGH) and by Pre-doctoral Graduate Assistance in Areas of National Need (GAANN) fellowship from the Department of Education, Washington, DC (to JAV).
Footnotes
The content is solely the responsibility of the authors and does not necessarily represent the official views of the National Institutes of Health.
Publisher's Disclaimer: This is a PDF file of an unedited manuscript that has been accepted for publication. As a service to our customers we are providing this early version of the manuscript. The manuscript will undergo copyediting, typesetting, and review of the resulting proof before it is published in its final citable form. Please note that during the production process errors may be discovered which could affect the content, and all legal disclaimers that apply to the journal pertain.
References
- Alkire MT, Haier RJ, Fallon JH. Toward a unified theory of narcosis: brain imaging evidence for a thalamocortical switch as the neurophysiologic basis of anesthetic- induced unconsciousness. Conscious Cogn. 2000;9:370–386. doi: 10.1006/ccog.1999.0423. [DOI] [PubMed] [Google Scholar]
- Alkire MT, Hudetz AG, Tononi G. Consciousness and anesthesia. Science. 2008;322:876–880. doi: 10.1126/science.1149213. [DOI] [PMC free article] [PubMed] [Google Scholar]
- Bakkum DJ, Radivojevic M, Frey U, Franke F, Hierlemann A, Takahashi H. Parameters for burst detection. Front Comput Neurosci. 2013;7:193. doi: 10.3389/fncom.2013.00193. [DOI] [PMC free article] [PubMed] [Google Scholar]
- Brown EN, Lydic R, Schiff ND. General anesthesia, sleep, and coma. N Engl J Med. 2010;363:2638–2650. doi: 10.1056/NEJMra0808281. [DOI] [PMC free article] [PubMed] [Google Scholar]
- Chemali JJ, Wong KF, Solt K, Brown EN. A state-space model of the burst suppression ratio. Conf Proc IEEE Eng Med Biol Soc. 2011;2011:1431–1434. doi: 10.1109/IEMBS.2011.6090354. [DOI] [PMC free article] [PubMed] [Google Scholar]
- Clement EA, Richard A, Thwaites M, Ailon J, Peters S, Dickson CT. Cyclic and sleep-like spontaneous alternations of brain state under urethane anaesthesia. PLoS One. 2008;3:e2004. doi: 10.1371/journal.pone.0002004. [DOI] [PMC free article] [PubMed] [Google Scholar]
- Cocatre-Zilgien JH, Delcomyn F. Identification of bursts in spike trains. J Neurosci Methods. 1992;41:19–30. doi: 10.1016/0165-0270(92)90120-3. [DOI] [PubMed] [Google Scholar]
- Destexhe A. Self-sustained asynchronous irregular states and Up-Down states in thalamic, cortical and thalamocortical networks of nonlinear integrate-and-fire neurons. J Comput Neurosci. 2009;27:493–506. doi: 10.1007/s10827-009-0164-4. [DOI] [PubMed] [Google Scholar]
- Destexhe A, Hughes SW, Rudolph M, Crunelli V. Are corticothalamic ‘up’ states fragments of wakefulness? Trends Neurosci. 2007;30:334–342. doi: 10.1016/j.tins.2007.04.006. [DOI] [PMC free article] [PubMed] [Google Scholar]
- Detsch O, Kochs E, Siemers M, Bromm B, Vahle-Hinz C. Increased responsiveness of cortical neurons in contrast to thalamic neurons during isoflurane-induced EEG bursts in rats. Neurosci Lett. 2002;317:9–12. doi: 10.1016/s0304-3940(01)02419-3. [DOI] [PubMed] [Google Scholar]
- Eger EI, 2nd, Johnson BH. Rates of awakening from anesthesia with I-653, halothane, isoflurane, and sevoflurane: a test of the effect of anesthetic concentration and duration in rats. Anesth Analg. 1987;66:977–982. [PubMed] [Google Scholar]
- Erchova IA, Lebedev MA, Diamond ME. Somatosensory cortical neuronal population activity across states of anaesthesia. Eur J Neurosci. 2002;15:744–752. doi: 10.1046/j.0953-816x.2002.01898.x. [DOI] [PubMed] [Google Scholar]
- Fee MS, Mitra PP, Kleinfeld D. Automatic sorting of multiple unit neuronal signals in the presence of anisotropic and non-Gaussian variability. J Neurosci Methods. 1996;69:175–188. doi: 10.1016/S0165-0270(96)00050-7. [DOI] [PubMed] [Google Scholar]
- Franks NP. General anaesthesia: from molecular targets to neuronal pathways of sleep and arousal. Nat Rev Neurosci. 2008;9:370–386. doi: 10.1038/nrn2372. [DOI] [PubMed] [Google Scholar]
- Friedman EB, Sun Y, Moore JT, Hung HT, Meng QC, Perera P, Joiner WJ, Thomas SA, Eckenhoff RG, Sehgal A, Kelz MB. A conserved behavioral state barrier impedes transitions between anesthetic-induced unconsciousness and wakefulness: evidence for neural inertia. PLoS One. 2010;5:e11903. doi: 10.1371/journal.pone.0011903. [DOI] [PMC free article] [PubMed] [Google Scholar]
- Gourevitch B, Eggermont JJ. A nonparametric approach for detection of bursts in spike trains. J Neurosci Methods. 2007;160:349–358. doi: 10.1016/j.jneumeth.2006.09.024. [DOI] [PubMed] [Google Scholar]
- Hara K, Harris RA. The anesthetic mechanism of urethane: the effects on neurotransmittergated ion channels. Anesth Analg. 2002;94:313–318. doi: 10.1097/00000539-200202000-00015. table of contents. [DOI] [PubMed] [Google Scholar]
- Harrison NL, Simmonds MA. Quantitative studies on some antagonists of N-methyl D-aspartate in slices of rat cerebral cortex. Br J Pharmacol. 1985;84:381–391. doi: 10.1111/j.1476-5381.1985.tb12922.x. [DOI] [PMC free article] [PubMed] [Google Scholar]
- Hentschke H, Schwarz C, Antkowiak B. Neocortex is the major target of sedative concentrations of volatile anaesthetics: strong depression of firing rates and increase of GABAA receptor-mediated inhibition. Eur J Neurosci. 2005;21:93–102. doi: 10.1111/j.1460-9568.2004.03843.x. [DOI] [PubMed] [Google Scholar]
- Hudetz AG, Vizuete JA, Imas OA. Desflurane selectively suppresses long-latency cortical neuronal response to flash in the rat. Anesthesiology. 2009;111:231–239. doi: 10.1097/ALN.0b013e3181ab671e. [DOI] [PMC free article] [PubMed] [Google Scholar]
- Hudetz AG, Vizuete JA, Pillay S. Differential effects of isoflurane on high-frequency and low-frequency gamma oscillations in the cerebral cortex and hippocampus in freely moving rats. Anesthesiology. 2011;114:588–595. doi: 10.1097/ALN.0b013e31820ad3f9. [DOI] [PMC free article] [PubMed] [Google Scholar]
- Imas OA, Ropella KM, Ward BD, Wood JD, Hudetz AG. Volatile anesthetics disrupt frontal-posterior recurrent information transfer at gamma frequencies in rat. Neurosci Lett. 2005;387:145–150. doi: 10.1016/j.neulet.2005.06.018. [DOI] [PubMed] [Google Scholar]
- Kasanetz F, Riquelme LA, Murer MG. Disruption of the two-state membrane potential of striatal neurones during cortical desynchronisation in anaesthetised rats. J Physiol. 2002;543:577–589. doi: 10.1113/jphysiol.2002.0024786. [DOI] [PMC free article] [PubMed] [Google Scholar]
- Land R, Engler G, Kral A, Engel AK. Auditory evoked bursts in mouse visual cortex during isoflurane anesthesia. PLoS One. 2012;7:e49855. doi: 10.1371/journal.pone.0049855. [DOI] [PMC free article] [PubMed] [Google Scholar]
- Lee U, Mashour GA, Kim S, Noh GJ, Choi BM. Propofol induction reduces the capacity for neural information integration: implications for the mechanism of consciousness and general anesthesia. Conscious Cogn. 2009;18:56–64. doi: 10.1016/j.concog.2008.10.005. [DOI] [PubMed] [Google Scholar]
- Legendy CR, Salcman M. Bursts and recurrences of bursts in the spike trains of spontaneously active striate cortex neurons. J Neurophysiol. 1985;53:926–939. doi: 10.1152/jn.1985.53.4.926. [DOI] [PubMed] [Google Scholar]
- Lewis LD, Weiner VS, Mukamel EA, Donoghue JA, Eskandar EN, Madsen JR, Anderson WS, Hochberg LR, Cash SS, Brown EN, Purdon PL. Rapid fragmentation of neuronal networks at the onset of propofol-induced unconsciousness. Proc Natl Acad Sci U S A. 2012;109:E3377–3386. doi: 10.1073/pnas.1210907109. [DOI] [PMC free article] [PubMed] [Google Scholar]
- Palm G. Evidence, information, and surprise. Biol Cybern. 1981;42:57–68. doi: 10.1007/BF00335160. [DOI] [PubMed] [Google Scholar]
- Purdon PL, Pierce ET, Mukamel EA, Prerau MJ, Walsh JL, Wong KF, Salazar-Gomez AF, Harrell PG, Sampson AL, Cimenser A, Ching S, Kopell NJ, Tavares-Stoeckel C, Habeeb K, Merhar R, Brown EN. Electroencephalogram signatures of loss and recovery of consciousness from propofol. Proc Natl Acad Sci U S A. 2013;110:E1142–1151. doi: 10.1073/pnas.1221180110. [DOI] [PMC free article] [PubMed] [Google Scholar]
- Rudolph U, Antkowiak B. Molecular and neuronal substrates for general anaesthetics. Nat Rev Neurosci. 2004;5:709–720. doi: 10.1038/nrn1496. [DOI] [PubMed] [Google Scholar]
- Sceniak MP, Maciver MB. Cellular actions of urethane on rat visual cortical neurons in vitro. J Neurophysiol. 2006;95:3865–3874. doi: 10.1152/jn.01196.2005. [DOI] [PubMed] [Google Scholar]
- Sellers KK, Bennett DV, Hutt A, Frohlich F. Anesthesia differentially modulates spontaneous network dynamics by cortical area and layer. J Neurophysiol. 2013;110:2739–2751. doi: 10.1152/jn.00404.2013. [DOI] [PubMed] [Google Scholar]
- Shimazaki H, Shinomoto S. A method for selecting the bin size of a time histogram. Neural Comput. 2007;19:1503–1527. doi: 10.1162/neco.2007.19.6.1503. [DOI] [PubMed] [Google Scholar]
- Villeneuve C, Caudrillier A, Ordener C, Pizzinat N, Parini A, Mialet-Perez J. Dose-dependent activation of distinct hypertrophic pathways by serotonin in cardiac cells. Am J Physiol Heart Circ Physiol. 2009;297:H821–828. doi: 10.1152/ajpheart.00345.2009. [DOI] [PubMed] [Google Scholar]
- Vizuete JA, Pillay S, Diba K, Ropella KM, Hudetz AG. Monosynaptic functional connectivity in cerebral cortex during wakefulness and under graded levels of anesthesia. Frontiers in Integrative Neuroscience. 2012;6 doi: 10.3389/fnint.2012.00090. [DOI] [PMC free article] [PubMed] [Google Scholar]
- Vyazovskiy VV, Olcese U, Hanlon EC, Nir Y, Cirelli C, Tononi G. Local sleep in awake rats. Nature. 2011;472:443–447. doi: 10.1038/nature10009. [DOI] [PMC free article] [PubMed] [Google Scholar]
- Wang ZH, Chang MH, Yang JW, Sun JJ, Lee HC, Shyu BC. Layer IV of the primary somatosensory cortex has the highest complexity under anesthesia and cortical complexity is modulated by specific thalamic inputs. Brain Res. 2006;1082:102–114. doi: 10.1016/j.brainres.2006.01.070. [DOI] [PubMed] [Google Scholar]


