Abstract
Tyrosine phosphorylation (Tyr-P) of focal adhesion kinase (FAK) regulates FAK activation. Phosphorylated FAK Tyr 397 binds Src family kinases (Src), which in turn directly phosphorylate FAK Tyr 576/577 to produce maximal FAK enzymatic activity. CB1 cannabinoid receptors (CB1) are abundantly expressed in the nervous system and influence FAK activation by presently unknown mechanisms. The current investigation determined CB1-stimulated maximal FAK catalytic activity is mediated by Gi/o proteins in N18TG2 neuronal cells, and that G12/13 regulation of Rac1 and RhoA occurs concomitantly. Immunoblotting analyses using antibodies against FAK phospho-Tyr 397 and phospho-Tyr 576/577 demonstrated the time-course of CB1-stimulated FAK 576/577 Tyr-P occurred in three phases: Phase I (0-2 min) maximal Tyr-P, Phase II (5-20 min) rapid decline in Tyr-P, and Phase III (>20 min) plateau in Tyr-P at submaximal levels. In contrast, FAK 397 Tyr-P was monophasic and significantly lower in magnitude. FAK 397 Tyr-P and Phase I FAK 576/577 Tyr-P involved protein tyrosine phosphatase (PTP1B, Shp1/Shp2)-mediated Src activation, Protein Kinase A (PKA) inhibition, and integrin activation. Phase I maximal FAK 576/577 Tyr-P also required cooperative signaling between receptor tyrosine kinases (RTKs) and integrins. The integrin antagonist RGDS peptide, Flk-1 vascular endothelial growth factor receptor (VEGFR) antagonist SU5416, and epidermal growth factor receptor (EGFR) antagonist AG 1478 blocked Phase I FAK 576/577 Tyr-P. CB1 agonists failed to stimulate FAK Tyr-P in the absence of integrin activation upon suspension in serum-free culture media. In contrast, cells grown on the integrin ligands fibronectin and laminin displayed increased FAK 576/577 Tyr-P that was augmented by CB1 agonists and blocked by the Src inhibitor PP2 and Flk-1 VEGFR antagonist SU5416. Taken together, these studies have identified a complex integrative pathway utilized by CB1 to stimulate maximal FAK 576/577 Tyr-P in neuronal cells.
Keywords: CB1 receptor, Integrin, Receptor Tyrosine Kinase, FAK, PTP1B, Shp1/Shp2
1. Introduction
CB1 receptors are predominantly expressed in the nervous system and mediate many of the neuronal effects produced by the major psychoactive component of Cannabis sativa Δ9-THC, the endocannabinoids anandamide and 2-arachidonoylglycerol (2-AG), and synthetic cannabinoid drugs (e.g., CP55940, WIN55212-2) (see [1] for review). CB1 is a G protein-coupled receptor (GPCR) that associates with pertussis toxin-sensitive Gi/o proteins to regulate a variety of signal transduction pathways including inhibition of adenylyl cyclase, inhibition of L-, N-, and P/Q-type Ca2+ channels, induction of immediate early gene expression, stimulation of nitric oxide production, activation of members of the mitogen-activated protein kinase (MAPK) family, and activation of FAK [1-2]. FAK is a ubiquitously expressed nonreceptor protein tyrosine kinase that localizes to multi-protein complexes found at the cell membrane called focal adhesions (FAs) in which integrins link the actin cytoskeleton to proteins of the extracellular matrix (ECM) [3]. Activated FAK mediates many of the downstream signaling events emanating from FAs that regulate cell proliferation, survival, migration, and adhesion [3-4]. FAK activation occurs through Tyr-P and begins with FAK phosphorylation at Tyr 397 which creates a high affinity binding site for Src that then phosphorylates FAK on five additional Tyr residues (Tyr 407, Tyr 576/577, Tyr 861, Tyr 925) [5-7]. Tyr 576/577 are located in the activation loop of the FAK central catalytic domain and their phosphorylation is required for maximal FAK catalytic activity. Studies have shed minimal light on the cellular mechanisms that regulate CB1-mediated FAK activation which appears to involve integrin activation, PKA inhibition, and Src activation [8-10]. During development of the central nervous system, endocannabinoid signaling networks regulate proliferation, migration, specification, and survival of neural progenitors [11-12]. Given the crucial role of FAK in these biological processes, it is important to gain a better understanding of the cellular and molecular mechanisms that regulate CB1-FAK signaling pathways in neuronal cells [4].
The aim of the present study was to investigate the signaling pathways that regulate CB1-stimulated maximal FAK catalytic activation in neuronal N18TG2 cells that express endogenous CB1 receptors. To accomplish this, immunoblotting analyses were conducted using phosphorylation site-specific antibodies against FAK Tyr 576/577 and Tyr 397. Our results revealed the time-course of CB1-mediated FAK 397 and 576/577 Tyr-P are markedly different in N18TG2 cells. FAK 576/577 Tyr-P occurred in three phases: Phase I (0-2 min) involved maximal Tyr-P, Phase II (5-20 min) involved a rapid decline in Tyr-P, and Phase III (>20 min) involved a plateau in Tyr-P at submaximal levels. In contrast, FAK 397 Tyr-P was monophasic and significantly lower in magnitude. CB1-mediated FAK 397 Tyr-P and Phase I FAK 576/577 Tyr-P involved protein tyrosine phosphatase (PTP1B, Shp1/Shp2)-mediated Src activation, PKA inhibition, integrin activation, and were adhesion-dependent. Phase I FAK 576/577 Tyr-P also involved cooperative signaling between RTKs (Flk-1 VEGFRs, EGFRs) and integrins. These studies have identified a novel cellular mechanism by which CB1 induces maximal FAK enzymatic activity in neuronal cells that involves crosstalk between CB1, RTKs, and integrins.
2. Materials and Methods
2.1. Materials
Reagents were purchased from Sigma Chemical Company (St. Louis, MO, USA), unless otherwise stated. CP55940 ((—)-cis-3R-[2-hydroxy-4-(1,1-dimethylheptyl)phenyl]-trans−4R−3(3-hydroxypropyl)-1R cyclohexanol) and SR141716A (N-(piperidin-1yl)-5-(4-chlorophenyl)-1-(2,4-dichlorophenyl)-4-methyl-H-pyrazole-3-carboxamide) were provided by the National Institute of Drug Abuse drug supply program. Methanandamide [(R)-(+)-Arachidonyl-1’-hydroxy-2’-propylamide], 2-AG, WIN55212-2, and tetrahydrolipstatin (THL, Orlistat) were from Cayman Chemical (Ann Arbor, MI, USA). Acrylamide, N,N,N’,N-tetramethylethylene diamine (TEMED), and sodium dodecyl sulfate (SDS) were from BioRad Laboratories, Inc. (Hercules, CA, USA). Integrin 5 siRNA (mouse), control siRNA-A, anti-integrin β1 (M-106), anti-p-FAK (2D11), anti-integrin 7 (H-40), anti-p-FAK (Tyr 576/577), anti-FAK (H-1), anti-FAK (A-17), anti-GAPDH (A-3), and anti-G12/13 (H-300) were from Santa Cruz Biotechnology (Santa Cruz, CA, USA). Anti-integrin 5 and anti-integrin 6 were from Cell Signaling Technology (Danvers, MA, USA). VEGF and EGF were from R&D Systems (Minneapolis, MN, USA). AG 1478, SU5416, PP2, NSC87877 (Shp1/Shp2 inhibitor), Sp-cAMPS (adenosine 3’,5’-cyclic phosphorothioate-Sp), and PTP1B inhibitor were from EMD Biosciences (San Diego, CA, USA). RGDS and RGES peptides were from Abbiotec, LLC (San Diego, CA, USA). Anti-Rac1, anti-RhoA, and laminin (mouse) were from BD Biosciences (Bedford, MA, USA). Odyssey Blocking buffer, nitrocellulose membranes, IRDye 800CW goat anti-rabbit secondary antibody, and IRDye 680CW goat anti-mouse secondary antibody were from LI-COR Biosciences (Lincoln, NE, USA). BD Falcon 6-well multiwell plates were from VWR International (Suwanee, GA, USA).
2.2. Cell culture
N18TG2 neuroblastoma cells (passage numbers 25–50) were maintained at 37°C under a 5% CO2 atmosphere in Dulbecco's Modified Eagle's Medium (DMEM):Ham's F-12 (1:1) complete with GlutaMax, sodium bicarbonate, and pyridoxine–HCl, supplemented with penicillin (100 units/ml) and streptomycin (100 μg/ml) (Gibco Life Technologies, Gaithersburg, MD, USA) and 10% heat-inactivated bovine serum (JRH Biosciences, Lenexa, KS, USA). An aliquot of cannabinoid drug stocks (stored at -20°C as 10 mM solutions in ethanol) or ethanol (control) was air-dried under sterile conditions in trimethylsilyl-coated glass test tubes and taken up in 100 volumes of 5 mg/ml fatty acid-free bovine serum albumin (BSA) and serially diluted before being added to cells. Where indicated, N18TG2 cells were pretreated with receptor antagonists or other inhibitors prior to addition of CB1 agonists. Pertussis toxin (List Biological Laboratories, Campbell, CA, USA) was added to cells (100 ng/mL) for 16-20 h before addition of agonists.
2.3. Immunoblot analysis
Because N18TG2 cells can produce 2-AG [13], cells at 90% confluency were serum-starved (20-24 h) and pretreated with the diacylglycerol lipase (DAGL) inhibitor THL (1 μM, 2 h) prior to stimulation with cannabinoid agonists. Following indicated drug treatments, cells were harvested with PBS-EDTA (2.7 mM KCl, 138 mM NaCl, 10.4 mM glucose, 1.5 mM KH2PO4, 8 mM Na2HPO4, 0.625 mM EDTA, pH 7.4). Cells were resuspended for 20 min on ice in cold NP-40 lysis buffer that contained 10 mM NaHEPES, pH 7.9, 1.5 mM MgCl2, 10 mM KCl, 100 μM EDTA, 250 µM Na orthovanadate, 1 mM Na fluoride, 1% NP-40, 1 μM DTT, and a protease inhibitor cocktail (EMD Biosciences, La Jolla, CA, USA) with broad specificity for the inhibition of aspartic, cysteine, and serine proteases as well as aminopeptidases. Lysates were clarified by centrifugation at 20,000 g at 4°C and supernatants were stored at −80°C. Protein concentrations were determined using the Bradford method with BSA as the standard [14]. Lysates were taken up in Laemmli's sample buffer (62.5 mM Tris-HCl, pH 6.8, 2% SDS, 10% glycerol, 0.002% bromophenol blue, 100 mM DTT) and heated at 95°C for 5 min. Cell lysates were resolved by 7.5% SDS-PAGE gels run at 125 volts for 90 min. Gels were pre-equilibrated in Towbins buffer (25 mM Tris Base, 192 mM glycine, and 20% methanol; pH 8.3) for 30 min and proteins were transferred to nitrocellulose membranes for 5 h at 35 volts on ice using a BioRad Trans-Blot Cell. Blots were rinsed one time with Tris-buffered saline (TBS, 20 mM Tris–HCl, pH 7.4, 137 mM NaCl), blocked with Odyssey Blocking buffer, and then incubated with primary antibodies overnight at 4°C. Blots were washed four times with TBST (TBS containing 0.1% Tween-20), incubated with IRDye 800CW goat anti-rabbit or IRDye 680CW goat anti-mouse secondary antibodies (1:15,000) for 1 h at room temperature, followed by three washes with TBST and one wash with TBS. Immunoblots were imaged and bands were quantified by densitometry using Odyssey Infrared Imaging System software (LI-COR Biosciences, Lincoln, NE, USA).
2.4. RhoA and Rac1 activity assays
GST-fusion proteins that contained the isolated GTP-dependent binding domains of the Rac1 effector PAK1 or the RhoA effector rhotekin were a generous gift from Dr. Keith Burridge (University of North Carolina at Chapel Hill) or were purchased from Cytoskeleton Inc. (Denver, CO, USA). RhoA and Rac1 activities were measured as described previously [15-16]. Briefly, N18TG2 cells were lysed following treatment with cannabinoid agonists. Cell lysates were clarified by centrifugation and were incubated at 4°C with GST-PAK1-binding domain (PBD) fusion proteins or GST-rhotekin-binding domain (RBD) fusion proteins that were immobilized on glutathione-Sepharose beads. GST-RBD fusion proteins were used to specifically affinity-precipitate activated RhoA-GTP from cell lysates, while GST-PBD fusion proteins were used to specifically affinity-precipitate Rac1-GTP from cell lysates. Samples were washed with cold lysis buffer and precipitated proteins (active GTP-bound RhoA or Rac1) and cell lysates (total RhoA or Rac1) were run on 15% SDS-PAGE gels. Proteins were transferred to PVDF membranes and blots were stained with anti-RhoA or anti-Rac1 primary antibodies. Blots were then developed with horseradish peroxidase- coupled secondary antibodies and an enhanced chemiluminescence detection kit (Pierce, Rockford, IL USA). Bands were quantified using ImageJ software (National Institutes of Health, Bethesda, MD, USA). To compare GTP-bound RhoA or Rac1 levels between treatment groups, levels were normalized to total RhoA or Rac1 levels respectively.
2.5. G12/13 coimmunoprecipitation with CB1
N18TG2 cells were serum-starved (16 h) prior to treatment with cannabinoid agonists. Cells were then washed in ice-cold PBS and lysed on ice with NP-40 lysis buffer plus protease inhibitor cocktail for 5 min. Lysates were clarified by centrifugation at 12,000 rpm at 4°C for 5 min. Proteins were immunoprecipitated at 4°C with antibodies specific for CB1 [17] and collected with protein A-Sepharose beads. The immune complexes were precipitated by centrifugation, washed with ice-cold NP-40 lysis buffer, and boiled in Laemmli's sample buffer. Following centrifugation, supernatants were collected and resolved by SDS-PAGE. Proteins were transferred to PVDF membranes, stained with anti-G12/13 primary antibodies, and developed with horseradish peroxidase-coupled secondary antibodies with enhanced chemiluminescence. Bands were quantified using ImageJ software.
2.6. Culture of N18TG2 cells on the extracellular matrix proteins fibronectin and laminin
BD Falcon 6-well multiwell plates were coated with either laminin (11.35 g/well) or fibronectin (10 g/well) for 2 h at 37°C. Material was aspirated from each well and plates were allowed to air dry for 1 h at room temperature. N18TG2 cells at 90% confluency were serum-starved (20-24 h) and harvested with PBS-EDTA. Cells (8 x 10⁵) were either suspended in serum-free media for 30 min at 37°C, 5% CO2 or plated on fibronectin or laminin for 30 min in serum-free media at 37°C, 5% CO2. Following drug treatments, cells were harvested with PBS-EDTA, lysed, and lysates were used in immunoblotting experiments.
2.7. α5 integrin RNA-mediated interference
N18TG2 cells were transfected with 150 nM 5 integrin-specfic siRNA (mouse) or negative control siRNA-A using siRNA transfection reagent according to the manufacturer’s protocol (Santa Cruz Biotechnology, Santa Cruz, CA, USA). Negative control siRNA is a non-targeting siRNA that was used to verify the accuracy of 5 integrin-specific siRNA and was included in every siRNA experiment. In brief, N18TG2 cells (2 x 10⁵ cells/well) were plated on BD Falcon 6-well multiwell plates 24 h before transfection. Cells were then transfected with no siRNA (mock transfection), 5 integrin-specific siRNA (150 nM), or negative control siRNA (150 nM) for 6 h at 37°C, 5% CO2. Following transfections, cells were cultured in normal growth medium for 48 h and then serum-starved for 24 h prior to incubation with or without CB1 agonists. Following drug treatments, cells were harvested with PBS-EDTA, lysed, and lysates were used in immunoblotting experiments.
2.8. Statistical analysis
Graphs and statistical analyses were generated using GraphPad Prism V software (La Jolla, CA, USA). Data were compared using the unpaired Student's t-test.
3. RESULTS
3.1. The time-course of CB1-stimulated FAK phosphorylation at tyrosines 397 and 576/577 differ in N18TG2 cells
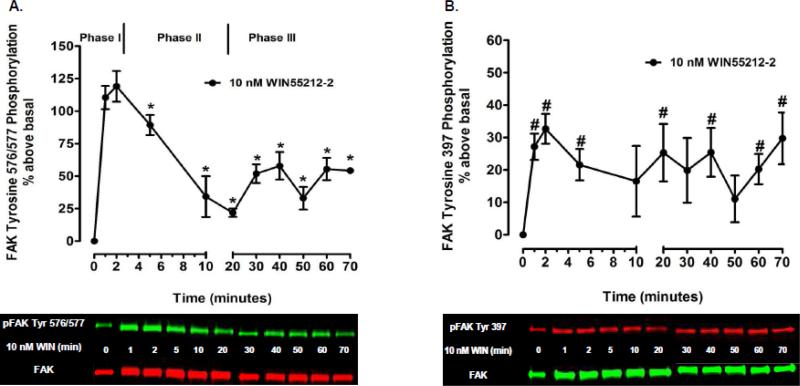
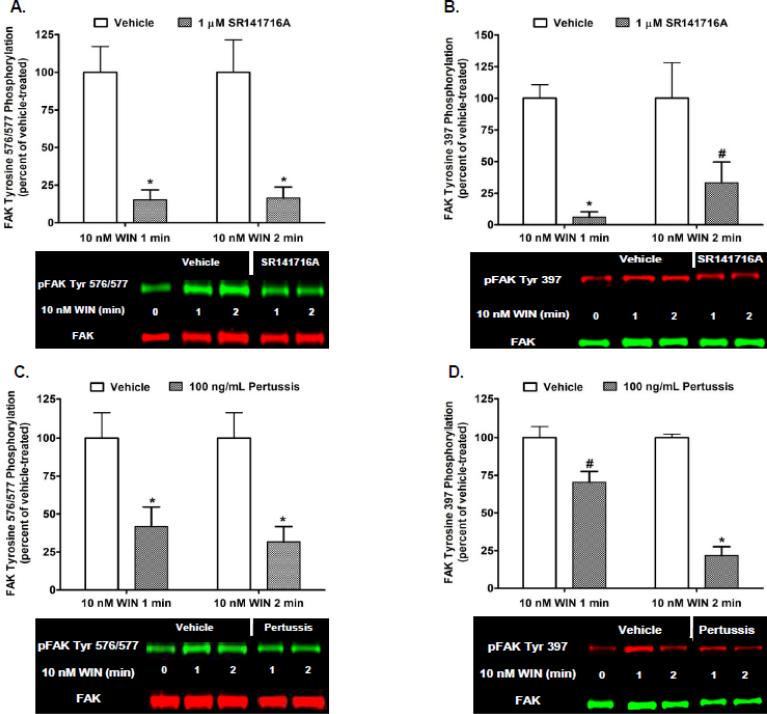
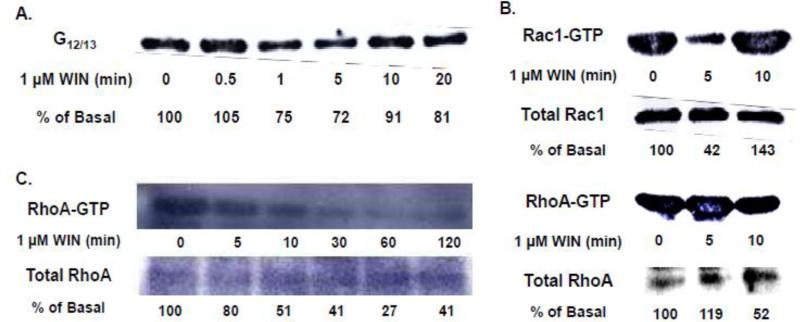
Kinetic analysis revealed the time-course and magnitude of CB1-stimulated FAK phosphorylation at Tyr 397 differs from Tyr 576/577 in N18TG2 cells (Fig. 1). CB1-stimulated FAK 576/577 Tyr-P was time-dependent and occurred in three phases. The synthetic CB1 agonist WIN55212-2 (0.01 µM) produced a robust and transient increase in FAK 576/577 Tyr-P that reached maximal levels in 1 to 2 min (Phase I), declined to a near basal level by 20 min (Phase II), and plateaued at submaximal levels after 20 min (Phase III) (Fig. 1A). In contrast, WIN55212-2-stimulated FAK 397 Tyr-P was monophasic and exhibited sustained low levels of Tyr-P that were significantly less than WIN55212-2-stimulated FAK 576/577 Tyr-P (Fig. 1B). We next sought to determine the cellular mechanisms that regulate Phase I CB1-stimulated maximal FAK 576/577 Tyr-P. Since FAK 576/577 Tyr-P is dependent on the phosphorylation state of Tyr 397, we also examined the cellular mechanisms that regulate FAK 397 Tyr-P. Immunoblotting analysis revealed the CB1 antagonist SR141716A blocked WIN55212-2-stimulated FAK 397 Tyr-P and Phase I WIN55212-2-stimulated FAK 576/577 Tyr-P indicating these are both CB1-dependent events in N18TG2 cells (Fig. 2A,B). Pretreatment with pertussis toxin partially inhibited the effect of WIN55212-2 on Phase I FAK 576/577 Tyr-P (1 min 58.17% ± 12.82 inhibition; 2 min 68.29% ± 10.07 inhibition), as well as WIN55212-2-stimulated FAK 397 Tyr-P (1 min 29.65% ± 7.20 inhibition; 2 min 78.29% ± 5.82 inhibition) which indicates both residues require CB1 stimulation of pertussis toxin-sensitive Gi/o proteins, as well as pertussis toxin-insensitive G proteins (Fig. 2C,D). To account for non-Gi/o effects, we examined whether CB1 interacts with G12/13 proteins in N18TG2 cells using coimmunoprecipitation assays (Fig. 3A). The level of G12/13 proteins associated with CB1 decreased by approximately 28% during Phase I WIN55212-2-stimulated maximal FAK 576/577 Tyr-P, but returned to near basal levels during Phase II (Fig. 3A). G12/13 proteins couple many GPCRs to the activation of Rho family GTPases [18]. Pull-down assays of activated GTP-bound Rho GTPases showed that CB1 activation triggered a change in active GTP-bound RhoA and Rac1 levels in N18TG2 cells (Fig. 3B,C). Active GTP-bound Rac1 levels had decreased by approximately 58% by the onset of Phase II WIN55212-2-stimulated FAK 576/577 Tyr-P, but then increased to greater than basal levels by the middle of Phase II (Fig. 3B). In contrast, active GTP-bound RhoA was reduced by approximately 50% during Phase II WIN55212-2-stimulated FAK 576/577 Tyr-P, and was reduced by 60-70% during Phase III (Fig. 3B,C).
Fig. 1.
Time-course analysis of CB1-stimulated FAK phosphorylation at tyrosines 397 and 576/577 in N18TG2 cells. Cells were treated with 0.01 M WIN55212-2 (WIN) at 37°C for the indicated times. Immunoblot analysis was performed and data are reported as mean ± SEM of the % change over basal (A) pFAK tyrosine 576/577 levels and (B) pFAK tyrosine 397 levels (normalized to total FAK at each time point) from four separate experiments. * indicates significantly different from pFAK tyrosine 576/577 levels at 2 min (p < 0.05 Student's t-test). # indicates significantly different from basal pFAK tyrosine 397 levels at time = 0 (p < 0.05 Student's t-test).
Fig. 2.
Cannabinoid-stimulated FAK phosphorylation at tyrosines 397 and 576/577 is mediated by CB1 receptors and Gi/o proteins in N18TG2 cells. Cells were pretreated with SR141716A (1 μM, 15 min) or pertussis toxin (100 ng/mL, 20 h) prior to treatment with 0.01 μM WIN55212-2 (WIN) for 1 or 2 min at 37°C. Immunoblot analysis was performed and data are reported as mean ± SEM of the % change over basal (A,C) pFAK tyrosine 576/577 levels and (B,D) pFAK tyrosine 397 levels (normalized to total FAK at each time point) from three separate experiments. WIN55212-2-stimulated values are expressed as 100%, and inhibitor-treated values are expressed as a percent of WIN55212-2-treated pFAK/FAK levels. * p < 0.001, # p < 0.01 indicates significantly different from WIN55212-2-stimulated at the same time point using Student's t-test.
Fig. 3.
CB1 couples to G12/13 proteins to regulate changes in the activation state of the Rho family GTPases RhoA and Rac1 in N18TG2 cells. (A) G12/13 proteins coimmunoprecipitate with CB1 in N18TG2 cells. Cells were serum-starved prior to treatment with 1 μM WIN55212-2 (WIN) for the indicated times. Cells were lysed and lysates were immunoprecipitated with antibodies specific for CB1 and collected with protein A-Sepharose beads. Immunoblot analysis was performed using anti-G12/13 primary antibodies and bands were quantified and expressed as a percent of basal (time = 0) G12/13 levels. (B,C) CB1-stimulation of N18TG2 cells resulted in changes in levels of active, GTP-bound RhoA and Rac1. Cells were serum-starved prior to treatment with 1 μM WIN for the indicated times. Pull-down assays were used to precipitate active GTP-bound RhoA and Rac1 from cell lysates. Immunoblot analysis of precipitated proteins (active GTP-bound RhoA or Rac1) and cell lysates (total RhoA or Rac1) were performed using anti-RhoA and anti-Rac1 primary antibodies. Bands were quantified and expressed as a percent of basal (time = 0) GTP-bound Rac1 or RhoA levels.
3.2. CB1-stimulated Phase I maximal FAK phosphorylation at tyrosines 576/577 is mediated by Src kinase and the protein tyrosine phosphatases PTP1B, Shp1, and Shp2 in N18TG2 cells
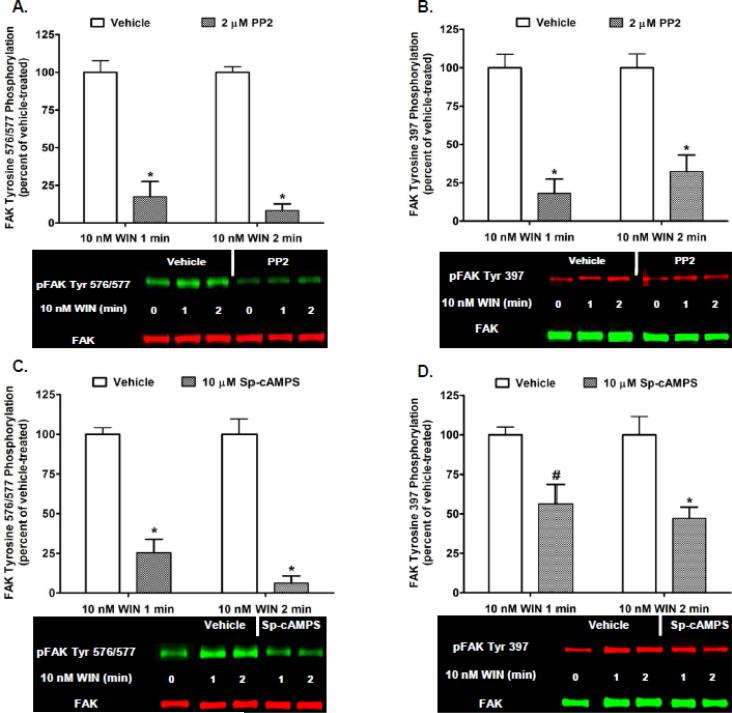
Activated Src catalyzes the phosphorylation of FAK at both Tyr 397 and Tyr 576/577 to activate FAK [5, 19]. Several protein tyrosine phosphatases activate Src by dephosphorylating the Src Tyr 527 negative regulatory carboxy terminal phosphorylation site which results in Src activation [20]. PTP1B, Shp1, and Shp2 utilize this mechanism of Src activation to act as key positive regulators of Src activity [21-24]. The stimulatory effect these protein tyrosine phosphatases have on Src activity is opposed by the cytoplasmic protein tyrosine kinase C-terminal Src kinase (Csk) that catalyzes the phosphorylation of Src Tyr 527 to inhibit Src [20]. Csk is directly activated by PKA-mediated phosphorylation of Csk serine 364 [25]. To investigate whether Src is involved in Phase I FAK 576/577 Tyr-P, N18TG2 cells were pretreated with the Src inhibitor PP2 at concentrations that were based on determined IC50 values [26-27]. PP2 (2 μM) significantly reduced basal FAK 576/577 Tyr-P and Phase I WIN55212-2-stimulated FAK 576/577 Tyr-P (1 min 82.51% ± 10.16 inhibition; 2 min 91.67% ± 4.44 inhibition) which confirms Tyr 576/577 are Src-dependent phosphorylation sites (Fig. 4A). WIN55212-2-stimulated FAK 397 Tyr-P was also inhibited by PP2 (1 min 81.97% ± 9.31 inhibition; 2 min 67.65% ± 10.69 inhibition) which indicates Src mediates phosphorylation of this residue in N18TG2 cells (Fig. 4B). Studies were conducted using the PKA activator Sp-cAMPS to determine whether Phase I FAK 576/577 Tyr-P can be attenuated by PKA-mediated inhibition of Src in N18TG2 cells [28]. Sp-cAMPS (10 µM) significantly and robustly reduced Phase I WIN55212-2-stimulated FAK 576/577 Tyr-P (1 min 74.56% ± 8.51 inhibition; 2 min 93.69% ± 4.58 inhibition) (Fig. 4C). WIN55212-2-stimulated FAK 397 Tyr-P was also attenuated significantly, but to a lesser extent (1 min 43.72% ± 12.39; 2 min 52.79 % ± 7.07 inhibition) (Fig. 4D). These findings suggest that CB1/Gi/o-mediated reductions in cAMP levels/PKA activity in N18TG2 cells are a contributory factor in maximal FAK Tyr-P [29].
Fig. 4.
CB1-stimulated FAK phosphorylation at tyrosines 397 and 576/577 involves activation of Src and inhibition of Protein Kinase A in N18TG2 cells. Cells were pretreated for 15 min with the Src inhibitor PP2 (2 μM) or Protein Kinase A activator Sp-cAMPS (10 μM) prior to treatment with 0.01 μM WIN55212-2 (WIN) for 1 or 2 min at 37°C. Immunoblot analysis was performed and data are reported as mean ± SEM of the % change over basal (A,C) pFAK tyrosine 576/577 levels and (B,D) pFAK tyrosine 397 levels (normalized to total FAK at each time point) from three separate experiments. WIN55212-2-stimulated values are expressed as 100%, and inhibitor-treated values are expressed as a percent of WIN55212-2-treated pFAK/FAK levels. * p < 0.001, # p < 0.05 indicates significantly different from WIN55212-2-stimulated at the same time point using Student's t-test.
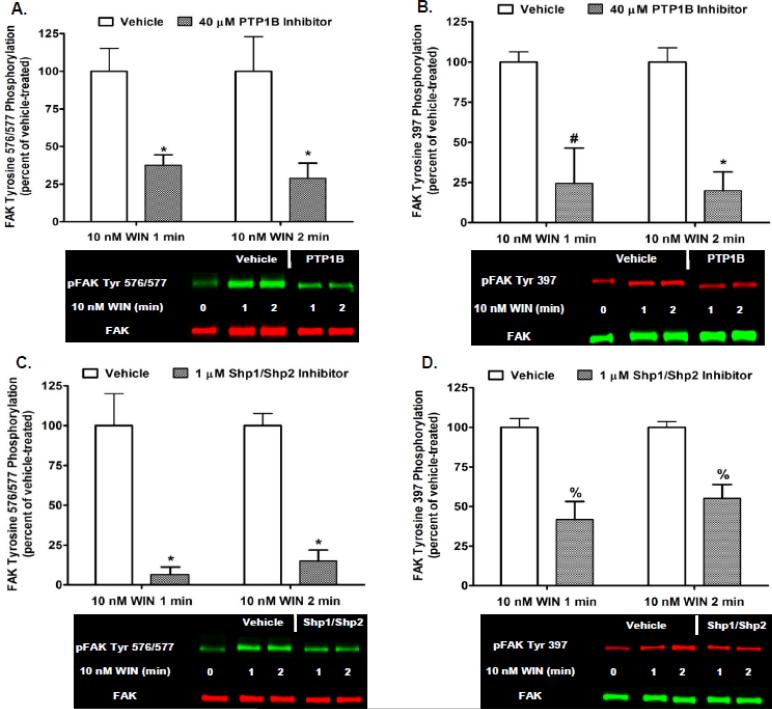
Parallel studies investigated whether Phase I FAK 576/577 Tyr-P is mediated by the protein tyrosine phosphatases PTP1B or Shp1/Shp2 in N18TG2 cells. Cells were pretreated with a selective PTP1B inhibitor (40 μM) or the Shp1/Shp2 inhibitor NSC87877 (1 μM) at concentrations that were based on determined IC50 values [30-31]. Inhibition of PTP1B reduced Phase I WIN55212-2-stimulated FAK 576/577 Tyr-P (1 min 62.40% ± 6.85 inhibition; 2 min 71.05% ± 10.02 inhibition), as well as WIN55212-2-stimulated FAK 397 Tyr-P (1 min 75.59% ± 22.01 inhibition; 2 min 80.18% ± 11.68 inhibition) (Fig. 5A,B). The simultaneous inhibition of Shp1 and Shp2 reduced Phase I WIN55212-2-stimulated FAK 576/577 Tyr-P (1 min 93.37% ± 4.61 inhibition; 2 min 84.97% ± 6.80 inhibition), as well as WIN55212-2-stimulated FAK 397 Tyr-P (1 min 58.25% ± 11.40 inhibition; 2 min 44.82% ± 8.68 inhibition) (Fig. 5C,D). Basal FAK Tyr-P was not altered by Sp-cAMPS, the protein tyrosine phosphatase inhibitors, or the vehicles for these inhibitors (data not shown). These results indicate that CB1-mediated FAK activation requires PKA inhibition, as well as protein tyrosine phosphatase-mediated dephosphorylation/activation of Src in neuronal cells.
Fig. 5.
CB1-stimulated FAK phosphorylation at tyrosines 397 and 576/577 involves activation of the protein tyrosine phosphatases PTP1B and Shp1/Shp2 in N18TG2 cells. Cells were pretreated for 15 min with a PTP1B inhibitor (40 μM) or the Shp1/Shp2 inhibitor NSC87877 (1 μM) prior to treatment with 0.01 μM WIN55212-2 (WIN) for 1 or 2 min at 37°C. Immunoblot analysis was performed and data are reported as mean ± SEM of the % change over basal (A,C) pFAK tyrosine 576/577 levels and (B,D) pFAK tyrosine 397 levels (normalized to total FAK at each time point) from three separate experiments. WIN55212-2-stimulated values are expressed as 100%, and inhibitor-treated values are expressed as a percent of WIN55212-2-treated pFAK/FAK levels. * p < 0.001, % p < 0.01, # p < 0.05 indicates significantly different from WIN55212-2-stimulated at the same time point using Student's t-test.
3.3. CB1-stimulated Phase I maximal FAK phosphorylation at tyrosines 576/577 is mediated by integrins in N18TG2 cells
Integrins are heterodimeric transmembrane cell adhesion receptors composed of one α and one β subunit that attach cells to ECM proteins or to ligands on neighboring cells. Clustering of integrins and integrin binding to ECM proteins leads to FAK Tyr-P and activation [32-33]. Evidence exists that GPCRs engage in crosstalk with integrins to activate FAK [10, 34-36]. In order to determine if CB1 collaborates with integrins to regulate FAK Tyr-P, N18TG2 cells were pretreated with the integrin antagonist RGDS peptide. RGD (Arg-Gly-Asp) is an amino acid sequence found in ECM proteins, such as fibronectin and vitronectin, that is recognized by many integrins. Integrin binding peptides containing the RGD sequence compete with ECM proteins for binding to these integrins and inhibit integrin-mediated processes [37]. Dose response studies conducted in our laboratory determined that RGDS peptide inhibited WIN55212-2-stimulated maximal FAK 576/577 Tyr-P in N18TG2 cells maximally at 100 μM (data not shown). In the present study, RGDS peptide (100 μM) inhibited Phase I WIN55212-2-stimulated FAK 576/577 Tyr-P (1 min 75.74% ± 7.53 inhibition; 2 min 79.72% ± 6.46 inhibition), as well as WIN55212-2-stimulated FAK 397 Tyr-P (1 min 62.03% ± 19.12 inhibition; 2 min 46.64% ± 2.95 inhibition) (Fig. 6A,B). RGDS peptide had no effect on basal FAK 397 or 576/577 Tyr-P under these experimental conditions (data not shown). The peptide RGES (100 μM), a negative control for RGDS, had no significant effect on Phase I CB1-stimulated FAK 576/577 Tyr-P or CB1-stimulated FAK 397 Tyr-P in N18TG2 cells as expected (Fig. 6C,D). The studies using RGES peptide were conducted with WIN55212-2, as well as the cannabinoid receptor agonists CP55940, 2-AG, and methanandamide which activate FAK with similar efficacies in N18TG2 cells.
Fig. 6.
CB1-stimulated FAK phosphorylation at tyrosines 397 and 576/577 is dependent on integrin activation in N18TG2 cells. (A,B) Cells were pretreated for 15 min with the integrin antagonist RGDS peptide (100 μM) prior to treatment with 0.01 μM WIN55212-2 (WIN) for 1 or 2 min at 37°C. (C,D) Cells were pretreated for 15 min with the negative control RGES peptide (100 μM, RE) prior to treatment with 0.01 μM WIN, 0.01 μM CP55940 (CP), 1 μM methanandamide (MeAEA), or 1 μM 2-arachidonoylglycerol (2-AG) for 2 min at 37°C. Immunoblot analysis was performed and data are reported as mean ± SEM of the % change over basal (A,C) pFAK tyrosine 576/577 levels and (B,D) pFAK tyrosine 397 levels (normalized to total FAK at each time point) from three separate experiments with agonist-stimulated values expressed as 100%. RGDS and RGES-treated values were normalized to agonist-stimulated values and expressed as percent of pFAK/FAK levels. * p < 0.001, # p < 0.05 indicates significantly different from agonist-stimulated at the same time point using Student's t-test. B (basal levels of FAK tyrosine phosphorylation), V (vehicle).
3.4. CB1-stimulated Phase I maximal FAK phosphorylation at tyrosines 576/577 involves cooperative signaling between integrins and receptor tyrosine kinases in N18TG2 cells
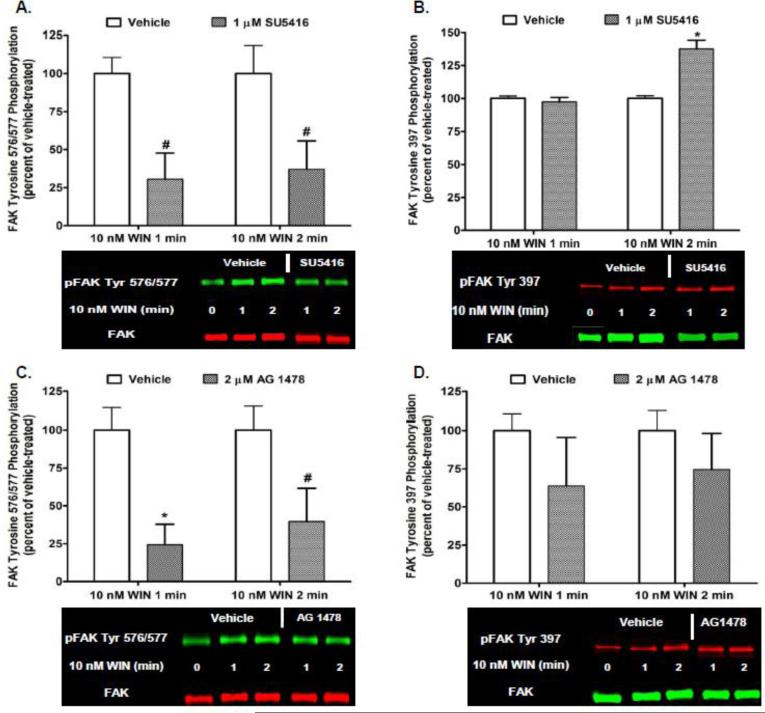
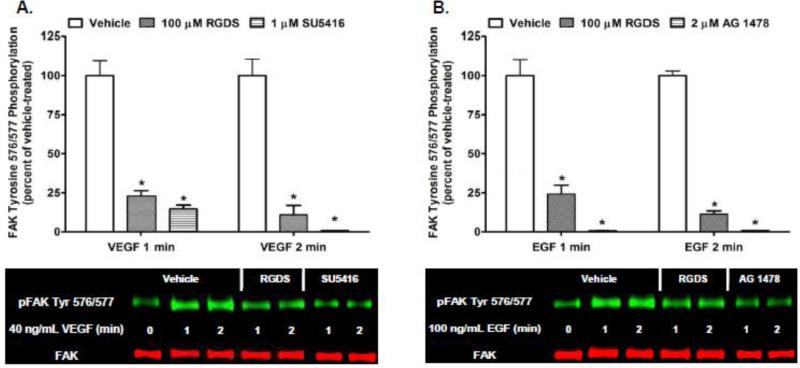
Previous studies in our laboratory have demonstrated that CB1 transactivates multiple RTKs, including the Flk-1 VEGFR and EGFR, to activate extracellular signal-regulated kinases 1 and 2 (ERK1/2) in N18TG2 cells [38]. In order to determine if CB1 transactivates Flk-1 VEGFRs and EGFRs to regulate FAK Tyr-P, N18TG2 cells were pretreated with selective Flk-1 VEGFR and EGFR inhibitors at concentrations that were based on published IC50 values [39-40]. Immunoblotting analyses revealed the Flk-1 VEGFR inhibitor SU5416 (1 μM) and EGFR inhibitor AG 1478 (2 μM) attenuated Phase I WIN55212-2-stimulated FAK 576/577 Tyr-P (Fig. 7A,C). Neither inhibitor significantly reduced WIN55212-2-stimulated FAK 397 Tyr-P (Fig. 7B,D). Basal FAK 397 and 576/577 Tyr-P were not changed by either RTK inhibitor or the DMSO vehicle for these inhibitors (data not shown). RTKs have the ability to regulate signaling events in cells independently. However, growing evidence exists that many RTKs act synergistically with integrins to regulate a variety of signal transduction pathways [41]. Based on our finding that CB1 activates integrins and RTKs to regulate FAK Tyr-P in N18TG2 cells, we sought to determine if RTKs and integrins act in a collaborative fashion to stimulate FAK Tyr-P in this neuronal cell line. Immunoblotting analyses revealed that RGDS peptide (100 μM) inhibited 40 ng/mL VEGF-stimulated FAK 576/577 Tyr-P (1 min 77.07% ± 3.37 inhibition; 2 min 89.02% ± 5.98 inhibition), as did treatment with SU5416 (Fig. 8A). Similarly, RGDS inhibited 100 ng/mL EGF-stimulated FAK 576/577 Tyr-P (1 min 75.79% ± 5.77 inhibition; 2 min 88.58% ± 2.07 inhibition), as did treatment with AG 1478 (Fig. 8B). These findings indicate Flk-1 VEGFRs and EGFRs must engage in crosstalk with integrins to regulate FAK 576/577 Tyr-P in N18TG2 cells.
Fig. 7.
Cannabinoid-stimulated Phase I maximal FAK phosphorylation at tyrosines 576/577 involves CB1 transactivation of multiple receptor tyrosine kinases in N18TG2 cells. Cells were pretreated for 15 min with the Flk-1 VEGFR inhibitor SU5416 (1 μM) or EGFR inhibitor AG 1478 (2 μM) prior to treatment with 0.01 μM WIN55212-2 (WIN) for 1 or 2 min at 37°C. Immunoblot analysis was performed and data are reported as mean ± SEM of the % change over basal (A,C) pFAK tyrosine 576/577 levels and (B,D) pFAK tyrosine 397 levels (normalized to total FAK at each time point) from three separate experiments with WIN55212-2-stimulated values expressed as 100% and inhibitor-treated values expressed as percent of those levels. * p < 0.01, # p < 0.05 indicates significantly different from WIN55212-2-stimulated at the same time point using Student's t-test.
Fig. 8.
Receptor tyrosine kinases and integrins engage in cooperative signaling to stimulate FAK phosphorylation at tyrosines 576/577 in N18TG2 cells. (A,B) Cells were pretreated for 15 min with the integrin antagonist RGDS peptide (100 μM), the Flk-1 VEGFR inhibitor SU5416 (1 μM), or EGFR inhibitor AG 1478 (2 μM) prior to treatment with 40 ng/mL VEGF or 100 ng/mL EGF for 1 or 2 min at 37°C. Immunoblot analysis was performed and data are reported as mean ± SEM of the % change over basal pFAK tyrosine 576/577 levels (normalized to total FAK at each time point) from three separate experiments. Growth factor-stimulated values are expressed as 100%, and inhibitor-treated values are expressed as a percent of growth factor-stimulated pFAK/FAK levels. * p < 0.001 indicates significantly different from growth factor-stimulated at the same time point using Student's t-test.
3.5. CB1-stimulated FAK phosphorylation at tyrosines 397 and 576/577 is adhesion-dependent and occurs in N18TG2 cells plated on the integrin ligands fibronectin and laminin
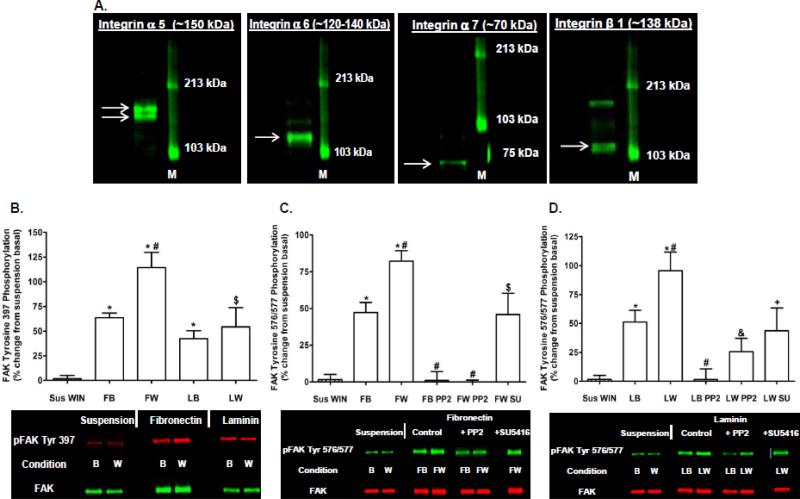
Immunoblotting analyses confirmed N18TG2 cells express subunits for fibronectin (α5β1) and laminin (α6β1, α7β1) integrin receptors (Fig. 9A). Cells placed in contact with fibronectin or laminin attached in a time-dependent reaction that was completed in 30 min. In contrast, cells plated on tissue culture plastic in the absence of serum did not attach and remained in suspension after 30 min. WIN55212-2-stimulated FAK 397 and 576/577 Tyr-P disappeared when N18TG2 cells were kept in suspension in the absence of serum (Fig. 9B-D). In contrast, cells adhering to the integrin ligands fibronectin (10 μg/well) and laminin (11.35 g/well) displayed increased basal FAK 397 and 576/577 Tyr-P compared to suspended cells, and this could be augmented by 0.01 μM WIN55212-2 (Fig. 9B-D). WIN55212-2-stimulated FAK 576/577 Tyr-P was blocked by PP2 (2 μM) in cells plated on fibronectin and laminin which indicates a requirement for Src (Fig. 9C,D). In addition, SU5416 (1 μM) reduced WIN55212-2-stimulated FAK 576/577 Tyr-P in cells plated on fibronectin suggesting integrin receptors engage in crosstalk with Flk-1 VEGFRs to mediate CB1 stimulation of FAK 576/577 Tyr-P (Fig. 9C). SU5416 (1 μM) also reduced WIN55212-2-stimulated FAK 576/577 Tyr-P in cells plated on laminin without reaching significance (P = 0.12 Student's t-test). Finally, basal FAK 576/577 Tyr-P in N18TG2 cells plated on fibronectin was also significantly greater compared to serum-starved cells attached to their own ECM (p < 0.01 Student's t-test). However, basal FAK 576/577 Tyr-P in suspended cells and serum-starved cells attached to their own ECM were not significantly different.
Fig. 9.
The integrin ligands fibronectin and laminin stimulate FAK phosphorylation at tyrosines 397 and 576/577 in N18TG2 cells. (A) Immunoblot analysis of integrin α5, integrin α6, integrin α7, and integrin β1 expression in N18TG2 cells. M (molecular weight size marker). Arrows indicate bands corresponding to protein of interest. (B-D) Cells (8 x 10⁵) were either suspended in serum-free media for 30 min at 37°C or plated on fibronectin (10 g/well) or laminin (11.35 g/well) for 30 min in serum-free media at 37°C. During the 30 min incubation, some cells were treated for 15 min with the Src inhibitor PP2 (2 μM) or the Flk-1 VEGFR inhibitor SU5416 (1 μM). Cells were then treated with 0.01 μM WIN55212-2 (WIN) for 2 min at 37°C. Immunoblot analysis was performed and data are reported as mean ± SEM of the % change over basal (B) pFAK tyrosine 397 levels and (C,D) pFAK tyrosine 576/577 levels (normalized to total FAK at each time point) in suspended cells from three separate experiments. (B) * p < 0.01, $ p < 0.05 significantly different from suspension basal; # p < 0.05 significantly different from FB using Student's t-test. (C) * p < 0.001 significantly different from suspension basal; # p < 0.01 significantly different from FB; $ p < 0.05 significantly different from suspension basal and FW using Student's t-test. (D) * p < 0.001, + p < 0.05 significantly different from suspension basal; # p < 0.05 significantly different from LB; & p < 0.01 significantly different from LW using Student's t-test. B (basal), W (WIN), Sus WIN (suspension + WIN), FB (fibronectin basal), FW (fibronectin + WIN), LB (laminin basal), LW (laminin + WIN), SU (SU5416).
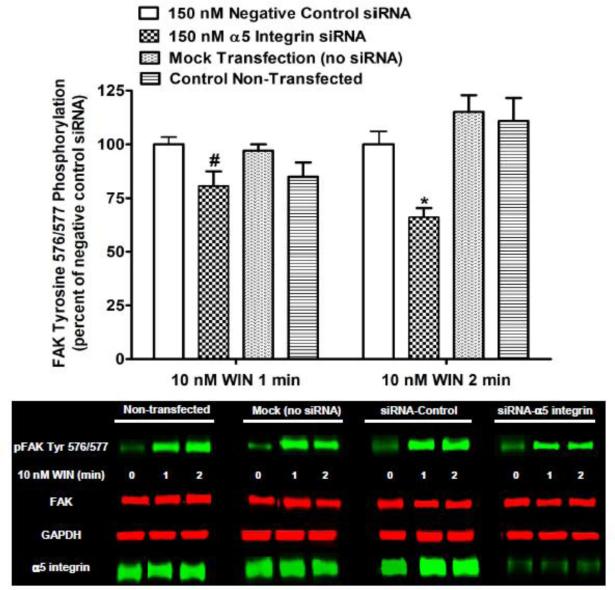
In order to verify the contribution of α5β1 integrins to Phase I CB1-stimulated FAK 576/577 Tyr-P, N18TG2 cells were transfected with 5 integrin-specific siRNA. Immunoblotting analysis demonstrated that 5 integrin expression was significantly reduced in N18TG2 cells by α5 integrin-specific siRNA when compared with non-transfected cells, mock transfected (no siRNA) cells, or cells transfected with negative control siRNA (Fig. 10). As shown in Figure 10, transfection with α5 integrin-specific siRNA inhibited Phase I WIN55212-2-stimulated FAK 576/577 Tyr-P (1 min 19.35% ± 6.75 inhibition; 2 min 33.94% ± 4.28 inhibition) without influencing total FAK levels in these cells. These data confirm that 5β1 fibronectin receptors mediate CB1-stimulated Phase I FAK 576/577 Tyr-P in N18TG2 cells. However, the remaining stimulation suggests that other integrins or alternative pathways are involved in the regulation of FAK maximal Tyr-P by CB1.
Fig. 10.
The α5β1 fibronectin receptor mediates Phase I CB1-stimulated FAK phosphorylation at tyrosines 576/577 in N18TG2 cells. Cells (2 x 10⁵) were transfected with no siRNA (mock transfection), α5 integrin-specific siRNA (150 nM), or negative control siRNA (150 nM) prior to treatment with 0.01 μM WIN55212-2 (WIN) for 1 or 2 min at 37°C. Immunoblot analysis was performed and data are reported as mean ± SEM of the % change over basal pFAK tyrosine 576/577 levels (normalized to total FAK at each time point) from three separate experiments. WIN55212-2-stimulated values in negative control siRNA transfected cells were expressed as 100%, and WIN55212-2-stimulated values in transfected cells (mock and α5 siRNA) and non-transfected cells were expressed as a percent of those levels. * p < 0.001, # p < 0.05 indicates significantly different from WIN55212-2-stimulated values in negative control siRNA transfected cells at the same time point using Student's t-test. FAK and GAPDH were used as loading controls.
4. Discussion
Tyr 397 is the autophosphorylation site of FAK and is involved in FAK initial activation [3]. Phosphorylated Tyr 397 binds Src which phosphorylates Tyr 576/577 in the FAK activation loop to produce maximal FAK catalytic activity [3]. Our data suggest that CB1-mediated FAK 397 and 576/577 Tyr-P are differentially regulated. CB1-stimulated FAK 397 Tyr-P is monophasic and significantly lower in magnitude than Phase I FAK 576/577 Tyr-P, although both involved integrin activation, PKA inhibition, protein tyrosine phosphatase (PTP1B, Shp1/Shp2)-mediated Src activation, and were adhesion-dependent. CB1-stimulated FAK 397 Tyr-P was reduced by Src inhibition in N18TG2 cells which is in accordance with other studies using neuronal cells that demonstrated Src catalyzes FAK phosphorylation [19]. Src inhibition had no effect on basal FAK 397 Tyr-P, consistent with integrin clustering as the primary stimulus for FAK autophosphorylation at Tyr 397 [42]. RTK inhibition also had no influence on CB1-mediated FAK 397 Tyr-P which indicates FAK phosphorylation is mediated solely by integrins and Src.
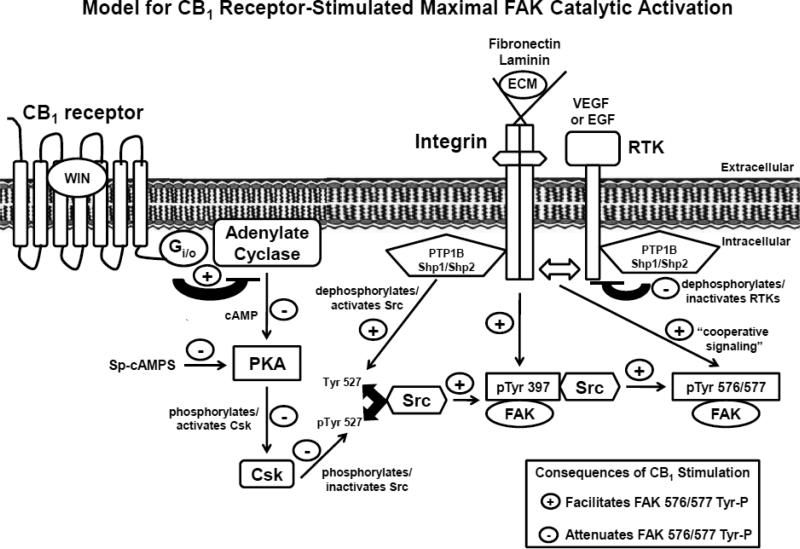
Our study has uncovered a novel signaling pathway utilized by CB1 receptors to regulate maximal FAK catalytic activation in neuronal cells. A kinetic analysis revealed that CB1-stimulated FAK 576/577 Tyr-P is time-dependent and occurs in three phases in N18TG2 neuronal cells. Phase I (0-2 min) is characterized by maximal FAK 576/577 Tyr-P, Phase II (5-20 min) involves a rapid decline in FAK 576/577 Tyr-P, and Phase III (>20 min) involves a plateau in FAK 576/577 Tyr-P at submaximal levels. Phase I FAK 576/577 Tyr-P involved reduced PKA activation, protein tyrosine phosphatase (PTP1B, Shp1/Shp2)-mediated Src activation, as well as cooperative signaling between integrins, Flk-1 VEGFRs, and EGFRs. Our results support a speculative two-process model for CB1 stimulation of maximal FAK catalytic activation in neuronal cells. “Process One” involves CB1-mediated integrin activation, adenylyl cyclase inhibition, reduced PKA activity, reduced Csk-mediated Src phosphorylation/inactivation, as well as protein tyrosine phosphatase-mediated Src dephosphorylation/activation which stimulate FAK 397 Tyr-P and subsequent Phase I maximal FAK 576/577 Tyr-P (Fig. 11). In “Process Two”, activated integrins engage in crosstalk with Flk-1 VEGRs and EGFRs to contribute to Phase I maximal FAK 576/577 Tyr-P (Fig. 11).
Fig. 11.
Signaling pathways utilized by CB1 to stimulate Phase I maximal FAK phosphorylation at tyrosines 576/577 in adherent N18TG2 cells. CB1-stimulated Phase I maximal FAK activation involves activated integrins that are bound to extracellular matrix proteins (e.g. laminin, fibronectin), as well as Src activation. Integrins and Src mediate FAK phosphorylation at tyrosine 397 which subsequently promotes FAK phosphorylation at tyrosines 576/577. Two pathways work synergistically to activate Src that involve (1) dephosphorylation of Src tyrosine 527 by protein tyrosine phosphatases (PTP1B, Shp1/Shp2), and (2) Gi/o-mediated PKA inhibition and the subsequent inhibition of Csk-mediated phosphorylation of Src tyrosine 527. Integrins also work in a cooperative fashion with receptor tyrosine kinases (Flk-1 VEGFR, EGFR) to stimulate FAK phosphorylation at tyrosines 576/577. PTP1B, Shp1, and Shp2 can associate with receptor tyrosine kinases and regulate their activity via dephosphorylation which has negative consequences on FAK 576/577 Tyr-P [60-62]. ECM (extracellular matrix).
It is established that integrins play an important role in FAK activation. Integrins form the backbone of FAs and are cell adhesion receptors that link the actin cytoskeleton to the ECM. FAK is a tyrosine kinase that localizes to FAs where it regulates signaling events that emanate from integrins. Integrin activation results in rapid FAK autophosphorylation at Tyr 397, Src binding to Tyr-P FAK 397, and Src-mediated Tyr-P of additional sites on FAK including Tyr 576/577 [3]. The process of integrin activation can involve a combination of integrin clustering, as well as ligand occupancy/activation of integrins which mediates cell adhesion to the ECM. Synthetic peptides, such as RGDS, are effective integrin antagonists because they occupy integrins at sites where ligands attach. In the present study, we utilized neuronal cells that express fibronectin (α5β1) and laminin (α6β1, α7β1) integrin receptors. CB1 agonists failed to stimulate FAK 397 or 576/577 Tyr-P in the absence of integrin activation in suspended N18TG2 cells. However, cells attached to fibronectin or laminin surfaces exhibited significantly higher basal FAK 397 and 576/577 Tyr-P compared to suspended cells that was augmented by CB1 agonists. We also demonstrated that the integrin antagonist RGDS peptide significantly reduces CB1-mediated FAK 397 Tyr-P and Phase I FAK 576/577 Tyr-P in adherent N18TG2 cells attached to their own ECM, while inhibition of 5 integrin expression using specific siRNA decreased Phase I FAK 576/577 Tyr-P. Thus, our studies have identified an absolute requirement for integrin activation (e.g. RGD-dependent fibronectin integrin receptors) and integrin-mediated cell adhesion in CB1-stimulated FAK 397 Tyr-P and Phase I FAK 576/577 Tyr-P in N18TG2 cells.
Evidence supports our observation that GPCRs engage in interreceptor crosstalk with integrins to regulate FAK signaling [10, 34-36]. For instance, RGDS peptide disrupted CB1-mediated hippocampal FAK activation which suggests CB1 activates FAK via an integrin-regulated signaling pathway in brain [10], while heterologously expressed muscarinic m3 receptors utilized integrins to stimulate FAK Tyr-P in human embryonic kidney cells [34]. Recent studies suggest crosstalk between GPCRs and integrins is mediated via integrin binding to G protein subunits. In platelets, knockdown of Gα13 inhibited cell spreading on the αIIbβ3 integrin ligand fibrinogen and abolished Src activation [43]. Coimmunoprecipitation experiments revealed Gα13 binds directly to the β3 integrin cytoplasmic domain, and inhibition of this interaction prevented integrin-mediated Src activation and platelet spreading [43]. Our results indicate that CB1 associates with pertussis toxin-insensitive G12/13 proteins in N18TG2 cells. It can be postulated that G12/13 proteins mediate crosstalk between CB1 and integrins to regulate FAK activation in this cell line.
G12/13 proteins coordinate important signaling events in cells by regulating changes in the activation state of small GTPases of the Rho family, such as RhoA and Rac1, which are well-known regulators of the actin cytoskeleton and cell motility [18, 44]. Rho guanine nucleotide exchange factors (RhoGEFs) actually mediate Rho GTPase activation in response to stimulation by activated G12/13 proteins [18]. Our work revealed CB1 association with G12/13 proteins decreases during Phase I FAK 576/577 Tyr-P as do active GTP-bound Rac1 levels. During Phase II FAK 576/577 Tyr-P, CB1 association with G12/13 proteins returned to near basal levels, while active GTP-bound Rac1 levels increased and active GTP-bound RhoA levels decreased compared to basal. Integrin signaling through FAK can regulate the activation/deactivation of Rho GTPases. Studies have demonstrated that integrin-activated FAK stimulates Rac1 activation via signaling events that involve p130Cas/DOCK180/ELMO1 and paxillin/β-pix, while integrin-mediated FAK activation has also been shown to suppress active GTP-bound RhoA levels [45]. Like CB1, other GPCRs also couple to both Gi/o and G12/13 and studies have shown that integration of signals from these G proteins determines cellular Rho GTPase activity and influences biological processes such as cell migration [46]. Evidence also exists that Gi/o and G12/13-mediated signaling events have differential effects on neurite extension. Gi/o-mediated signal transduction mechanisms can drive neurite extension in neuronal cells, whereas G12/13/RhoA pathways mediate neurite retraction and growth cone collapse [47-48]. Taken together, these studies provide an appreciation of the complexity of the cellular mechanisms that transduce CB1-mediated neurospike formation, neurite extension, and the neuroprotective effects of cannabinoids.
Tyrosine kinases, such as Src, play an important role in FA formation and integrin-mediated signaling events that are regulated by protein Tyr-P. In FAs, Src binds to FAK and phosphorylates FAK Tyr 576/577 to fully activate FAK intrinsic kinase activity [3]. The dependence of FAK 576/577 Tyr-P on Src was confirmed in N18TG2 cells as Src inhibition, pharmacologically by PP2 and physiologically by PKA activation, blocked basal and Phase I CB1-stimulated FAK 576/577 Tyr-P. Activation of Src is catalyzed by protein tyrosine phosphatases such as PTP1B, Shp1, and Shp2. Studies have demonstrated that PTP1B can localize to FAs where it associates with integrins and positively regulates integrin-mediated FAK Tyr-P [49-50]. PTP1B mediates integrin-stimulated FAK Tyr-P by dephosphorylating the Src negative regulatory carboxy terminal phosphorylation site Tyr 527 which results in Src activation [51]. Shp1 and Shp2 also utilize this mechanism of Src activation to act as key positive regulators of Src activity [23-24]. Like PTP1B, Shp1 and Shp2 bind to integrins and studies reveal Shp2 is required for integrin-mediated Src activation and FAK Tyr-P [52-54]. The stimulatory effect of these protein tyrosine phosphatases on Src activity is opposed by the cytoplasmic protein tyrosine kinase C-terminal Src kinase (Csk) that catalyzes the phosphorylation of Src Tyr 527 to inhibit Src-mediated FAK Tyr-P [20]. Csk is directly activated by PKA-mediated phosphorylation of Csk serine 364 [25]. In N18TG2 cells, CB1-mediated Gi/o protein activation inhibits adenylyl cyclase activity which reduces cAMP levels and PKA activity [29]. Previous studies have demonstrated that PKA inhibition plays an important role in CB1 stimulation of neuronal FAK Tyr-P [8-9]. We propose that CB1-mediated FAK 397 Tyr-P and Phase I 576/577 Tyr-P involve two signaling events that work synergistically to activate Src in N18TG2 cells: (1) Gi/o-mediated inhibition of PKA-stimulated Csk phosphorylation/activation which abrogates Csk-mediated Src phosphorylation/inhibition, and (2) protein tyrosine phosphatase (PTP1B, Shp1/Shp2)-mediated Src kinase dephosphorylation/activation (Fig. 11).
FAK plays an important role integrating RTK and integrin signaling networks and is a major effector for both of these receptor systems [41]. In N18TG2 cells, CB1-stimulated FAK 576/577 Tyr-P was significantly reduced by Flk-1 VEGFR and EGFR specific inhibitors which confirmed involvement of these RTKs in this process. Inhibition of VEGF and EGF-stimulated FAK 576/577 Tyr-P by RGDS peptide provided compelling evidence that these RTKs must work synergistically with integrins. Our data suggest that Flk-1 VEGFRs engage in cross talk with α5β1 fibronectin receptors to mediate CB1 stimulation of FAK 576/577 Tyr-P, since Flk-1 VEGFR inhibition suppressed the ability of CB1 to stimulate FAK 576/577 Tyr-P in cells plated on fibronectin. Flk-1 VEGFRs and EGFRs physically associate and function cooperatively with integrins (e.g. α5β1, αvβ3, α2β1) to regulate cell proliferation, adhesion, migration, and angiogenesis [55-58]. Bi-directional crosstalk between these RTKs and integrins often involves RTK-mediated integrin cross-phosphorylation/activation [56-58]. We speculate that Flk-1 VEGFRs and EGFRs participate in FAK 576/577 Tyr-P by engaging in phosphorylation-dependent crosstalk with integrins which stabilizes these RTKs in maximally activated states and allows FAK to be fully activated.
Questions remain about the cellular mechanisms that initiate Phase II FAK 576/577 Tyr-P. Previous studies indicate that the protein tyrosine phosphatase Shp2 catalyzes FAK dephosphorylation at Tyr 576/577, but does not alter FAK 397 Tyr-P [59]. Similarly, the cellular mechanisms responsible for maintaining the plateau in Phase III FAK 576/577 Tyr-P in N18TG2 cells have yet to be identified.
5. Conclusions
The information gained regarding the cellular mechanisms of CB1-stimulated maximal FAK activation demonstrates how protein kinases, protein phosphatases, and different classes of cell membrane receptors play a role in the complex signaling networks that regulate cellular function. We determined that CB1 stimulates maximal FAK catalytic activity in neuronal cells via integrin activation, PKA inhibition, as well as protein tyrosine phosphatase-mediated Src activation. Integrins and Src stimulate FAK autophosphorylation at Tyr 397 which subsequently promotes maximal FAK 576/577 Tyr-P. Integrins also must engage in crosstalk with Flk-1 VEGRs and EGFRs in order for maximal FAK 576/577 Tyr-P to occur. A thorough analysis of how each of these signaling processes participates in CB1 regulation of FAK activation can provide targets for modification of cellular behavior (e.g. migration, proliferation, survival) in either specific cell types or states of disease.
Highlights.
➢ A novel signaling pathway triggering CB1 stimulation of FAK maximal catalytic activity was elucidated in neuronal cells
➢ CB1 stimulates FAK 576/577 tyrosine phosphorylation in a triphasic manner
➢ Phase I maximal FAK 576/577 tyrosine phosphorylation involves integrin activation, PTP1B-mediated Src activation, and is adhesion-dependent
➢ Phase I maximal FAK 576/577 tyrosine phosphorylation involves cooperative signaling between integrins, Flk-1 VEGRs, and EGFRs
Acknowledgements
This work was supported by NIH grants R01-DA03690 to ACH and F32-DA026295 to GDD. GDD was an RJR-Leon Golberg Post-doctoral Scholar in Pharmacology at Wake Forest University.
Abbreviations
- 2-AG
2-arachidonoylglycerol
- BSA
bovine serum albumin
- CB1
CB1 cannabinoid receptor
- Csk
C-terminal Src kinase
- DAGL
diacylglycerol lipase
- DTT
dithiothreitol
- ECM
extracellular matrix
- ERK1/2
extracellular signal-regulated kinases 1 and 2
- EGFR
epidermal growth factor receptor
- FA
focal adhesion
- FAK
Focal Adhesion Kinase
- GPCR
G protein-coupled receptor
- MAPK
mitogen-activated protein kinase
- PKA
Protein Kinase A
- RTK
receptor tyrosine kinase
- SDS
sodium dodecyl sulfate
- Sp-cAMPS
adenosine 3',5'-cyclic phosphorothioate-Sp
- Src
Src family kinase
- THL
tetrahydrolipstatin
- Tyr-P
tyrosine phosphorylation
- VEGFR
vascular endothelial growth factor receptor
Footnotes
Publisher's Disclaimer: This is a PDF file of an unedited manuscript that has been accepted for publication. As a service to our customers we are providing this early version of the manuscript. The manuscript will undergo copyediting, typesetting, and review of the resulting proof before it is published in its final citable form. Please note that during the production process errors may be discovered which could affect the content, and all legal disclaimers that apply to the journal pertain.
The authors declare no conflicts of interest.
References
- 1.Howlett AC. Handbook of Experimental Pharmacology. 2005:53–79. doi: 10.1007/3-540-26573-2_2. [DOI] [PubMed] [Google Scholar]
- 2.Pertwee RG. British Journal of Pharmacology. 2006;147:S163–171. doi: 10.1038/sj.bjp.0706406. [DOI] [PMC free article] [PubMed] [Google Scholar]
- 3.Parsons JT. Journal of Cell Science. 2003;116:1409–16. doi: 10.1242/jcs.00373. [DOI] [PubMed] [Google Scholar]
- 4.Schaller MD. Journal of Cell Science. 2010;123:1007–13. doi: 10.1242/jcs.045112. [DOI] [PubMed] [Google Scholar]
- 5.Calalb MB, Polte TR, Hanks SK. Molecular and Cellular Biology. 1995;15:954–63. doi: 10.1128/mcb.15.2.954. [DOI] [PMC free article] [PubMed] [Google Scholar]
- 6.Calalb MB, Zhang X, Polte TR, Hanks SK. Biochemical and Biophysical Research Communications. 1996;228:662–68. doi: 10.1006/bbrc.1996.1714. [DOI] [PubMed] [Google Scholar]
- 7.Schlaepfer DD, Hunter T. Molecular and Cellular Biology. 1996;16:5623–33. doi: 10.1128/mcb.16.10.5623. [DOI] [PMC free article] [PubMed] [Google Scholar]
- 8.Derkinderen P, Toutant M, Burgaya F, Le Bert M, Siciliano JC, de Franciscis V, Gelman M, Girault JA. Science. 1996;273:1719–22. doi: 10.1126/science.273.5282.1719. [DOI] [PubMed] [Google Scholar]
- 9.Derkinderen P, Toutant M, Kadare G, Ledent C, Parmentier M, Girault JA. Journal of Biological Chemistry. 2001;276:38289–96. doi: 10.1074/jbc.M105630200. [DOI] [PubMed] [Google Scholar]
- 10.Karanian DA, Brown QB, Makriyannis A, Bahr BA. European Journal of Pharmacology. 2005;508:47–56. doi: 10.1016/j.ejphar.2004.12.009. [DOI] [PubMed] [Google Scholar]
- 11.Guzman M, Sanchez C, Galve-Roperh I. Journal of Molecular Medicine. 2001;78:613–25. doi: 10.1007/s001090000177. [DOI] [PubMed] [Google Scholar]
- 12.Galve-Roperh I, Aguado T, Rueda D, Velasco G, Guzman M. Current Pharmaceutical Design. 2006;12:2319–25. doi: 10.2174/138161206777585139. [DOI] [PubMed] [Google Scholar]
- 13.Bisogno T, Sepe N, Melck D, Maurelli S, De Petrocellis L, Di Marzo V. Biochemical Journal. 1997;332:671–77. doi: 10.1042/bj3220671. [DOI] [PMC free article] [PubMed] [Google Scholar]
- 14.Bradford MM. Analytical Biochemistry. 1976;72:248–54. doi: 10.1006/abio.1976.9999. [DOI] [PubMed] [Google Scholar]
- 15.Ren XD, Kiosses WB, Schwartz MA. The EMBO Journal. 1999;18:578–85. doi: 10.1093/emboj/18.3.578. [DOI] [PMC free article] [PubMed] [Google Scholar]
- 16.Arthur WT, Petch LA, Burridge K. Current Biology. 2000;10:719–22. doi: 10.1016/s0960-9822(00)00537-6. [DOI] [PubMed] [Google Scholar]
- 17.Howlett AC, Song C, Berglund BA, Wilken GH, Pigg JJ. Molecular Pharmacology. 1998;53:504–10. doi: 10.1124/mol.53.3.504. [DOI] [PubMed] [Google Scholar]
- 18.Kozasa T, Hajicek N, Chow CR, Suzuki N. Journal of Biochemistry. 2011;150:357–69. doi: 10.1093/jb/mvr105. [DOI] [PMC free article] [PubMed] [Google Scholar]
- 19.Toutant M, Studler JM, Burgaya F, Costa A, Ezan P, Gelman M, Girault JA. Biochemical Journal. 2000;348:119–28. [PMC free article] [PubMed] [Google Scholar]
- 20.Roskoski R. Biochemistry and Biophysical Research Communication. 2005;331:1–14. doi: 10.1016/j.bbrc.2005.03.012. [DOI] [PubMed] [Google Scholar]
- 21.Bjorge JD, Pang A, Fujita DJ. Journal of Biological Chemistry. 2000;275:41439–46. doi: 10.1074/jbc.M004852200. [DOI] [PubMed] [Google Scholar]
- 22.Zhu S, Bjorge JD, Fujita DJ. Cancer Research. 2007;67:10129–37. doi: 10.1158/0008-5472.CAN-06-4338. [DOI] [PubMed] [Google Scholar]
- 23.Somani AK, Bignon JS, Mills GB, Siminovitch KA, Branch DR. Journal of Biological Chemistry. 1997;272:21113–9. doi: 10.1074/jbc.272.34.21113. [DOI] [PubMed] [Google Scholar]
- 24.Zhang SQ, Yang W, Kontaridis MI, Bivona TG, Wen G, Araki T, Luo J, Thompson JA, Schraven BL, Philips MR, Neel BG. Molecular Cell. 2004;13:341–55. doi: 10.1016/s1097-2765(04)00050-4. [DOI] [PubMed] [Google Scholar]
- 25.Vang T, Torgersen KM, Sundvold V, Saxena M, Levy FO, Skalhegg BS, Hansson V, Mustelin T, Tasken K. Journal of Experimental Medicine. 2001;193:497–507. doi: 10.1084/jem.193.4.497. [DOI] [PMC free article] [PubMed] [Google Scholar]
- 26.Hanke JH, Gardner JP, Dow RL, Changelian PS, Brissette WH, Weringer EJ, Pollok BA, Connelly PA. Journal of Biological Chemistry. 1996;271:695–701. doi: 10.1074/jbc.271.2.695. [DOI] [PubMed] [Google Scholar]
- 27.Waltenberger J, Uecker A, Kroll J, Frank H, Mayr U, Bjorge JD, Fujita D, Gazit A, Hombach V, Levitzki A, Bohmer FD. Circulation Research. 1999;85:12–22. doi: 10.1161/01.res.85.1.12. [DOI] [PubMed] [Google Scholar]
- 28.Rothermel JD, Parker Botelho LH. Biochemical Journal. 1988;251:757–62. doi: 10.1042/bj2510757. [DOI] [PMC free article] [PubMed] [Google Scholar]
- 29.Howlett AC, Qualy JM, Khachatrian LL. Molecular Pharmacology. 1986;29:307–13. [PubMed] [Google Scholar]
- 30.Wiesmann C, Barr KJ, Kung J, Zhu J, Erlanson DA, Shen W, Fahr BJ, Zhong M, Taylor L, Randal M, McDowell RS, Hansen SK. Nature Structural & Molecular Biology. 2004;11:730–37. doi: 10.1038/nsmb803. [DOI] [PubMed] [Google Scholar]
- 31.Chen L, Sung SS, Yip ML, Lawrence HR, Ren Y, Guida WC, Sebti SM, Lawrence NJ, Wu J. Molecular Pharmacology. 2006;70:562–70. doi: 10.1124/mol.106.025536. [DOI] [PubMed] [Google Scholar]
- 32.Kornberg L, Earp HS, Parsons JT, Schaller M, Juliano RL. Journal of Biological Chemistry. 1992;267:23439–42. [PubMed] [Google Scholar]
- 33.Mizejewski GJ. Proceedings of the Society for Experimental Biology and Medicine. 1999;222:124–38. doi: 10.1177/153537029922200203. [DOI] [PubMed] [Google Scholar]
- 34.Slack BE. Proceedings of the National Academy of Sciences, USA. 1998;95:7281–86. [Google Scholar]
- 35.Teoh CM, Tam JK, Tran T. Journal of Allergy. 2012:341282. doi: 10.1155/2012/341282. [DOI] [PMC free article] [PubMed] [Google Scholar]
- 36.Sinnett-Smith J, Zachary I, Valverde AM, Rozengurt E. Journal of Biological Chemistry. 1993;268:14261–68. [PubMed] [Google Scholar]
- 37.Matsuno H, Stassen JM, Vermylen J, Deckmyn H. Circulation. 1994;90:2203–6. doi: 10.1161/01.cir.90.5.2203. [DOI] [PubMed] [Google Scholar]
- 38.Dalton GD, Howlett AC. British Journal of Pharmacology. 2012;165:2497–511. doi: 10.1111/j.1476-5381.2011.01455.x. [DOI] [PMC free article] [PubMed] [Google Scholar]
- 39.Fong TA, Shawver LK, Sun L, Tang C, App H, Powell TJ, Kim YH, Schreck R, Wang X, Risau W, Ullrich A, Hirth KP, McMahon G. Cancer Research. 1999;59:99–106. [PubMed] [Google Scholar]
- 40.Shushan A, Rojansky N, Laufer N, Klein BY, Shlomai Z, Levitzki R, Hartzstark Z, Ben-Bassat H. Human Reproduction. 2004;19:1957–67. doi: 10.1093/humrep/deh355. [DOI] [PubMed] [Google Scholar]
- 41.Soung YH, Clifford JL, Chung J. BMB Reports. 2010;43:311–18. doi: 10.5483/bmbrep.2010.43.5.311. [DOI] [PubMed] [Google Scholar]
- 42.Cooper LA, Shen TL, Guan JL. Molecular and Cellular Biology. 2003;23:8030–41. doi: 10.1128/MCB.23.22.8030-8041.2003. [DOI] [PMC free article] [PubMed] [Google Scholar]
- 43.Gong H, Shen B, Flevaris P, Chow C, Lam SC, Voyno-Yasenetskaya TA, Kozasa T, Du X. Science. 2010;327:340–43. doi: 10.1126/science.1174779. [DOI] [PMC free article] [PubMed] [Google Scholar]
- 44.Evers EE, Zondag GC, Malliri A, Price LS, ten Klooster JP, van der Kammen RA, Collard JG. European Journal of Cancer. 2000;36:1269–74. doi: 10.1016/s0959-8049(00)00091-5. [DOI] [PubMed] [Google Scholar]
- 45.Huveneers S, Danen EH. Journal of Cell Science. 2009;122:1059–69. doi: 10.1242/jcs.039446. [DOI] [PubMed] [Google Scholar]
- 46.Sugimoto N, Takuwa N, Okamoto H, Sakurada S, Takuwa Y. Molecular and Cellular Biology. 2003;23:1534–45. doi: 10.1128/MCB.23.5.1534-1545.2003. [DOI] [PMC free article] [PubMed] [Google Scholar]
- 47.Kranenburg O, Poland M, van Horck FP, Drechsel D, Hall A, Moolenaar WH. Molecular Biology of the Cell. 1999;10:1851–7. doi: 10.1091/mbc.10.6.1851. [DOI] [PMC free article] [PubMed] [Google Scholar]
- 48.He JC, Neves SR, Jordan JD, Iyengar R. Canadian Journal of Physiology and Pharmacology. 2006;84:687–94. doi: 10.1139/y06-025. [DOI] [PubMed] [Google Scholar]
- 49.Arregui CO, Balsamo J, Lilien J. Journal of Cell Biology. 1998;143:861–73. doi: 10.1083/jcb.143.3.861. [DOI] [PMC free article] [PubMed] [Google Scholar]
- 50.Hernandez MV, Sala MG, Balsamo J, Lilien J, Arregui CO. Journal of Cell Science. 2006;119:1233–43. doi: 10.1242/jcs.02846. [DOI] [PubMed] [Google Scholar]
- 51.Liang F, Lee SY, Liang J, Lawrence DS, Zhang ZY. Journal of Biological Chemistry. 2005;280:24857–63. doi: 10.1074/jbc.M502780200. [DOI] [PubMed] [Google Scholar]
- 52.Bertotti A, Comoglio PM, Trusolino L. Journal of Cell Biology. 2006;175:993–1003. doi: 10.1083/jcb.200605114. 2006. [DOI] [PMC free article] [PubMed] [Google Scholar]
- 53.Oh ES, Gu H, Saxton TM, Timms JF, Hausdorff S, Frevert EU, Kahn BB, Pawson T, Neel BG, Thomas SM. Molecular and Cellular Biology. 1999;19:3205–15. doi: 10.1128/mcb.19.4.3205. [DOI] [PMC free article] [PubMed] [Google Scholar]
- 54.Nystrom A, Shaik ZP, Gullberg D, Krieg T, Eckes B, Zent R, Pozzi A, Iozzo RV. Blood. 2009;114:4897–906. doi: 10.1182/blood-2009-02-207134. [DOI] [PMC free article] [PubMed] [Google Scholar]
- 55.Wijelath ES, Murray J, Rahman S, Patel Y, Ishida A, Strand K, Aziz S, Cardona C, Hammond WP, Savidge GF, Rafii S, Sobel M. Circulation Research. 2002;91:25–31. doi: 10.1161/01.res.0000026420.22406.79. [DOI] [PubMed] [Google Scholar]
- 56.Mahabeleshwar GH, Feng W, Reddy K, Plow EF, Byzova TV. Circulation Research. 2007;101:570–80. doi: 10.1161/CIRCRESAHA.107.155655. [DOI] [PMC free article] [PubMed] [Google Scholar]
- 57.Yu X, Miyamoto S, Mekada E. Journal of Cell Science. 2000;113:2139–47. doi: 10.1242/jcs.113.12.2139. [DOI] [PubMed] [Google Scholar]
- 58.Morozevich GE, Kozlova NI, Ushakova NA, Preobrazhenskaya ME, Berman AE. Aging. 2012;4:368–74. doi: 10.18632/aging.100457. [DOI] [PMC free article] [PubMed] [Google Scholar]
- 59.Khare S, Holgren C, Samarel AM. American Journal of Physiology. Gastrointestinal and Liver Physiology. 2006;291:G1100–12. doi: 10.1152/ajpgi.00008.2006. [DOI] [PubMed] [Google Scholar]
- 60.Cheng-Hsien C, Yung-Ho H, Yuh-Mou S, Chun-Cheng H, Horng-Mo L, Huei-Mei H, Tso-Hsiao C. Pflugers Archive: European Journal of Physiology. 2006;452:16–24. doi: 10.1007/s00424-005-0006-9. [DOI] [PubMed] [Google Scholar]
- 61.Keilhack H, Tenev T, Nyakatura E, Godovac-Zimmermann J, Nielsen L, Seedorf K, Bohmer FD. Journal of Biological Chemistry. 1998;273:24839–46. doi: 10.1074/jbc.273.38.24839. [DOI] [PubMed] [Google Scholar]
- 62.Stuible M, Doody KM, Tremblay ML. Cancer Metastasis Reviews. 2008;27:215–30. doi: 10.1007/s10555-008-9115-1. [DOI] [PubMed] [Google Scholar]


