

Abstract
T cell Immunoglobulin and Mucin domain 3 (TIM-3) is an Ig superfamily member expressed on IFNγ-secreting Th1 and Tc1 cells identified as a negative regulator of immune tolerance. TIM-3 is expressed by a subset of activated CD4+ T cells, and anti-CD3/anti-CD28 stimulation increases both the level of expression and the number of TIM-3+ T cells. In mice, TIM-3 is constitutively expressed on natural regulatory T cells and has been identified as a regulatory molecule of alloimmunity through its ability to modulate CD4+ T cell differentiation. Here, we examined TIM-3 expression on human Tregs to determine its role in T cell suppression. In contrast to mice, TIM-3 is not expressed on Tregs ex vivo but is upregulated after activation. While TIM-3+ Tregs with increased gene expression of lag3, ctla4 and foxp3 are highly efficient suppressors of effector T cells (Teff), TIM-3— Tregs poorly suppressed Th17 as compared to Th1 cells that was associated with decreased STAT-3 expression and phosphorylation with reduced gene expression of il10, ebi3, gzmB, prf1, il1Rα, and ccr6. Thus, our results suggest that TIM-3 expression on Tregs identifies a population highly effective in inhibiting pathogenic Th1 and Th17 responses.
Keywords: TIM-3, regulatory T cells, Th17, FoxP3
Introduction
The TIM proteins are a recently discovered family of molecules that play critical roles in the regulation of effector T cells. TIM-3 was initially described as a molecule specifically expressed on terminally-differentiated IFNγ-producing CD4+ Th1 and CD8+ Tc1 cells [1]. TIM-3 is not expressed on Th2 cells but is found on Th17 cells, albeit at lower levels than on Th1 cells [2]. TIM-3 was shown to be an important regulator of pro-inflammatory immune responses, notably in the central nervous system [3, 4], as blocking the TIM-3 pathway using anti-TIM-3 mAbs or TIM-3-Ig fusion proteins in mice led to increased proliferation and IFNγ production in Th1 cells and exacerbated the clinical and pathological features of experimental autoimmune encephalomyelitis (EAE) [1, 5]. TIM-3 co-expression with PD-1 also identifies exhausted T cells during chronic infection [6, 7]. TIM-3-expressing CD4+ and CD8+ T cells produce reduced amounts of cytokines or are less proliferative in response to antigens [8]. Moreover, blocking the TIM-3 signaling pathway restores proliferation and enhances cytokine production in HIV-1-specific T cells [9] and in HCV-specific human cytotoxic T lymphocytes [6, 10]. Finally, TIM-3 has been implicated in the maintenance of immune homeostasis by driving the termination of Th1/Th17 immune responses [5, 11], and by altering the balance between Tregs and effector T cells in the context of allograft rejection [12] and HCV infection [13].
Tregs constitute a unique T cell lineage that suppresses the function of effector T cells and contributes to peripheral tolerance by maintaining immunological homeostasis [14]. FoxP3 has been identified as a marker and transcription factor driving Treg development and function [14-18]. It has recently been demonstrated that Tregs utilize the master transcription factor of the population of T cells they suppress. Thus, Tregs have been shown to inhibit Th17 responses in vivo in a STAT3-dependent manner [19]. However, little is known regarding the mechanism of these specific suppressor functions or the cell surface molecules that can identify Treg subpopulations.
More recently, the expression of TIM-3 on Tregs has been observed on peripheral blood of chronically HCV-infected individuals after activation [13]. In lung cancer, it has been demonstrated that 70% of TIM-3+CD4+ tumor infiltrating lymphocytes (TILs) expressed FoxP3 and approximately 60% of FoxP3+ TILs were TIM-3+, suggesting a novel role of TIM-3 in tumor-associated regulatory T cells and its importance in human cancer progression [20]. A recent mouse study has shown that TIM-3 marks highly suppressive tissue-resident Tregs that play an important role in shaping the antitumor immune response in situ, increasing the importance of targeting TIM-3 for therapeutic strategies against cancer [21]. Studies in animal models have suggested that Treg cell-based therapies might be a promising tool for the treatment of autoimmune diseases and the promotion of transplant tolerance [22].
Here, we investigated the phenotype and function of human TIM-3+ and TIM-3— Tregs from human peripheral blood. As suggested by the gain of function observed with TIL Tregs, TIM-3+ Tregs display a significantly higher capacity to suppress effector Th1 and Th17 cells as compared to TIM-3— Tregs. Although both TIM-3+ and TIM-3— Tregs can equally inhibit Th1 cell proliferation, TIM-3+ Tregs specifically suppress Th17 cells while TIM-3— Tregs do not. This loss of function is associated with increases in STAT3 expression and function on TIM-3+ Tregs. Thus TIM-3 identifies Treg populations with different functional programs.
Results
TIM-3 expression is induced on the surface of regulatory T cells after TCR stimulation
We have previously demonstrated that TIM-3 is not expressed on the surface of CD4+ T cells from healthy donors ex vivo but is upregulated after TCR stimulation in in vitro cultures [2]. More recently, TIM-3 expression has been detected after TCR stimulation on the surface of mice [23] and human [20] Tregs. In order to precisely examine the kinetics of TIM-3 expression on Tregs, we isolated Tregs by cell sorting to minimize the presence of Tresp contaminants in the culture. Tregs and Tresp were isolated as defined by CD4+CD127low/—CD25high and CD127+CD25low/— CD4+ T cells respectively (Supplemental Fig. 1) and stimulated for 5 days in presence of anti-CD3/anti-CD28 and IL-2. Tresp were used as a positive control for TIM-3 expression [2]. TIM-3 is upregulated on the surface of Tregs upon activation in vitro (Fig.1A and 1B). TIM-3 was first detectable on day 2 and reached maximum expression levels on day 5, with ~15% Tregs expressing TIM-3 by day 5. Interestingly, TIM-3 is preferentially expressed by a subpopulation of Tregs that highly expresses FoxP3 (Fig.1C, FoxP3 MFI values on TIM-3+ versus TIM-3— Tregs are 145 vs 48, respectively). These data suggest that after activation two different subpopulations of Tregs can be distinguished on the basis of TIM-3 expression on healthy donors.
Fig. 1. TIM-3 is expressed on human regulatory T cells after activation.

Regulatory (CD4+CD25highCD127low/—; Tregs) and responder (CD4+CD25low/—CD127+; Tresp) T cells were sorted by flow cytometry and activated with anti-CD3/anti-CD28 for 5 days. A. Cells were harvested every 24 hours and TIM-3 expression was assessed on viable regulatory (upper panel) and responder (lower panel) T cells using TIM-3 and FoxP3 mAbs in combination with a live/dead cell marker. B. Statistical analysis of the kinetics of TIM-3 expression on regulatory (right panel) and responder (left panel) T cells. Mean frequency of TIM-3+ cells ± SEM was calculated from 5 donors in 3 independent experiments. C. Representative histograms of FoxP3 MFI in TIM-3+FoxP3+ Tregs (black), TIM-3—FoxP3+ Tregs (dark grey) and TIM-3+ Tresp (light grey).
Phenotypic characterization of TIM-3+ and TIM-3—Tregs
We then went on to examine the phenotype of both TIM-3— and TIM-3+ Treg subpopulations, investigating the expression of molecules that have been previously described as being important for Treg function such as CTLA-4 and LAG-3 [24-26] or associated with TIM-3 expression such as PD-1 [4, 20, 23, 27]. Tregs and Tresp as controls were purified as previously described and cultured for 3 days in the presence of anti-CD3/anti-CD28 and IL-2. At the end of the culture both populations were sorted based on TIM-3 expression and they were left either unstimulated (Fig.2A, upper panel) or restimulated with PMA/ionomycin for 4 hours (Fig.2A, lower panel). As expected from their increased FoxP3 protein expression (Figure 1A), TIM-3+ Tregs demonstrated an increase in FoxP3 gene expression as compared to TIM-3— Tregs. Interestingly, other inhibitory molecules such as LAG-3, PD-1 and CTLA-4 were also upregulated on TIM-3+ Tregs. This was also observed on TIM-3+ Tresp (Fig. 2A). LAG-3 expression was similar on TIM-3+ Tregs and Tresp, and higher than on their TIM-3— counterparts. Stimulation did not seem to further affect this expression pattern. As expected, CTLA-4 gene expression was increased in Tregs as compared to Tresp. Of note, while both TIM-3— Tregs and Tresp displayed a similar degree of CTLA-4 expression (Fig. 2.A), after stimulation TIM-3— Tregs and Tresp upregulated CTLA-4 approximately 20- and 3-fold, respectively. Moreover, TIM-3+ Tregs displayed increased levels of IL-10 mRNA expression as compared to TIM-3— Tregs. Though IFNγ mRNA was barely detectable, there were no differences in expression between TIM-3+ and TIM-3— Tregs. In addition, TIM-3+ Tregs expressed lower levels of IL-2 mRNA as compared to TIM-3— Tregs. The phenotypic characterization of TIM-3— and TIM-3+ Tregs was further confirmed at protein level by flow cytometry (Fig. 2B).
Fig. 2. Characterization of TIM-3+ and TIM-3— regulatory T cells.

Sorted Tregs and Tresp were activated for 3 days with anti-CD3/anti-CD28 and TIM-3+ and TIM-3— regulatory and responder T cells were resorted by flow cytometry and activated or not with PMA/ionomycin for 4 hours. The relative expression of indicated genes was assessed by RT-PCR (A) and the corresponding protein expressions by flow cytometry (B). MFI of each histogram is indicated at the top right corner. A, summary of 4 independent experiments and B, one representative experiment of four independent experiments.
TIM-3+ expression identifies a subset of Tregs with increased in vitro suppressor function
Since TIM-3+ Tregs displayed a number of cell surface molecules potentially associated with suppressor function such as LAG-3, CTLA-4 and PD-1, we investigated whether the phenotype of TIM-3+ Tregs would be reflected in differences in their suppressive ability. Tregs were isolated by cell sorting as previously described and cultured for 3 days in the presence of anti-CD3/anti-CD28 and IL-2 to induce TIM-3 expression. After 3 days of culture, Tregs were sorted based on their TIM-3 expression; Tresp were sorted as defined by CD4+CD127+CD25low/—, labeled with CFSE and co-cultured with either TIM-3+ or TIM-3— Tregs at Treg:Tresp ratios ranging from 1:2 to 1:8. Tresp proliferation was assessed at day 3 by CFSE dilution and analyzed by flow cytometry excluding non-viable cells (Fig. 3). After three days, Tresp proliferation was strongly inhibited by TIM-3+ Tregs at every Treg:Tresp ratio tested. The percentages of suppression of Tresp proliferation by TIM-3+ Tregs ranged from 74±12.2% to 50±12.2% at Treg:Tresp ratios of 1:2 to 1:8 (Fig. 3A left panels). In marked contrast, TIM-3— Tregs were significantly less efficient in their ability to inhibit Tresp proliferation (28.6±8.7%, 13.2±8.7% and 1.1±0.4% at Treg:Tresp ratios of 1:2, 1:4 and 1:8 respectively) (Fig.3A right panels). The differences between TIM-3+ and TIM-3— Tregs in their ability to suppress the proliferation of Tresp were statistically significant at every ratio tested (Fig. 3B). Of note, the increased suppressive ability of TIM-3+ Tregs as compared to TIM-3-Tregs was not due to a differential level of activation between the two populations, as the expression of activation markers such as CD69 and HLA-DR was similar in both TIM-3+ and TIM-3— Tregs (Supplemental Fig.2).
Fig. 3. TIM-3+ regulatory T cells suppress better than TIM-3— regulatory T cells.
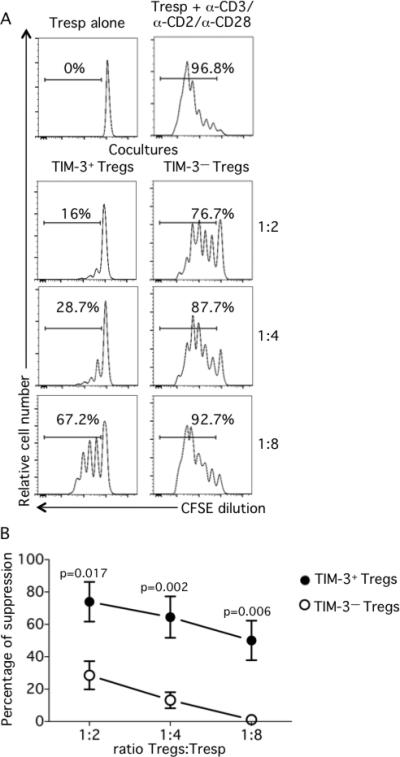
Regulatory (CD4+CD25highCD127low/—; Tregs) T cells were sorted by flow cytometry and activated with anti-CD3/anti-CD28 for 3 days. After 3 days TIM-3+ and TIM-3— regulatory T cells were resorted by flow cytometry and responder (CD4+CD25low/— CD127+; Tresp) T cells were sorted in parallel. CFSE-labeled Tresp were cocultured with TIM-3+ or TIM-3— Tregs at different Tregs:Tresp ratios ranging from 1:2 to 1:8. At day 3, cells were collected, stained for viability and fixed. A. Proliferation of unstimulated (upper left panel) or stimulated (upper right panel) Tresp alone and Tresp and TIM-3+ or TIM-3— Treg co-cultures (lower panels left and right respectively), one representative experiment. B. Percentage of suppression as per the following formula: %suppression = [1-(Tresp in coculture / Tresp alone)] x 100. Statistical analyses of 3 independent experiments with two donors per experiment.
Th17 cells are efficiently suppressed by TIM-3+ but not TIM-3— Tregs
CD4+ Th cells play a central role in the immune response through the production of cytokines that orchestrate immune reactivity. Distinct populations of CD4+ Th cells are identified based on their cytokine production and the expression of specific transcription factors. The two CD4+ Th subsets that play a critical role in autoimmune and inflammatory diseases are Th1 cells that express T-bet and produce IFNγ and Th17 cells that express RORC and produce IL-17A, IL-17F and IL-22 [28-32]. We next investigated whether they could both be suppressed by TIM-3+ and TIM-3— Tregs. Following a previously published strategy to enrich helper T cell subpopulations based on the expression of Th-specific chemokine receptors [33], we purified Th1 and Th17 Tresp by cell sorting as defined by CD127+CD45RA—CXCR3+CCR6— and CD127+CD45RA— CXCR3—CCR6+, respectively. This strategy results in highly enriched populations of resting Th1 and Th17 cells (Supplemental Fig. 3). Both helper T cell populations were labeled with CFSE and co-cultured with either TIM-3+ or TIM-3— Tregs at ratios ranging from 1:2 to 1:8 Treg:Tresp. Tresp proliferation was assessed at day 3 by CFSE dilution and analyzed by flow cytometry (Fig. 4A and B). As expected, TIM-3+ Tregs are better suppressors than TIM-3— Tregs irrespectively of the responder T cell type but interestingly we observed that at lower ratios (1:4 and 1:8) TIM-3— Tregs are much more efficient at suppressing Th1 cells than Th17 cells (Supplemental Fig. 4).
Fig. 4. TIM-3+ but not TIM-3— Tregs efficiently suppress Th17 cells.

Tregs were sorted by flow cytometry and activated with anti-CD3/anti-CD28 for 3 days and TIM-3+ and TIM-3— regulatory T cells were resorted by flow cytometry. Responder (CD4+CD25low/—CD127+CD45RA—CCR6—CXCR3+; Th1, or CD4+CD25low/—CD45RA— CD127+CCR6+CXCR3—; Th17) T cells were sorted in parallel. CFSE-labeled Th1 and Th17 were cocultured with TIM-3+ or TIM-3— Tregs at a 1:8 Treg:Tresp ratio. At day 3, cells were collected, stained for viability and fixed. A. Bars diagram showing percentage of suppression as per the following formula: %suppression = [1-(Tresp in coculture / Tresp alone)] x 100. Statistical analyses of 3 independent experiments with two donors per experiment. B. Proliferation of stimulated Th1 (upper left panel) or Th17 (lower left panel) Tresp alone and Th1 (upper panels) or Th17 (lower panels) Tresp and TIM-3+ (middle panels) or TIM-3— (right panels) Treg co-cultures, one representative experiment. C. STAT3 and STAT1 gene expression on Tregs stimulated for 3 days and resorted as TIM-3+ and TIM-3— (n=4). D. Representative plot (left) and statistical analysis (right) of pSTAT3 expression on TIM-3+ and TIM-3— Tregs at day 3 after activation (n=4).
We wished to explore the mechanism for the inability of TIM-3— Tregs to suppress Th17 cells. Recent in vivo studies have suggested that Tregs upregulate those transcription factors specific for the T helper subsets that they suppress. Thus, mice Tregs upregulate and utilize T-bet, IRF4 and STAT3 to specifically inhibit Th1, Th2 and Th17 responses in vivo, respectively [19, 34, 35]. As TIM-3— Tregs show a defect in suppressing Th17 responses we hypothesized that this inability would be due to a defect in STAT3 expression and/or function [19]. To examine this hypothesis, we stimulated sorted Tregs for three days and measured STAT3 gene expression on resorted TIM-3+ and TIM-3— Treg subpopulations (Fig. 4C). Ex vivo sorted total Tregs were used as a control. TIM-3— Tregs specifically expressed lower levels of STAT3 mRNA as compared to TIM-3+ Tregs, while no differences where found on STAT1 expression used as a control. This decreased STAT3 expression on TIM-3— Tregs was accompanied by decreases in STAT3 function (Fig. 4D), as TIM-3— Tregs showed a significant decreased frequency of phosphorylated STAT3 as compared to TIM-3+ Tregs (Fig. 4D). It has previously been shown that Stat3 deficient Tregs are selectively impaired in their ability to control Th17 responses in vivo in a model of murine colitis [19]. Moreover, STAT3-deficient Tregs exhibit a reduced expression of some genes implicated in Treg suppressor functions such as IL10, Ebi3, GzmB and Prf1 [19]. To strengthen our observation that STAT3 function and expression might be altered in TIM-3— Tregs and lead to a potential inability to suppress Th17 cells, we cultured Tregs for 3 days in the presence of anti-CD3/anti-CD28 and IL-2. At the end of the culture Tregs were sorted based on TIM-3 expression and we compared the expression of the genes previously described as altered by Stat3 deficiency in Tregs in mice. We found that TIM-3— Tregs significantly downregulate the expression of PFR1, GzmB and IL-10, while Ebi3, IL-1R and CCR6 mRNA expression is decreased but this did not reach statistical significance (Supplemental Fig. 5).
Discussion
Although TIM-3 has been extensively shown to play an important role in T effector dysregulation, its role in Treg function is not well known [3, 6, 9, 10]. This is of particular interest as TIM-3+ Tregs infiltrate tumors at high frequencies. Here we investigated the phenotype and function of TIM-3+ and TIM-3— Tregs after activation to model their function in tissues. TIM-3+ Tregs express higher levels of FoxP3 and other known Treg markers displaying a significantly higher suppressor function as compared to TIM-3— Tregs. Moreover, although both TIM-3+ and TIM-3— Tregs equally inhibit Th1 cell proliferation, TIM-3+ Tregs specifically suppressed Th17 cells while TIM-3— Tregs did not, associated with increases in STAT3 expression and function. Thus TIM-3 identifies Treg populations with different functional programs.
While TIM-3 is expressed ex vivo in human peripheral blood in the context of virally driven T cell clonal exhaustion [3], the expression of TIM-3 on regulatory T cells ex vivo has only been described in tumor infiltrating lymphocytes where there is a constant stimulation by tumor-associated antigens within the tumor site [20, 36]. In agreement with published data, we could not detect TIM-3 expression ex vivo in Tregs circulating in the peripheral blood of healthy individuals [20]. To model the function of TIM-3+ Tregs, we stimulated highly purified natural human Tregs ex vivo and observed that anti-CD3/anti-CD28 stimulation induced stable expression of TIM-3 after five days in a sub-population of cells. These results are in agreement with data in mice showing the upregulation of TIM-3 on Tregs after TCR stimulation [23] and confirm previous observations of TIM-3 expression on CD25+-enriched cells in humans [20]. In that study, a higher frequency of TIM-3+FoxP3+ T cells was observed within a CD4+CD25+ population after activation, but as in those experiments Tregs were not sorted for loss of CD127 expression, it could not be excluded that small numbers of TIM-3+FoxP3+ T cells arose from CD127+ contaminant effector T cells that upregulated FoxP3 after TCR stimulation. This is of particular importance as most CD127+ CD4 Tresp cells upregulate the expression of TIM-3 after activation, in contrast to CD127— Tregs.
While TIM-3 is not expressed on circulating Tregs from healthy subjects ex vivo, TIM-3 is expressed on Tregs in the tumor microenvironment [20]. Thus it was of interest to examine the function and phenotype of TIM-3+ and TIM-3— Tregs after activation as a model for understanding the function of TIM-3 expressing Tregs in vivo. We observed increased expression of CTLA-4, LAG-3 and PD-1 on TIM-3+ Tregs, cell surface molecules described as important in human and mice Treg suppressive function [24-26]. PD-1 has recently been identified as a marker of T cell exhaustion when co-expressed with TIM-3 in chronic viral infections, cancers [4, 20, 27] and in transplant tolerance [23]. Besides those cell surface markers, TIM-3+ Tregs upregulated IL-10 mRNA and downregulated IL-2 in comparison to TIM-3— Tregs. Interestingly, the downregulation of IL-2 by TIM-3+ cells has been recently observed using Jurkat cells overexpressing TIM-3 [37]. In that work, the authors observed that IL-2 production by T cells was downregulated by TIM-3-mediated signals, leading to inhibition of NFAT dephosphorylation and AP-1 transcription. Overall, this pattern of cell surface markers and cytokine expression on TIM-3+ Tregs correlates with an effector Treg phenotype, consistent with their higher suppressive ability as compared to TIM-3— Tregs in vitro.
Studies in mice and humans have previously demonstrated that CD4+ tumor in TILs express TIM-3 [20, 38, 39] and TIM-3 identifies intratumoral Tregs that exert robust immunosuppressive functions and drive the generation of dysfunctional/exhausted T cells [21]. Thus the TIM-3+ Treg population represents a potential target for therapeutic strategies against cancer. While previous studies regarding TIM-3 expression on Tregs at tumor sites suggested that this population might have an increased functionality and that TIM-3 expression correlates with the stage of the disease [40], using sorted TIM-3+ and TIM-3— Tregs we demonstrate that TIM-3+ Tregs from peripheral blood of healthy individuals are significantly more efficient at suppressing effector T cells than TIM-3— Tregs. This is consistent with the hypothesis that TIM-3 expression is a marker of effector regulatory T cells that could play an important role during the process of chronic viral infections or tumor progression. Thus, at a first stage of cancer, effector T cells might be activated, upregulate activation markers such as TIM-3 and secrete cytokines such as IFNγ which have beneficial effects both in antitumor and antiviral immunity. With time, the expression of TIM-3 on regulatory T cells would predominate leading to efficient suppression of effector T cell response, a detrimental host response. Our study supports the hypothesis that targeting the TIM-3 pathway by blocking TIM-3 on regulatory T cells might restrain the immunosuppressive effects of Tregs.
Th1 and Th17 are major T helper cell populations associated with the pathogenesis of autoimmune diseases and cancer. Th1 cells are involved in the elimination of intracellular pathogens and are associated with organ specific autoimmunity while Th17 cells are involved in the immune response against extracellular bacteria and fungi [28]. IL-17-secreting cells have a role in promoting organ-specific autoimmunity and chronic inflammatory conditions [41, 42]. We demonstrate that while TIM-3+ Tregs efficiently suppress both Th1 and Th17 cells, TIM-3— Tregs lost the capacity to suppress Th17 cells while they maintained their ability to suppress Th1 cells as TIM-3+ Tregs. In this regard, several works support the notion of Tregs utilizing the master transcription factor of the population of T helper cells they suppress to perform their function [19, 34, 35]. Thus, Tregs have been shown to inhibit Th17 responses in vivo in a STAT3-dependent manner [19]. In agreement with this observation, our data show that the inability of TIM-3— Tregs to suppress Th17 cells correlates with diminished STAT3 expression and function, suggesting that the mechanism described to control Th17 responses in vivo in mice models is defective in TIM-3— Tregs while functional on TIM-3+ Tregs. Moreover, our data are supported by the reduced expression of the genes coding for IL-10, Granzyme B, PRF1, EBI3, IL-1R and CCR6 in TIM-3— Tregs, suggesting again that those Tregs might behave as Stat3 deficient Tregs.
In conclusion, we described TIM-3 as a marker of a highly suppressive population of Tregs phenotypically and functionally distinct from TIM-3— Tregs. We demonstrated that TIM-3+ Tregs display an effector phenotype and specifically suppress Th17 cells, while TIM-3— Tregs do not. This gain of function is associated with increases in STAT3 expression and function on TIM-3+ Tregs as compared to TIM-3— Tregs. Our data show that TIM-3 identifies two Treg populations with different functional programs, thus our observations increase the potential value of TIM-3 as a target for anticancer therapy.
Materials and Methods
Antibodies
The following monoclonal antibodies and reagents were used: for surface staining, anti-CD25 (clone M-A251), anti-CD45RA (clone 5H9), anti-CXCR3 (clone 1C6/XCXR3), anti-CCR6 (clone 11A9) and anti-CTLA-4 (clone BNI3) from BD Biosciences, anti-CD127 (clone 17-1278) from eBioscience, anti-TIM-3 (clones F38-2E2 and 344823 from Biolegend and R&D systems respectively), anti-PD-1 (clone EH12.2H7) from Biolegend, anti-LAG-3 (polyclonal) from R&D systems and Live/Dead fixable dead cell staining kit from Invitrogen; for intracellular staining, anti-FoxP3 (clone PCH101) from eBioscience and anti-pSTAT3 (pY705) from BD Biosciences.
Cell isolation and FACS sorting of T cell populations
Peripheral blood was obtained from healthy control volunteers in compliance with Institutional Review Board protocols at Yale University. PBMCs were separated by Ficoll-Paque PLUS (GE Healthcare) gradient centrifugation. Untouched CD4+ T cells were isolated from PBMCs by negative selection using the EasySep Human CD4+ T cell Enrichment Kit (Stemcell). CD4+ regulatory T cells (Tregs, CD25highCD127low/—), responder T cells (Tresp, CD25low/—CD127+), CD127+CD45RA—CXCR3+CCR6— Th1 and CD127+CD45RA—CXCR3—CCR6+ Th17 were sorted by high-speed flow cytometry on a FACS Aria (BD Biosciences) to a purity >98% as verified by post-sort analysis.
Cell activation and intracellular staining
Cell populations were stimulated with 1 μg/ml plate bound anti-CD3, 1 μg/ml soluble anti-CD28 and 25 U/ml IL-2. Tregs and Tresp were cultured for 0 to 5 days in 96-well round bottom plates (Costar) at 10 x 104 and 5 x 10⁴ cells per well, respectively, in RPMI medium (Gibco) supplemented with 2 nM L-glutamine, 5 mM HEPES, and 100 U/μg/ml penicillin/streptomycin (Biowhittaker), 0.5 mM sodium pyruvate, 0.05 mM nonessential amino acids (Life Technologies), and 5% human AB serum (Gemini Bio-Products, Woodland, CA). Cells were stained every 24 hours with anti-TIM-3 and its corresponding isotype, and FoxP3 intracellular staining was performed with FoxP3 staining buffers (eBioscience) per manufacturer's recommendations. To verify the purity of the Th1 and Th17 cell populations, sorted cells were activated or not for 4 hours with 30 nM PMA and 200 nM ionomycin and lysed with RLT Plus lysis buffer (QIAGEN) to analyze gene expression by real time PCR. For pSTAT3 staining, sorted Treg cells were stimulated as above and staining was performed at day 3 following manufacturer's guidelines.
Quantification of mRNA expression levels by RT-PCR
RNA was isolated using RNeasy Plus Micro Kit (QIAGEN) following manufacturer's guidelines and converted to cDNA by reverse transcription with random hexamers and Multiscribe RT (TQMN, Reverse Transcription Reagents; Applied Biosystems). For mRNA gene expression assays, probes were purchased from Applied Biosystems (Supplemental Table 1) and the reactions were set up following manufacturer's guidelines and run on a Step One Plus Real-Time PCR system (Applied Biosystems). Values are represented as the difference in Ct values normalized to b2-microglobulin for each sample as per the following formula: Relative RNA expression = (2-dCt) x 1000.
Suppression assays
Tregs were co-cultured with CFSE-labeled Tresp, Th1 or Th17 at 1:2, 1:4 and 1:8 Treg:Tresp ratios (2000 Tregs). Treg inspector beads (Miltenyi) were used as a stimulus at a 1:2 cell:bead ratio. At day 3, co-cultures were stained for viability using the Live/Dead fixable dead cell staining kit (Invitrogen) and fixed using the FoxP3 staining buffer (eBioscience). Proliferation of viable responder T cells was analyzed by CFSE dilution on a BD LSR Fortessa (BD Biosciences).
Statistics
A standard two-tailed t test was used for statistical analysis with a p value of 0.05 or less considered significant.
Supplementary Material
Table 1.
| gene | probe |
|---|---|
| Foxp3 | Hs0026270_m1 |
| Lag3 | Hs00158563_m1 |
| Ctla4 | Hs03044418_m1 |
| Pdcd1 | Hs00169472_m1 |
| Il2 | Hs00174114_m1 |
| Ifng | Hs00989291_m1 |
| Il10 | Hs00961622_m1 |
| Havcr2 | Hs00262170_m1 |
| Prf1 | Hs00169473_m1 |
| GzmB | Hs00169473_m1 |
| Ebi3 | Hs01057148_m1 |
| Il6R | Hs01075666_m1 |
| Il1R | Hs00991002_m1 |
| Ccr6 | Hs00171121_m1 |
Table: Taqman probes used in this work
Acknowledgments
This work was supported by a National MS Society Collaborative Research Center Award CA1061-A-18, National Institutes of Health Grants P01 AI045757, U19 AI046130, U19 AI070352, and P01 AI039671, and by a Jacob Javits Merit award (NS2427) from the National Institute of Neurological Disorders and Stroke, the Penates Foundation and the Nancy Taylor Foundation for Chronic Diseases, Inc. (to D.A.H.) and by a Nancy Davis Junior Investigator award (to M.D.V.)
We would like to thank Lesley Devine and Chao Wang for technical assistance in cell sorting and Vijay Kuchroo for valuable discussions and comments.
Abbreviations
- Teff
effector T cells
- TILs
Tumor Infiltrating Lymphocytes
- TIM-3
T cell Immunoglobulin and Mucin domain 3
- Tresp
responder T cells
Footnotes
Authorship contributions
A-S.G. and M.D.V. designed and performed the experiments, analyzed data and wrote the manuscript. A-S.G. and M.D.V. contributed equally to this work.
M.d.M performed experiments.
D.A.H supervised the study and wrote the manuscript.
Conflict of interest
The authors declare no commercial of financial conflict of interest.
References
- 1.Monney L, Sabatos CA, Gaglia JL, Ryu A, Waldner H, Chernova T, Manning S, Greenfield EA, Coyle AJ, Sobel RA, Freeman GJ, Kuchroo VK. Th1-specific cell surface protein Tim-3 regulates macrophage activation and severity of an autoimmune disease. Nature. 2002;415:536–541. doi: 10.1038/415536a. [DOI] [PubMed] [Google Scholar]
- 2.Hastings WD, Anderson DE, Kassam N, Koguchi K, Greenfield EA, Kent SC, Zheng XX, Strom TB, Hafler DA, Kuchroo VK. TIM-3 is expressed on activated human CD4+ T cells and regulates Th1 and Th17 cytokines. European journal of immunology. 2009;39:2492–2501. doi: 10.1002/eji.200939274. [DOI] [PMC free article] [PubMed] [Google Scholar]
- 3.Hafler DA, Kuchroo V. TIMs: central regulators of immune responses. The Journal of experimental medicine. 2008;205:2699–2701. doi: 10.1084/jem.20082429. [DOI] [PMC free article] [PubMed] [Google Scholar]
- 4.Joller N, Peters A, Anderson AC, Kuchroo VK. Immune checkpoints in central nervous system autoimmunity. Immunological reviews. 248:122–139. doi: 10.1111/j.1600-065X.2012.01136.x. [DOI] [PMC free article] [PubMed] [Google Scholar]
- 5.Sabatos CA, Chakravarti S, Cha E, Schubart A, Sanchez-Fueyo A, Zheng XX, Coyle AJ, Strom TB, Freeman GJ, Kuchroo VK. Interaction of Tim-3 and Tim-3 ligand regulates T helper type 1 responses and induction of peripheral tolerance. Nature immunology. 2003;4:1102–1110. doi: 10.1038/ni988. [DOI] [PubMed] [Google Scholar]
- 6.McMahan RH, Golden-Mason L, Nishimura MI, McMahon BJ, Kemper M, Allen TM, Gretch DR, Rosen HR. Tim-3 expression on PD-1+ HCV-specific human CTLs is associated with viral persistence, and its blockade restores hepatocyte-directed in vitro cytotoxicity. The Journal of clinical investigation. 120:4546–4557. doi: 10.1172/JCI43127. [DOI] [PMC free article] [PubMed] [Google Scholar]
- 7.Takamura S, Tsuji-Kawahara S, Yagita H, Akiba H, Sakamoto M, Chikaishi T, Kato M, Miyazawa M. Premature terminal exhaustion of Friend virus-specific effector CD8+ T cells by rapid induction of multiple inhibitory receptors. Journal of immunology. 184:4696–4707. doi: 10.4049/jimmunol.0903478. [DOI] [PubMed] [Google Scholar]
- 8.Zhu C, Anderson AC, Kuchroo VK. TIM-3 and its regulatory role in immune responses. Current topics in microbiology and immunology. 350:1–15. doi: 10.1007/82_2010_84. [DOI] [PubMed] [Google Scholar]
- 9.Jones RB, Ndhlovu LC, Barbour JD, Sheth PM, Jha AR, Long BR, Wong JC, Satkunarajah M, Schweneker M, Chapman JM, Gyenes G, Vali B, Hyrcza MD, Yue FY, Kovacs C, Sassi A, Loutfy M, Halpenny R, Persad D, Spotts G, Hecht FM, Chun TW, McCune JM, Kaul R, Rini JM, Nixon DF, Ostrowski MA. Tim-3 expression defines a novel population of dysfunctional T cells with highly elevated frequencies in progressive HIV-1 infection. The Journal of experimental medicine. 2008;205:2763–2779. doi: 10.1084/jem.20081398. [DOI] [PMC free article] [PubMed] [Google Scholar]
- 10.Vali B, Jones RB, Sakhdari A, Sheth PM, Clayton K, Yue FY, Gyenes G, Wong D, Klein MB, Saeed S, Benko E, Kovacs C, Kaul R, Ostrowski MA. HCV-specific T cells in HCV/HIV co-infection show elevated frequencies of dual Tim-3/PD-1 expression that correlate with liver disease progression. European journal of immunology. 40:2493–2505. doi: 10.1002/eji.201040340. [DOI] [PubMed] [Google Scholar]
- 11.Sanchez-Fueyo A, Tian J, Picarella D, Domenig C, Zheng XX, Sabatos CA, Manlongat N, Bender O, Kamradt T, Kuchroo VK, Gutierrez-Ramos JC, Coyle AJ, Strom TB. Tim-3 inhibits T helper type 1-mediated auto- and alloimmune responses and promotes immunological tolerance. Nature immunology. 2003;4:1093–1101. doi: 10.1038/ni987. [DOI] [PubMed] [Google Scholar]
- 12.Boenisch O, D'Addio F, Watanabe T, Elyaman W, Magee CN, Yeung MY, Padera RF, Rodig SJ, Murayama T, Tanaka K, Yuan X, Ueno T, Jurisch A, Mfarrej B, Akiba H, Yagita H, Najafian N. TIM-3: a novel regulatory molecule of alloimmune activation. Journal of immunology. 185:5806–5819. doi: 10.4049/jimmunol.0903435. [DOI] [PMC free article] [PubMed] [Google Scholar]
- 13.Moorman JP, Wang JM, Zhang Y, Ji XJ, Ma CJ, Wu XY, Jia ZS, Wang KS, Yao ZQ. Tim-3 pathway controls regulatory and effector T cell balance during hepatitis C virus infection. Journal of immunology. 189:755–766. doi: 10.4049/jimmunol.1200162. [DOI] [PMC free article] [PubMed] [Google Scholar]
- 14.Hori S, Nomura T, Sakaguchi S. Control of regulatory T cell development by the transcription factor Foxp3. Science. 2003;299:1057–1061. [PubMed] [Google Scholar]
- 15.Sakaguchi S, Vignali DA, Rudensky AY, Niec RE, Waldmann H. The plasticity and stability of regulatory T cells. Nature reviews. Immunology. 13:461–467. doi: 10.1038/nri3464. [DOI] [PubMed] [Google Scholar]
- 16.Baecher-Allan C, Viglietta V, Hafler DA. Human CD4+CD25+ regulatory T cells. Seminars in immunology. 2004;16:89–98. doi: 10.1016/j.smim.2003.12.005. [DOI] [PubMed] [Google Scholar]
- 17.Long SA, Buckner JH. CD4+FOXP3+ T regulatory cells in human autoimmunity: more than a numbers game. Journal of immunology. 187:2061–2066. doi: 10.4049/jimmunol.1003224. [DOI] [PMC free article] [PubMed] [Google Scholar]
- 18.Buckner JH. Mechanisms of impaired regulation by CD4(+)CD25(+)FOXP3(+) regulatory T cells in human autoimmune diseases. Nature reviews. Immunology. 10:849–859. doi: 10.1038/nri2889. [DOI] [PMC free article] [PubMed] [Google Scholar]
- 19.Chaudhry A, Rudra D, Treuting P, Samstein RM, Liang Y, Kas A, Rudensky AY. CD4+ regulatory T cells control TH17 responses in a Stat3-dependent manner. Science. 2009;326:986–991. doi: 10.1126/science.1172702. [DOI] [PMC free article] [PubMed] [Google Scholar]
- 20.Gao X, Zhu Y, Li G, Huang H, Zhang G, Wang F, Sun J, Yang Q, Zhang X, Lu B. TIM-3 expression characterizes regulatory T cells in tumor tissues and is associated with lung cancer progression. PloS one. 7:e30676. doi: 10.1371/journal.pone.0030676. [DOI] [PMC free article] [PubMed] [Google Scholar]
- 21.Sakuishi K, Ngiow SF, Sullivan JM, Teng MW, Kuchroo VK, Smyth MJ, Anderson AC. TIM3FOXP3 regulatory T cells are tissue-specific promoters of T-cell dysfunction in cancer. Oncoimmunology. 2:e23849. doi: 10.4161/onci.23849. [DOI] [PMC free article] [PubMed] [Google Scholar]
- 22.Wang X, Lu L, Jiang S. Regulatory T cells: customizing for the clinic. Science translational medicine. 3:83ps19. doi: 10.1126/scitranslmed.3001819. [DOI] [PubMed] [Google Scholar]
- 23.Gupta S, Thornley TB, Gao W, Larocca R, Turka LA, Kuchroo VK, Strom TB. Allograft rejection is restrained by short-lived TIM-3+PD-1+Foxp3+ Tregs. The Journal of clinical investigation. 122:2395–2404. doi: 10.1172/JCI45138. [DOI] [PMC free article] [PubMed] [Google Scholar]
- 24.Liang B, Workman C, Lee J, Chew C, Dale BM, Colonna L, Flores M, Li N, Schweighoffer E, Greenberg S, Tybulewicz V, Vignali D, Clynes R. Regulatory T cells inhibit dendritic cells by lymphocyte activation gene-3 engagement of MHC class II. Journal of immunology. 2008;180:5916–5926. doi: 10.4049/jimmunol.180.9.5916. [DOI] [PubMed] [Google Scholar]
- 25.Huang CT, Workman CJ, Flies D, Pan X, Marson AL, Zhou G, Hipkiss EL, Ravi S, Kowalski J, Levitsky HI, Powell JD, Pardoll DM, Drake CG, Vignali DA. Role of LAG-3 in regulatory T cells. Immunity2004. 21:503–513. doi: 10.1016/j.immuni.2004.08.010. [DOI] [PubMed] [Google Scholar]
- 26.Wing K, Onishi Y, Prieto-Martin P, Yamaguchi T, Miyara M, Fehervari Z, Nomura T, Sakaguchi S. CTLA-4 control over Foxp3+ regulatory T cell function. Science. 2008;322:271–275. doi: 10.1126/science.1160062. [DOI] [PubMed] [Google Scholar]
- 27.Sakuishi K, Jayaraman P, Behar SM, Anderson AC, Kuchroo VK. Emerging Tim-3 functions in antimicrobial and tumor immunity. Trends in immunology. 32:345–349. doi: 10.1016/j.it.2011.05.003. [DOI] [PMC free article] [PubMed] [Google Scholar]
- 28.Luckheeram RV, Zhou R, Verma AD, Xia B. CD4(+)T cells: differentiation and functions. Clinical & developmental immunology. 2012:925135. doi: 10.1155/2012/925135. [DOI] [PMC free article] [PubMed] [Google Scholar]
- 29.Annunziato F, Cosmi L, Liotta F, Maggi E, Romagnani S. Main features of human T helper 17 cells. Annals of the New York Academy of Sciences. 1284:66–70. doi: 10.1111/nyas.12075. [DOI] [PubMed] [Google Scholar]
- 30.Chang Q, Wang YK, Zhao Q, Wang CZ, Hu YZ, Wu BY. Th17 cells are increased with severity of liver inflammation in patients with chronic hepatitis C. Journal of gastroenterology and hepatology. 27:273–278. doi: 10.1111/j.1440-1746.2011.06782.x. [DOI] [PubMed] [Google Scholar]
- 31.Basha HI, Subramanian V, Seetharam A, Nath DS, Ramachandran S, Anderson CD, Shenoy S, Chapman WC, Crippin JS, Mohanakumar T. Characterization of HCV-specific CD4+Th17 immunity in recurrent hepatitis C-induced liver allograft fibrosis. American journal of transplantation : official journal of the American Society of Transplantation and the American Society of Transplant Surgeons. 11:775–785. doi: 10.1111/j.1600-6143.2011.03458.x. [DOI] [PMC free article] [PubMed] [Google Scholar]
- 32.Yang L, Anderson DE, Baecher-Allan C, Hastings WD, Bettelli E, Oukka M, Kuchroo VK, Hafler DA. IL-21 and TGF-beta are required for differentiation of human T(H)17 cells. Nature. 2008;454:350–352. doi: 10.1038/nature07021. [DOI] [PMC free article] [PubMed] [Google Scholar]
- 33.Duhen T, Duhen R, Lanzavecchia A, Sallusto F, Campbell DJ. Functionally distinct subsets of human FOXP3+ Treg cells that phenotypically mirror effector Th cells. Blood. 119:4430–4440. doi: 10.1182/blood-2011-11-392324. [DOI] [PMC free article] [PubMed] [Google Scholar]
- 34.Koch MA, Tucker-Heard G, Perdue NR, Killebrew JR, Urdahl KB, Campbell DJ. The transcription factor T-bet controls regulatory T cell homeostasis and function during type 1 inflammation. Nature immunology. 2009;10:595–602. doi: 10.1038/ni.1731. [DOI] [PMC free article] [PubMed] [Google Scholar]
- 35.Zheng Y, Chaudhry A, Kas A, deRoos P, Kim JM, Chu TT, Corcoran L, Treuting P, Klein U, Rudensky AY. Regulatory T-cell suppressor program co-opts transcription factor IRF4 to control T(H)2 responses. Nature. 2009;458:351–356. doi: 10.1038/nature07674. [DOI] [PMC free article] [PubMed] [Google Scholar]
- 36.Yan J, Zhang Y, Zhang JP, Liang J, Li L, Zheng L. Tim-3 expression defines regulatory T cells in human tumors. PloS one. 8:e58006. doi: 10.1371/journal.pone.0058006. [DOI] [PMC free article] [PubMed] [Google Scholar]
- 37.Lee MJ, Woo MY, Chwae YJ, Kwon MH, Kim K, Park S. Down-regulation of interleukin-2 production by CD4(+) T cells expressing TIM-3 through suppression of NFAT dephosphorylation and AP-1 transcription. Immunobiology. 217:986–995. doi: 10.1016/j.imbio.2012.01.012. [DOI] [PubMed] [Google Scholar]
- 38.Ngiow SF, von Scheidt B, Akiba H, Yagita H, Teng MW, Smyth MJ. Anti-TIM3 antibody promotes T cell IFN-gamma-mediated antitumor immunity and suppresses established tumors. Cancer research. 71:3540–3551. doi: 10.1158/0008-5472.CAN-11-0096. [DOI] [PubMed] [Google Scholar]
- 39.Sakuishi K, Apetoh L, Sullivan JM, Blazar BR, Kuchroo VK, Anderson AC. Targeting Tim-3 and PD-1 pathways to reverse T cell exhaustion and restore anti-tumor immunity. The Journal of experimental medicine. 207:2187–2194. doi: 10.1084/jem.20100643. [DOI] [PMC free article] [PubMed] [Google Scholar]
- 40.Li H, Wu K, Tao K, Chen L, Zheng Q, Lu X, Liu J, Shi L, Liu C, Wang G, Zou W. Tim-3/galectin-9 signaling pathway mediates T-cell dysfunction and predicts poor prognosis in patients with hepatitis B virus-associated hepatocellular carcinoma. Hepatology. 56:1342–1351. doi: 10.1002/hep.25777. [DOI] [PubMed] [Google Scholar]
- 41.Korn T, Bettelli E, Oukka M, Kuchroo VK. IL-17 and Th17 Cells. Annual review of immunology. 2009;27:485–517. doi: 10.1146/annurev.immunol.021908.132710. [DOI] [PubMed] [Google Scholar]
- 42.Dardalhon V, Korn T, Kuchroo VK, Anderson AC. Role of Th1 and Th17 cells in organ-specific autoimmunity. Journal of autoimmunity. 2008;31:252–256. doi: 10.1016/j.jaut.2008.04.017. [DOI] [PMC free article] [PubMed] [Google Scholar]
Associated Data
This section collects any data citations, data availability statements, or supplementary materials included in this article.