

Abstract
The effect of extra-fiber structural and pathological components confounding diffusion tensor imaging (DTI) computation was quantitatively investigated using data generated by both Monte-Carlo simulations and tissue phantoms. Increased extent of vasogenic edema, by addition of various amount of gel to fixed normal mouse trigeminal nerves or by increasing non-restricted isotropic diffusion tensor components in Monte-Carlo simulations, significantly decreased fractional anisotropy (FA), increased radial diffusivity, while less significantly increased axial diffusivity derived by DTI. Increased cellularity, mimicked by graded increase of the restricted isotropic diffusion tensor component in Monte-Carlo simulations, significantly decreased FA and axial diffusivity with limited impact on radial diffusivity derived by DTI. The MC simulation and tissue phantom data were also analyzed by the recently developed diffusion basis spectrum imaging (DBSI) to simultaneously distinguish and quantify the axon/myelin integrity and extra-fiber diffusion components. Results showed that increased cellularity or vasogenic edema did not affect the DBSI-derived fiber FA, axial or radial diffusivity. Importantly, the extent of extra-fiber cellularity and edema estimated by DBSI correlated with experimentally added gel and Monte-Carlo simulations. We also examined the feasibility of applying 25-direction diffusion encoding scheme for DBSI analysis on coherent white matter tracts. Results from both phantom experiments and simulations suggested that the 25-direction diffusion scheme provided comparable DBSI estimation of both fiber diffusion parameters and extra-fiber cellularity/edema extent as those by 99-direction scheme. An in vivo 25-direction DBSI analysis was performed on experimental autoimmune encephalomyelitis (EAE, an animal model of human multiple sclerosis) optic nerve as an example to examine the validity of derived DBSI parameters with post-imaging immunohistochemistry verification. Results support that in vivo DBSI using 25-direction diffusion scheme correctly reflect the underlying axonal injury, demyelination, and inflammation of optic nerves in EAE mice.
Keywords: Magnetic resonance imaging, diffusion tensor imaging, diffusion basis spectrum imaging, multiple tensor model, Monte-Carlo simulation, white matter injury, inflammation, restricted diffusion, experimental autoimmune encephalomyelitis (EAE), Immunohistochemistry (IHC)
Introduction
Diffusion tensor imaging (DTI) successfully detects axon and myelin injury through decreased axial diffusivity (λ∥, parallel to white matter tract) and increased radial diffusivity (λ⊥, perpendicular to white matter tract) in animal models of central nervous system (CNS) diseases and injuries (Song et al., 2002, Kim et al., 2006, Sun et al., 2006, DeBoy et al., 2007). Although decreased DTI-derived fractional anisotropic (FA) has been demonstrated to reflect myelin damage in multiple sclerosis (MS) (Schmierer et al., 2007), it is not a marker specific to myelin damage since other pathological components may also contribute to diffusion anisotropy change (Werring et al., 1999, Assaf et al., 2002). For example, inflammation associated vasogenic edema has been recognized to increase apparent diffusion coefficient (ADC) and underestimate the DTI-derived FA of fiber tracts (Pasternak et al., 2009, Naismith et al., 2010). Increased cellularity has been demonstrated to decrease DTI-derived ADC (Anderson et al., 2000). However, its impact on diffusion anisotropy remains unclear. An in vivo experiment of white matter inflammation in rats has suggested the association of changes in DTI-derived ADC with the evolution of pathology (Lodygensky et al., 2010). It is clear that both axon/myelin and extra-fiber pathological changes can impact DTI-derived metrics.
DTI assumes that diffusion of water molecules in the CNS white matter follows mono-exponential diffusion weighted signal decay (typically at b-value < 1000 s/mm2), and was modeled by a single anisotropic tensor. Thus, diffusion anisotropy of white matter tracts in the presence of multiple structural and pathological compartments poses significant challenges in DTI analysis of white matter tracts since non-Gaussian models or multiple diffusion tensors are needed to reflect the tissue and pathological complexity. Various diffusion techniques have been proposed to overcome the limitation of DTI by non-Gaussian modeling of both parametric (model-based) or non-parametric (model-free) approaches. For instance, diffusion spectrum imaging (DSI) resolves crossing or branching fibers by direct evaluation of diffusion displacement probability density function which is the inverse Fourier transform of the diffusion weighted signals, but typically requires a large number of measurements with extensive diffusion weighting (Wedeen et al., 2005); diffusion kurtosis imaging (DKI) quantifies the non- Gaussian diffusion by estimating apparent diffusion kurtosis of diffusion displacement probability distribution (Jensen et al., 2005); generalized diffusion tensor imaging (gDTI) models the white matter tract via higher order tensors (Liu et al., 2004); composite hindered and restricted model of diffusion (CHARMED) evaluates an extra-cellular compartment (assigned to hindered diffusion resulting from extra-axonal diffusion weighted signal) and intra-cellular compartments (assigned to restricted diffusion in a cylinder representing individual intra-axonal space) employing a comprehensive diffusion weighting scheme (Assaf and Basser, 2005). Recently, Scherrer et al. proposed multiple fascicle models (MFM) to model an isotropic compartment (assigned to free water diffusion) and multiple anisotropic compartments (assigned to single fascicle) using a cube and sphere (CUSP) acquisition scheme (Scherrer and Warfield, 2012). Zhang et al. proposed neurite orientation dispersion and density imaging (NODDI) to model tissue components. Using high-angular-resolution diffusion imaging (HARDI) acquisition scheme, NODDI assesses intra-cellular (assigned to space within neurites), extracellular (assigned to space around the neurites but occupied by glial cells), and CSF compartments for deriving neurite density and orientation dispersion (Zhang et al., 2012). Although these approaches resolve possible fiber orientations and free water diffusion contaminations confounding DTI in the CNS, the restricted water diffusion outside fiber tracts affecting DTI measurements was less commonly dealt with. Glial cells have been modeled as a highly restricted isotropic component in an analytical model (Stanisz et al., 1997). A four-tensor model was proposed to include the restricted isotropic diffusion resulting from cell and the extracellular water components (Alexander et al., 2010), and most recently, restricted isotropic diffusion component has been included as one type of isotropic restricted compartment model in a taxonomy comparison study (Panagiotaki et al., 2012).
The recently-developed diffusion basis spectrum imaging (DBSI) approach models white matter diffusion as the linear combination of multiple discrete anisotropic diffusion tensors describing axonal tracts and a spectrum of isotropic diffusion tensors describing restricted (reflecting cells), non-restricted (reflecting extra-axonal and extracellular space) diffusion components outside of axonal tracts (Wang et al., 2011). Employing a 99-direction diffusion-encoding scheme, DBSI has shown promise to accurately detect and quantify crossing fibers, axonal injury, demyelination, and inflammation-associated cell infiltration and edema in both ex vivo phantom and in vivo mouse brain. Although the effect of increased cell infiltration and edema on DTI-derived indices has been demonstrated previously using cuprizone treated mouse model and mouse trigeminal nerve phantoms (Wang, 2011), a more comprehensive study was needed to investigate the effect of increased cellularity and vasogenic edema associated with inflammation. In this study, diffusion weighted signals derived from Monte-Carlo simulations and acquired from tissue phantoms of fixed mouse trigeminal nerve and 2% agar gel were employed to demonstrate how cellularity and edema change DTI indices. The accuracy of DBSI to resolve the complication of inflammation was also examined. To image the coherent white matter tracts without fiber crossing, such as optic nerve and spinal cord, a simplified DBSI with one anisotropic diffusion tensor component and a spectrum of isotropic diffusion tensors would be sufficient requiring less diffusion encoding directions. A reduced scanning time can be achieved by significantly reducing the number of diffusion weighted images. Thus, we adopted a 25-direction diffusion encoding scheme (Batchelor et al., 2003) on both fixed tissue phantoms and Monte- Carlo (MC) simulation. Comparisons between 25- and 99-direction DBSI results on both experimental tissue phantom and simulated data were conducted to examine the accuracy of DBSI analysis using the 25-direction diffusion encoding scheme. To further demonstrate the feasibility of the 25-direction scheme for DBSI analysis, in vivo DBSI was performed on a group of experimental autoimmune encephalomyelitis (EAE) affected mice at the onset of optic neuritis comparing with the age and gender matched sham control mice. The in vivo diffusion MRI data were analyzed using DBSI and verified by post-imaging immunohistochemistry.
Materials and Methods
Diffusion-Encoding Schemes
Both 99- (Wang et al., 2011) and 25-direction (Batchelor et al., 2003) diffusion-encoding schemes were employed for DBSI analysis in this study. The 99 diffusion-encoding directions were selected as prescribed in diffusion spectrum imaging (DSI) where the position vectors are the entire grid points (qx, qy, qz) over the 3-D q-space under the relationship that (qx +qy +qz ) ≤ r2 , where r = 3 for DBSI (Wedeen et al., 2005, Kuo et al., 2008, Wang et al., 2011). The icosahedral 25-direction sampling scheme was as prescribed by Batchelor et al. with the addition of one extra non-diffusion (b = 0) weighted image. See Appendix A and B for the 99- and 25-direction diffusion-encoding schemes.
Fixed Trigeminal Nerve Phantom
Trigeminal nerves (~4 mm long) were dissected from adult female normal C57BL/6 mice (The Jackson Laboratory, Bar Harbor, ME) after perfusion fixation with 4 % paraformaldehyde in 0.01 M phosphate buffered saline (PBS) followed by immersion fixation for 24 hours and kept in 0.01 M PBS solution at 4 °C. Twenty trigeminal nerves were employed to generate phantoms of a single trigeminal nerve only (n = 7) and a single nerve juxtaposed with different amount of 2% aqueous agar gel to mimic vasogenic edema (n = 13). All phantoms were prepared with a nerve gently blotted using Kimwipes® tissue to remove extra solution. Nerves were placed on a microscope slide with an identifier, with or without agar gel, covering with plastic wrap to avoid dehydration.
Diffusion-Weighted Spectroscopy of Fixed Trigeminal Nerve Phantom
Diffusion-weighted data were collected immediately after nerve phantom preparation using a 6-mm inner diameter single-turn surface coil. Diffusion-weighted spin-echo spectroscopy was performed with the following acquisition parameters: repetition time (TR), 2 sec; echo time (TE), 32 ms; time between application of gradient pulses (Δ), 16 ms; gradient pulse duration (δ), 8 ms; number of average, 1; the maximum diffusion-weighting factor (b-value), 3200 s/mm2 for both 99- and 25-direction diffusion weighting schemes at a single setting. Total acquisition time was 4 min 15 sec.
Monte-Carlo Simulation
Monte-Carlo simulations were performed to evaluate the effect of vasogenic edema and cellularity on DTI and DBSI indices in a computer generated geometric model, mimicking the trigeminal nerve tissue phantoms. The simulation was performed by allowing water molecules (2.5 × 10⁵, randomly distributed) to undergo random walk within a 90-μm diameter sphere (light blue, Fig. 1A) at 20 °C. Diffusivity for free water was set to be 2.02 μm2/ms (at 20 °C). The time-step for simulated random walk was 0.2 ms. The computer generated model of the trigeminal nerve phantom for simulation were composed with (1) a coherent axon fiber bundle modeled by uniformly oriented, and tightly packed cylindrical tubes (green cylinders in Fig. 1A) with diameter of 2 μm; (2) cellular components modeled as isotropic spheres (blue in Fig. 1A) with a diameter of 6 μm randomly placed surrounding the axonal fiber bundle; (3) extra-axonal and extracellular space occupied by water molecules distributed outside of axonal bundle and cellular components (Fig. 1A). The size of axonal cylinder and cells was adapted according to literature reports (Stolzenburg et al., 1989, Stanisz et al., 1997). The imaging voxel (50 × 50 × 50 μm3, pink cube in Fig 1A) was placed in the center of the sphere defined for random walk (light blue outer sphere in Fig. 1A). At the boundary of axon and cell components, the water spin reflected elastically (Liu et al., 2004). During the simulation, water spins were allowed to walk in or out of the imaging voxel without constrains to reflect the real physical condition (Liu et al., 2004). The boundaries of the axon and cell components were assumed to be impermeable. The random walk trajectory of each water spin was recorded and saved during the simulation.
Figure 1.

(A) A three-dimensional computer-synthesized trigeminal nerve model was constructed for Monte-Carlo simulations. The coherently oriented axonal fiber bundle was composed of tightly packed cylinders of 2-μm diameter (green cylinders), to be described by anisotropic water diffusion components. Cells were represented by spheres of 6-μm diameter (blue spheres) randomly placed surrounding the fiber bundle for simulating restricted isotropic water diffusion in cells. Extra-axonal/extracellular space was represented as non-restricted isotropic diffusion within an imaging voxel. Voxel of interest (50 × 50 × 50 μm3 pink cube) was placed in the center of the simulation space for the random walk of water molecules (light blue outer sphere of 90-μm diameter). (B) Baseline trigeminal nerve model (model # 1) consisted of intra- and extra-axonal water diffusion closely associated with axonal fibers (anisotropic diffusion; green bar), cells (restricted isotropic diffusion; blue bar) and extra-axonal/extracellular space (non-restricted isotropic diffusion; pink bar). Similar to the fixed normal trigeminal nerve phantoms with different amount of gel, by gradually increasing the size of imaging voxel, a set of baseline trigeminal nerve model with varying fractions of non-restricted isotropic diffusion (model # 2-11) was used to assess the impact of edema on DTI and DBSI measurements. By increasing the number of spheres, i.e., restricted isotropic diffusion components (model # 12-21), the impact of increased cellularity on DTI and DBSI was also assessed.
Based on previous fixed mouse trigeminal nerve phantom study (Wang et al., 2011), baseline simulation model (model # 1, Fig. 1B), mimicking nerve only mouse trigeminal nerve without added gel, consisted of 12% cells (133 spheres), 68% axonal fibers (529 cylinders), and 20% extra-axonal/extracellular space. The tissue phantom of single nerve plus gel was simulated by increasing the size of imaging voxel of baseline simulation model (model # 1, Fig. 1B), thereby increasing the extra-axonal/extracellular space (model # 2-11, Fig. 1B), to mimic vasogenic edema. In model # 2-11, the cell fraction ranged from 7% to 15%, the axonal fiber fraction ranged from 15% to 57%, and the extra-axonal/extracellular space fraction ranged from 27% to 78% (Fig. 1B). It is very challenging if at all possible to control the amount of cellular components in the experimental trigeminal nerve tissue phantom. However, the cellular components can be readily adjusted and simulated by increasing the number of spheres (cells) inside the simulated imaging voxel. In model # 12-21, the cell volume fraction ranged from 14% to 80%, the axon fiber fraction ranged from 12% to 63%, and the extra-axonal/extracellular space fraction ranged from 8% to 22%.
A simple spin echo sequence with diffusion gradients was implemented to simulate the diffusion weighted MRI signals from the simulated imaging voxel. The simulated phase of each water spin within TE was calculated based on the random walk trajectory (Liu et al., 2004). The overall measured diffusion MRI signal was simulated as the summation of signals contributed from all water spins, ending within the voxel of imaging at the time of TE. The effect of T1 and T2 decay for all spin trajectories were neglected (Liu et al., 2004). Both 99- and 25-direction schemes were employed to acquire the diffusion weighted signals. Other key MRI acquisitions parameters included TE 32 ms, Δ 16 ms, δ 8 ms, maximum b-value 3200 s/mm2 were kept the same intentionally with the fixed trigeminal nerve phantom experiment above. Rician noise was added to the simulated diffusion weighted signals from model #12 mimicking mild cell infiltration (Fig. 1B) to examine the effect of signal-to-noise ratio (SNR) on DBSI-derived indices obtained using 25-direction diffusion scheme at SNR = 10, 20, 30, 40, and 100 of the non-diffusion weighted signal. The simulation was repeated 20 times for each SNR level.
Acute Optic Neuritis of EAE
Five adult female 8-week-old C57BL/6 mice (The Jackson Laboratory, Bar Harbor, ME, USA) were immunized using 50 μg myelin oligodendrocyte glycoprotein peptide (MOG35-55) emulsified in incomplete Freund’s adjuvant with 50 μg Mycobacterium tuberculosis. Five age-matched female mice received only incomplete Freund’s adjuvant and Mycobacterium tuberculosis in the absence of MOG35-55 served as the sham control. For EAE-immunized mice, the adjuvant pertussis toxin (300 ng; PTX, List Laboratories, Campbell, CA) was injected intravenously on the day of immunization and two days later. Transverse view of mouse optic nerve was imaged at the onset of acute EAE optic neuritis (Chiang et al., 2011). Matched sham control mice were randomly selected for in vivo DBSI acquisition whenever an EAE mouse was imaged.
In Vivo Magnetic Resonance Imaging
In vivo diffusion MRI experiments were performed on a 4.7-T Agilent DirectDrive™ small-animal MRI system (Agilent Technologies, Santa Clara, CA) equipped with Magnex/Agilent HD imaging gradient coil (Magnex/Agilent, Oxford, UK) with pulse gradient strength up to 58 G/cm and a gradient rise time ≤ 295 μs. After anesthetized using 1% isoflurane/oxygen, mice were placed in a custom-made head holder. The rate of respiration and rectal temperature, at 37 °C, was monitored and controlled by a small animal physiological monitoring and control unit (SAII Inc., NY). An actively-decoupled volume (transmit)/surface (receive) coil pair was used for MR excitation and signal reception. All image slices were acquired based on previously reported procedures (Sun et al., 2008) to plan for the final-targeted slice showing a transverse view of mouse brain with two optic nerves, as nearly as orthogonal to image slice as possible. A multi-echo spin-echo diffusion-weighted sequence (Tu et al., 2010) and a 25-direction diffusion-encoding scheme combined with one b = 0 were employed and MR acquisition parameters were TR 1.5 sec, TE 37 ms, Δ 18 ms, δ 6 ms, max. b-value 2200 s/mm2, slice thickness 0.8 mm, in-plane resolution 117 μm × 117 μm (before zero-filled). The total acquisition was approximately 2 hour, 20 minutes.
Immunohistochemistry
Mice were perfusion fixed with 0.01 M phosphate-buffered saline (PBS, pH = 7.4) followed by 4% paraformaldehyde in 0.01 M PBS immediately after imaging. Brains were excised and fixed for 24 h, and then transferred to 0.01 M PBS for storage at 4 °C until histological analysis. Fixed optic nerves were embedded in 2% agar blocks (Blewitt et al., 1982) before being embedded in paraffin. Five-μm thick transverse slices were sectioned, deparaffinized, rehydrated, and blocked using a 1:1 mixture of 10% normal goat serum and 2% bovine serum albumin in PBS for 20 min at room temperature to prevent nonspecific binding of goat secondary antibody. Sections were incubated in monoclonal anti-phosphorylated neurofilament primary antibody (SMI-31; 1:1000, Covance, US) to stain non-injured axons, and in rabbit anti-myelin basic protein (MBP) primary antibody (1:1000, Sigma Inc., MO) to stain myelin sheath at 4 °C overnight. After several rinses, secondary goat anti-mouse IgG and goat anti-rabbit IgG conjugated Alexa 488 (1:800, Invitrogen) were applied respectively to visualize immunoreactivity of materials at room temperature for 1 h. After washing, slides were covered using Vectashield Mounting Medium with 4′,6-diamidino-2-phenylindole (DAPI) (Vector Laboratory, Inc., Burlingame, CA). Histological images were acquired at 20x and 60x (water objective) magnifications on Nikon Eclipse 80i fluorescence microscope using MetaMorph software (Universal Imaging Corporation, Sunnyvale, CA).
Data Analysis
Experimental and simulated data obtained using 99- and 25-direction diffusion encoding schemes were examined by DBSI multi-tensor model analysis package developed inhouse with Matlab® (MathWorks) (Wang et al., 2011) and conventional DTI single-tensor model analysis. Briefly, Eq. [1] was first solved by fitting total number k diffusion signals using a linear combination of diffusion basis sets consisting of cylindrically symmetric diffusion tensors with the freedom to vary λ∥ and λ⊥ to estimate the number of anisotropic diffusion tensor components (NAniso) and the associated principal directions. After NAniso was computed, isotropic diffusion tensor components were further analyzed using nonnegative least-squares (NNLS) technique. For coherent white matter tract in this study, NAniso = 1.The global nonlinear optimization was conducted employing direct pattern search to solve Eq. [1]. Sk is the kth measured diffusion weighted signals (k = 1, 2, …, 99; or 25 in this study). fi and f (D) are signal intensity fractions of ith anisotropic diffusion components and a spectrum of isotropic diffusion components from a to b (diffusivity, typically from 0 to 3 μm2/ms), respectively.
| [1] |
To the first approximation, the intracellular water may be modeled as restricted isotropic diffusion due to the hindrance of cell membranes and sub-cellular structures. Based on our previous experimental findings, the restricted isotropic diffusion fraction reflecting cellularity is derived by the summation of f(D) at 0 ≤ ADC ≤ 0.3 μm2/ms. The summation of the remaining f(D) at 3 > ADC > 0.3 μm2/ms was assigned to non-restricted isotropic diffusion reflecting vasogenic edema and CSF water.
Statistical Analysis
All data were expressed as mean ± standard deviation or median and interquartile range (IQR). The comparison between DTI and DBSI derived diffusion parameters was performed on data obtained from trigeminal nerve phantoms and from Monte-Carlo simulations using t-tests or linear regression models with repeated measures where more than one observation per subject was included. A nonparametric Wilcoxon signed rank test has been performed to test equivalence of 99- and 25-direction DBSI-derived parameters including λ∥, λ⊥, and FA, as well as the fractions of different diffusion tensor components. Nonparametric Spearman’s rank correlations were used to compare DBSI/DTI and IHC. The tests were repeated for data from all simulation models, i.e., changing proportion of extra-axonal/extracellular space and for those with a changing proportion of cells. All statistical analyses were performed using SAS V9.3 (SAS Inc., Cary, NC).
Results
Effect of Vasogenic Edema on DTI/DBSI-Derived Parameters
For 99-direction diffusion weighted data (SNR = 40) from fixed trigeminal nerve only phantoms (N=7), DTI derived λ∥ = 0.77 ± 0.05 μm2/ms, λ⊥ = 0.18 ± 0.02 μm2/ms, and FA = 0.72 ± 0.04 were compared with those derived using DBSI where λ∥ = 1.09 ± 0.06 μm2/ms, λ⊥ = 0.15 ± 0.02 μm2/ms, FA = 0.84 ± 0.02 (n = 7, mean ± standard deviation). DBSI estimated axonal fiber fraction to be 67 ± 3%, cellularity to be 14 ± 2%, and extra- axonal/extracellular space to be 20 ± 3% of the total signal intensity. This finding explains the difference of axial diffusivities derived by DTI and DBSI, and is consistent with our previously published results supported by immunohistochemistry (Wang et al., 2011). With the addition of 2% agar gel, DTI derived λ⊥ or FA was significantly affected while DBSI derived parameters remained unchanged (Fig. 2A). A comparable observation was seen in MC simulation data where DTI derived FA decreased while λ∥, λ⊥ increased with increasing vasogenic edema (i.e., extra-axonal/extracellular space, non-restricted isotropic diffusion component; Fig. 2B) with relatively stable DBSI derived FA, λ∥, and λ⊥.
Figure 2.
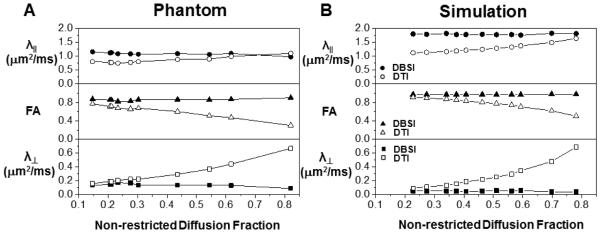
The impact of various extents of vasogenic edema (or tissue loss) on DTI (open symbols) and DBSI (filled symbols) measurements was mimicked experimentally by adding various amount of 2% agar gel to the fixed normal trigeminal nerve (A) or by increasing the extent, i.e., by enlarging the voxel size without changing the cell or axon bundle content, of non-restricted diffusion component in the Monte-Carlo simulation (B). Experimentally (A), increased gel content resulted in overestimating DTI derived λ∥ and λ⊥ (comparing with the nerve only phantom) while underestimated FA (open symbols). The DBSI derived diffusion parameters were not affected by varying the content of the gel (filled symbols). On the data generated using Monte-Carlo simulation (B), increasing non-restricted diffusion components also resulted in overestimating DTI derived λ∥ and λ⊥ while underestimated the FA (open symbols). The DBSI derived diffusion parameters (filled symbols) were not affected by increasing non-restricted diffusion component.
Effect of Increased Cellularity on DTI/DBSI-Derived Parameters
Since cellularity is difficult to change experimentally using the fixed nerve, MC simulation was performed with various extents of extra-fiber cells (i.e., spheres, restricted isotropic diffusion component) to mimic cellularity changes. Diffusion parameters derived by DTI were significantly affected with increasing cellularity, i.e., DTI derived λ∥, and FA significantly decreased with increasing cellularity while DBSI derived parameters were largely unaffected (Fig. 3). DTI derived λ⊥ was minimally affected in contrast to the more profound changes seen in λ∥.
Figure 3.

Due to the difficulty in making reliable experimental phantoms with varying cell contents, Monte-Carlo simulations with varying extents of the restricted diffusion component were performed to mimic the inflammation associated cellularity increase. Increased content of restricted diffusion component significantly underestimated the DTI derived λ∥ and FA without an impact on λ⊥. None of the DBSI derived diffusion parameters was affected by the increased restricted diffusion component.
Close Correspondence between 25- and 99-Direction DBSI-Derived Parameters
There was no discernible difference between 25- vs. 99-direction diffusion encoding scheme in DBSI derived diffusion parameters on data generated using Monte-Carlo simulation (25-dir vs. 99-dir): axial diffusivity (1.80 ± 0.03 μm2/ms vs. 1.81 ± 0.05 μm2/ms), radial diffusivity (0.05 ± 0.01 μm2/ms vs. 0.04 ± 0.01 μm2/ms) and FA (0.96 ± 0.01 vs. 0.97 ± 0.01 μm2/ms). DBSI derived non-restricted and restricted isotropic diffusion fractions using 25- and 99-direction diffusion schemes (Fig. 4A and B) were not different from the true values for the simulation.
Figure 4.

DBSI derived non-restricted (A) and restricted isotropic diffusion fraction (B) using 99- (circle) and 25-direction (triangle) diffusion encoding scheme was compared with the input values used for Monte-Carlo simulations. Data obtained from both diffusion encoding schemes fall on the line of identity (black dashed lines in A and B) suggesting that DBSI analysis can be accurately performed using 25-direction encoding scheme in situations where fiber crossing is not of concern.
Effects of Noise on 25-Direction DBSI-Derived Parameters
MC simulation of 25-direction diffusion weighted data with SNR of non-diffusion weighted image at 10, 20, 30, 40 and 100 was performed on a mild cell infiltration model (model #12). The noise affected the bias and precision of the 25-direction DBSI-derived axial diffusivity (Fig. 5A), radial diffusivity (Fig. 5B), restricted isotropic diffusion tensor fraction (Fig. 5C), and non-restricted isotropic diffusion tensor fraction (Fig. 5D). At SNR=100, DBSI axial diffusivity, radial diffusivity, restricted isotropic diffusion and non-restricted isotropic diffusion fractions were all estimated with high precision indicated by a small interquartile range and absence of outliers (Fig. 5). With decreasing SNR, both bias and precision worsened (Fig. 5). At the SNR range readily achieved on typical animal and clinical scanner (SNR = 20 - 40), 25-direction DBSI-derived axial diffusivity was well-estimated (i.e., falls within the middle half of values at SNR=100) at SNR ≥ 30 while slightly underestimated at SNR = 20 (Fig. 5A); DBSI-radial diffusivity was well-estimated at SNR ≥ 20 (Fig. 5B); the restricted diffusion fraction was well-estimated at SNR ≥ 40 while overestimated at SNR ≤ 30 (Fig. 5C); and non-restricted diffusion fraction was well-estimated at SNR ≥ 30 while underestimated at SNR = 20 (Fig. 5D).
Figure 5.

Monte-Carlo simulation of 25-direction diffusion weighted data with SNR of non-diffusion weighted image at 10, 20, 30, 40 and 100 was performed on a mild cell infiltration model (model #12). The noise affected the bias and precision of the 25- direction DBSI-derived axial diffusivity (A), radial diffusivity (B), restricted isotropic diffusion tensor fraction (C), and non-restricted isotropic diffusion tensor fraction (D). At SNR=100, DBSI axial diffusivity, radial diffusivity, restricted isotropic diffusion and non-restricted isotropic diffusion fractions were all estimated with high precision indicated by a small interquartile range and absence of outliers. With decreasing SNR, both bias and precision worsened. At SNR = 40, achieved on the current in vivo DBSI examinations of EAE and sham control mice, DBSI-derived λǁ (A), λ⊥ (B), restricted (C), and non-restricted (D) diffusion fraction were all well-estimated.
In Vivo DBSI of EAE Mice at the Onset of Optic Neuritis
A close examination of the 25-direction DTI and DBSI parameter maps of the representative sham (Figs. 6A – F) and EAE-affected (Figs. 6a – f) mice suggested the presence of axonal injury revealed by the decreased λ∥ derived by both DTI (Fig. 6a) and DBSI (Fig. 6b), and demyelination indicated by the increased λ⊥ derived by DTI (Fig. 6c) and DBSI (Fig. 6d), and inflammation implicated by the increased restricted (Fig. 6e) and non-restricted (Fig. 6f) isotropic diffusion fraction in the EAE-affected optic nerve. All diffusion MRI detected pathologies in the EAE optic nerve exhibited a heterogeneous distribution in the cross-section of the nerve (Figs. 6a – 6f). Apparent heterogeneity of cell infiltration was also seen, consistent with a heterogeneous increase in DAPI-positive cell nuclei staining (Figs. 6K and k). Qualitatively, axonal injury (decreased λ∥) and demyelination (increased λ⊥) occurred within the regions where increased cellularity (increased restricted isotropic diffusion fraction) was present (Figs. 6b, d, and e).
Figure 6.

Representative in vivo DTI/DBSI parameters maps and post-MRI immunohistochemical staining of the optic nerves from the sham (labeled by capital letters) and EAE-affected mice (labeled by lower case letters) were employed to detect underlying optic nerve pathologies. The decreased λǁ measured by DTI (a) and DBSI (b) matching the SMI-31 staining (g and h) in EAE optic nerve comparing with those seen in the sham (A, B, G, and H) reflected axonal injury. Demyelination was seen as increased λ⊥ in EAE optic nerves derived by DTI (c) and DBSI (d) and the loss of MBP staining (i and j) comparing with that of the sham (C, D, I, and J). Increased restricted diffusion fraction (e) of EAE matched the pattern of increased DAPI-positive nuclear staining (k and l), comparing with that of the sham optic nerve (E, K, and L). Increased non-restricted diffusion tensor fraction derived by DBSI was also increased (f) in the EAE optic nerve comparing with the sham (E), potentially reflecting the increased vasogenic edema at the onset of optic neuritis. The correspondence between in vivo DBSI and postmortem immunohistochemistry findings supports that the 25-direction diffusion encoding scheme is adequate for assessing optic nerve pathologies in EAE mice. Quantitative analysis of Immunohistochemical staining was performed on the 60× images (H, h, J, j) for SMI-31 and MBP, and on 20× image of DAPI (K, k) Scale bars represent 100 μm (20×), 10 μm (60×).
Results from quantitative analyses showed significantly decreased λǁ and increased λ⊥ (mean ± standard deviation; EAE vs. Sham) in both DBSI and DTI: DBSI λ∥= 1.73 ± 0.22 vs. 2.10 ± 0.04 μm2/ms (p = 0.020); DTI λ∥ = 1.34 ± 0.37 vs. 1.89 ± 0.09 μm2/ms (p = 0.028); DBSI λ⊥ = 0.15 ± 0.03 vs. 0.11 ± 0.01 μm2/ms (p = 0.047); DTI λ⊥ = 0.21 ± 0.04 vs. 0.11 ± 0.01 μm2/ms (p = 0.0046). DBSI derived restricted isotropic diffusion fraction (i.e., the putative cellularity) in EAE optic nerves was significantly higher than that of the control (0.10 ± 0.09 vs. 0.03 ± 0.01, p = 0.022). The non-restricted isotropic diffusion fraction (i.e., the putative vasogenic edema) was also significantly higher in EAE optic nerves than that of the control (0.15 ± 0.03 vs. 0.03 ± 0.01, p < 0.0001). The increased sum of restricted and non-restricted isotropic diffusion fractions may be a good indicator of inflammation, 0.24 ± 0.12 vs. 0.06 ± 0.02 (EAE vs. Sham, p = 0.024).
Quantitative immunohistochemical analyses revealed that DTI/DBSI detected axonal injury and demyelination was also seen in SMI-31-positive axon counts (5.3 × 10⁵ ± 1.8 × 10⁵ vs. 7.4 × 10⁵ ± 0.2 × 10⁵ counts/mm2; p = 0.03; Figs. 7 A and C) and MBP-positive staining area (37% ± 5% vs. 45% ± 3%; p = 0.01) exhibiting statistically significant correlations (Figs. 7B and D). The DAPI-positive nuclear counts increased in EAE optic nerves (6.6 × 10³ ± 5.0 × 10³ vs. 3.5 × 10³ ± 0.7 × 10³ counts/mm2) without reaching a statistical significance (p = 0.2). DAPI-positive nuclear counts correlated with DBSI estimated cellularity (r = 0.65, p = 0.042; Fig. 7E).
Figure 7.

Consistent with previous findings that in vivo DTI derived λǁ and λ⊥ correctly reflected optic nerve axonal injury and demyelination (A, and B). During the onset of optic neuritis, inflammation led to the increased cellularity (evidenced by increased DAPI-positive counts and increased DBSI-derived restricted diffusion fraction) and edema (increased non-restricted diffusion fraction detected by DBSI). It is unclear how exactly these two factors counteracted in computation of DTI derived parameters. The current and previous results suggest that DTI detected the underlying axonal injury and demyelination in optic nerves of EAE mice. DBSI derived λǁ, λ⊥, and the restricted diffusion fraction correlated with SMI-31 (C), MBP (D), and DAPI (E) staining well.
Discussion
This study investigated the effect of increased cellularity and vasogenic edema, commonly seen in CNS injuries, on the DTI derived diffusion parameters of white matter tracts. Specifically, increased cellularity, as evidenced by increased isotropic restricted diffusion, decreased the DTI derived FA and λ∥ while having a limited impact on λ⊥. Increased vasogenic edema, as evidenced by increased non-restricted isotropic diffusion, also decreased the DTI derived FA but increased λ⊥ with the extent of impact on λ∥ depending on the ADC value of edema relative to λ∥ and λ⊥ of axon. These confounding effects were resolved and quantified by the recently developed DBSI analysis (Wang et al., 2011), as demonstrated herein using data generated by both Monte-Carlo simulation and tissue phantoms. Our prior study used 99-direction diffusion encoding (Wang et al., 2011). A 25-direction diffusion encoding scheme (Batchelor et al., 2003) was assessed in this study to demonstrate its adequacy for performing DBSI analysis on optic nerves from the mouse at the onset of acute optic neuritis.
The partial volume effect of CSF, i.e., non-restricted (free) isotropic diffusion, on DTI indices has long been recognized, and limits DTI capability in regions abutting CSF, such as periventricular regions that are commonly affected by MS. The inclusion of the isotropic component of free diffusion improved fiber diffusion measurements (Alexander et al., 2001, Papadakis et al., 2002). However, such modification is insufficient to deal with coexisting CNS inflammation (increased cellularity and vasogenic edema) or tissue loss that may be seen in diseased tissues (Horsfield and Jones, 2002). To properly model the effect of CNS inflammation and tissue loss, allowing a more accurate evaluation of the diffusion properties of white matter fiber tracts, multiple extra-fiber diffusion components (both restricted and non-restricted isotropic diffusion components) must be identified and quantified. DBSI considers a spectrum of isotropic diffusion components of a wide range of ADC to account for the extra-fiber tissue and pathological components. The current results from fixed normal tissues and gel phantoms, and our previous in vivo mouse brain data (Wang et al., 2011) suggest that the DBSI approach allowed for an accurate estimation of white matter tract diffusion properties in the presence of increased cellularity and vasogenic edema.
The close agreement between the experimental measurements of fixed trigeminal nerve plus gel phantoms and the results from Monte-Carlo simulations using restricted and non-restricted isotropic diffusion components to mimic cells and vasogenic edema supported our approach of including a linear combination of isotropic diffusion spectra to account for the effect of CNS inflammation and tissue loss. One advantage of using DBSI is its capability to resolve crossing fibers while still quantitatively deriving fiber associated anisotropic diffusion tensors to assess the axon and myelin integrity (Wang et al., 2011). Previously, to resolve crossing fibers and quantifying extra-fiber cellularity and edema a 99-direction diffusion encoding scheme was employed (Wang et al., 2011). In the case where crossing fibers are not of concern such as when studying optic nerve and spinal cord white matter tracts, a reduced data acquisition scheme may be sufficient for DBSI analysis. In the present study, the 25-direction diffusion scheme was assessed and proved to be adequate for DBSI analysis of coherent white matter tracts to quantify the extent of cellularity and edema. Thus, existing diffusion weighted data acquired using 25- or other multiple-direction encoding schemes with multiple b-values may be suitable for DBSI analysis without reacquiring new data to examine the single coherent fiber tracts.
Similar to previous results on corpus callosum from cuprizone treated mice (Wang et al., 2011), in vivo DBSI derived restricted isotropic diffusion fraction map of optic nerve from EAE mice revealed a heterogeneous increase in cellularity, closely matching the pattern of DAPI-positive cell nuclei staining of the same nerve (Fig. 6e, k, and l). Note that “cellularity” used in this context is not an equivalent of cell density. Instead, it is a measure of T1, T2, and proton density weighted signal fraction corresponding to restricted isotropic diffusion components within each image voxel (Eq. [1]). Restricted isotropic diffusion fractions have been assigned as “cellularity” fractions because our phantom and animal studies demonstrated a linear correlation between this restricted isotropic diffusion fraction and DAPI nuclei counts.
Various MR techniques have been used to assess inflammation of optic neuritis, but rarely demonstrated the ability to image cellularity changes non-invasively. For example, gadolinium-enhanced T1W images reflect the leakage of blood-brain barrier (Guy et al., 1990, Hickman et al., 2004b, Qi et al., 2007) without information regarding the cellular infiltration. Iron-oxide particles have been used to allow in vivo visualization of macrophages, but this method is insensitive to non-phagocytic cells involved in inflammation (Vellinga et al., 2008). An increased optic nerve area (swelling) has also been considered to reflect the severity of inflammation in acute optic neuritis (Hickman et al., 2004a, Boretius et al., 2008). Unfortunately, this method is nonspecific, as a changed nerve cross-sectional size may reflect cell infiltration and/or edema and is further confounded by any tissue loss that may be present (Hickman et al., 2004a).
In the present study, both DTI and DBSI derived axial and radial diffusivity correctly detected axonal injury and demyelination in the optic nerve at the onset of optic neuritis. This suggests that DTI works well on these mice probably due to the counteraction of increased restricted and hindered/free diffusion tensor components. When examined using DBSI, the co-localization of axonal injury and myelin damage with cell infiltration was seen in the EAE-affected optic nerve. Interestingly, the region of increased cellularity did not always correspond to visible nerve damage (Fig. 6a, b, and e). This is consistent with the pathogenesis of optic neuritis in EAE, i.e., nerve injury originates from the induced CNS inflammation but may not always occur with inflammation, and when it does occur axon injury may extend well outside the region of inflammation (Iglesias et al., 2001, Gold et al., 2006). Such pathological profile can now be detected using DBSI noninvasively.
MRI greatly aids CNS disease diagnosis, but current methods do not assess specific elements of CNS pathology. Gadolinium contrast enhancement (Gd+) can detect a compromised blood-CNS-barrier (BBB), which is useful to screen potential new anti-inflammatory disease modifying drugs. However, Gd+ MRI is not sensitive to small inflammatory lesions or inflammation behind the intact BBB, underscoring the need to improve imaging sensitivity and specificity to identify new beneficial therapies. Without injecting Gadolinium contrast agent, DBSI provides a noninvasive imaging biomarker of inflammation, which could potentially enhance our capability to more accurately evaluate neuro-inflammation in CNS disease. In addition, DBSI-derived indices hold the promise to reflect the various specific components of the CNS pathology to identify new beneficial therapies that affect more than just inflammation. To be most useful, a new technique should be feasible on present clinical scanners. With fast diffusion-weighted EPI sequence available on 3.0 T clinical scanners, 99-direction human whole brain DBSI scans can be performed within 15 minutes, making DBSI protocol feasible for routine clinical scanning of patients.
DBSI in its current form does not consider the effect of water exchange between intracellular and extracellular space, which can potentially affect the accuracy of DBSI metrics, especially under pathological conditions where the permeability of cell membranes may be altered. In addition, DBSI was developed to quantify the effect of inflammation on diffusion MRI determined axonal injury and demyelination in white matter tracts. Further generalization of DBSI model is needed to expand its use in quantifying changes in gray matter pathology commonly seen in CNS disorders.
In summary, we have demonstrated that DBSI removes confounding effects of increased cellularity and vasogenic edema on DTI derived λǁ, λ⊥, and FA. In addition, DBSI quantified the extent of increased cellularity and vasogenic edema resulting from inflammation. We have also demonstrated using in vivo DBSI and post-MRI immunohistochemistry on EAE mice that in the coherent white matter tracts such as optic nerves the 25-direction diffusion weighting scheme is sufficient to estimate fiber λǁ, λ⊥, FA, and restricted (correlating with cellularity) and non-restricted diffusion fractions.
Highlights.
99- and 25-direction diffusion encoding schemes performed equally well.
DBSI accurately assessed fiber diffusivity under conditions where DTI failed.
25-direction encoding is sufficient for DBSI analysis in coherent white matter.
25-direction DBSI of mouse optic nerve matched IHC detected pathologies.
Acknowledgements
The authors thank Robert Mikesell for his assistance with the immunization of mice to induce EAE. This study was supported in part by the grants from National Institute of Health R01-NS047592 (S.-K.S.), P01-NS059560 (A.H.C.), National Multiple Sclerosis Society (NMSS) RG 4549A4/1 (S.-K.S.), and Department of Defense Ideal Award W81XWH-12-1-0457 (S.-K.S.).
Footnotes
Publisher's Disclaimer: This is a PDF file of an unedited manuscript that has been accepted for publication. As a service to our customers we are providing this early version of the manuscript. The manuscript will undergo copyediting, typesetting, and review of the resulting proof before it is published in its final citable form. Please note that during the production process errors may be discovered which could affect the content, and all legal disclaimers that apply to the journal pertain.
References
- Alexander DC, Hubbard PL, Hall MG, Moore EA, Ptito M, Parker GJ, Dyrby TB. Orientationally invariant indices of axon diameter and density from diffusion MRI. Neuroimage. 2010;52:1374–1389. doi: 10.1016/j.neuroimage.2010.05.043. [DOI] [PubMed] [Google Scholar]
- Alexander DC, Pierpaoli C, Basser PJ, Gee JC. Spatial transformations of diffusion tensor magnetic resonance images. IEEE Trans Med Imaging. 2001;20:1131–1139. doi: 10.1109/42.963816. [DOI] [PubMed] [Google Scholar]
- Anderson AW, Xie J, Pizzonia J, Bronen RA, Spencer DD, Gore JC. Effects of cell volume fraction changes on apparent diffusion in human cells. Magn Reson Imaging. 2000;18:689–695. doi: 10.1016/s0730-725x(00)00147-8. [DOI] [PubMed] [Google Scholar]
- Assaf Y, Basser PJ. Composite hindered and restricted model of diffusion (CHARMED) MR imaging of the human brain. Neuroimage. 2005;27:48–58. doi: 10.1016/j.neuroimage.2005.03.042. [DOI] [PubMed] [Google Scholar]
- Assaf Y, Ben-Bashat D, Chapman J, Peled S, Biton IE, Kafri M, Segev Y, Hendler T, Korczyn AD, Graif M, Cohen Y. High b-value q-space analyzed diffusion-weighted MRI: application to multiple sclerosis. Magn Reson Med. 2002;47:115–126. doi: 10.1002/mrm.10040. [DOI] [PubMed] [Google Scholar]
- Batchelor PG, Atkinson D, Hill DL, Calamante F, Connelly A. Anisotropic noise propagation in diffusion tensor MRI sampling schemes. Magn Reson Med. 2003;49:1143–1151. doi: 10.1002/mrm.10491. [DOI] [PubMed] [Google Scholar]
- Blewitt ES, Pogmore T, Talbot IC. Double embedding in agar/paraffin wax as an aid to orientation of mucosal biopsies. Journal of clinical pathology. 1982;35:365. doi: 10.1136/jcp.35.3.365-b. [DOI] [PMC free article] [PubMed] [Google Scholar]
- Boretius S, Gadjanski I, Demmer I, Bahr M, Diem R, Michaelis T, Frahm J. MRI of optic neuritis in a rat model. Neuroimage. 2008;41:323–334. doi: 10.1016/j.neuroimage.2008.02.021. [DOI] [PubMed] [Google Scholar]
- Chiang CW, Wang Y, Lin TH, Cross AH, Song SK. Acute visual function impairment in EAE is primarily caused by optic nerve inflammation as assessed by DBSI. Proc Intl Soc Mag Reson Med. 2011;20:3085. [Google Scholar]
- DeBoy CA, Zhang J, Dike S, Shats I, Jones M, Reich DS, Mori S, Nguyen T, Rothstein B, Miller RH, Griffin JT, Kerr DA, Calabresi PA. High resolution diffusion tensor imaging of axonal damage in focal inflammatory and demyelinating lesions in rat spinal cord. Brain. 2007;130:2199–2210. doi: 10.1093/brain/awm122. [DOI] [PubMed] [Google Scholar]
- Gold R, Linington C, Lassmann H. Understanding pathogenesis and therapy of multiple sclerosis via animal models: 70 years of merits and culprits in experimental autoimmune encephalomyelitis research. Brain. 2006;129:1953–1971. doi: 10.1093/brain/awl075. [DOI] [PubMed] [Google Scholar]
- Guy J, Mancuso A, Quisling RG, Beck R, Moster M. Gadolinium-DTPA-enhanced magnetic resonance imaging in optic neuropathies. Ophthalmology. 1990;97:592–599. discussion 599-600. [PubMed] [Google Scholar]
- Hickman SJ, Toosy AT, Jones SJ, Altmann DR, Miszkiel KA, MacManus DG, Barker GJ, Plant GT, Thompson AJ, Miller DH. A serial MRI study following optic nerve mean area in acute optic neuritis. Brain. 2004a;127:2498–2505. doi: 10.1093/brain/awh284. [DOI] [PubMed] [Google Scholar]
- Hickman SJ, Toosy AT, Miszkiel KA, Jones SJ, Altmann DR, MacManus DG, Plant GT, Thompson AJ, Miller DH. Visual recovery following acute optic neuritis--a clinical, electrophysiological and magnetic resonance imaging study. J Neurol. 2004b;251:996–1005. doi: 10.1007/s00415-004-0477-1. [DOI] [PubMed] [Google Scholar]
- Horsfield MA, Jones DK. Applications of diffusion-weighted and diffusion tensor MRI to white matter diseases - a review. NMR Biomed. 2002;15:570–577. doi: 10.1002/nbm.787. [DOI] [PubMed] [Google Scholar]
- Iglesias A, Bauer J, Litzenburger T, Schubart A, Linington C. T- and B-cell responses to myelin oligodendrocyte glycoprotein in experimental autoimmune encephalomyelitis and multiple sclerosis. Glia. 2001;36:220–234. doi: 10.1002/glia.1111. [DOI] [PubMed] [Google Scholar]
- Jensen JH, Helpern JA, Ramani A, Lu H, Kaczynski K. Diffusional kurtosis imaging: the quantification of non-gaussian water diffusion by means of magnetic resonance imaging. Magnetic resonance in medicine : official journal of the Society of Magnetic Resonance in Medicine / Society of Magnetic Resonance in Medicine. 2005;53:1432–1440. doi: 10.1002/mrm.20508. [DOI] [PubMed] [Google Scholar]
- Kim JH, Budde MD, Liang HF, Klein RS, Russell JH, Cross AH, Song SK. Detecting axon damage in spinal cord from a mouse model of multiple sclerosis. Neurobiology of disease. 2006;21:626–632. doi: 10.1016/j.nbd.2005.09.009. [DOI] [PubMed] [Google Scholar]
- Kuo LW, Chen JH, Wedeen VJ, Tseng WY. Optimization of diffusion spectrum imaging and q-ball imaging on clinical MRI system. NeuroImage. 2008;41:7–18. doi: 10.1016/j.neuroimage.2008.02.016. [DOI] [PubMed] [Google Scholar]
- Liu C, Bammer R, Acar B, Moseley ME. Characterizing non-Gaussian diffusion by using generalized diffusion tensors. Magn Reson Med. 2004;51:924–937. doi: 10.1002/mrm.20071. [DOI] [PubMed] [Google Scholar]
- Lodygensky GA, West T, Stump M, Holtzman DM, Inder TE, Neil JJ. In vivo MRI analysis of an inflammatory injury in the developing brain. Brain Behav Immun. 2010;24:759–767. doi: 10.1016/j.bbi.2009.11.005. [DOI] [PMC free article] [PubMed] [Google Scholar]
- Naismith RT, Xu J, Tutlam NT, Scully PT, Trinkaus K, Snyder AZ, Song SK, Cross AH. Increased diffusivity in acute multiple sclerosis lesions predicts risk of black hole. Neurology. 2010;74:1694–1701. doi: 10.1212/WNL.0b013e3181e042c4. [DOI] [PMC free article] [PubMed] [Google Scholar]
- Panagiotaki E, Schneider T, Siow B, Hall MG, Lythgoe MF, Alexander DC. Compartment models of the diffusion MR signal in brain white matter: a taxonomy and comparison. Neuroimage. 2012;59:2241–2254. doi: 10.1016/j.neuroimage.2011.09.081. [DOI] [PubMed] [Google Scholar]
- Papadakis NG, Martin KM, Mustafa MH, Wilkinson ID, Griffiths PD, Huang CL, Woodruff PW. Study of the effect of CSF suppression on white matter diffusion anisotropy mapping of healthy human brain. Magn Reson Med. 2002;48:394–398. doi: 10.1002/mrm.10204. [DOI] [PubMed] [Google Scholar]
- Pasternak O, Sochen N, Gur Y, Intrator N, Assaf Y. Free water elimination and mapping from diffusion MRI. Magn Reson Med. 2009;62:717–730. doi: 10.1002/mrm.22055. [DOI] [PubMed] [Google Scholar]
- Qi X, Lewin AS, Sun L, Hauswirth WW, Guy J. Suppression of mitochondrial oxidative stress provides long-term neuroprotection in experimental optic neuritis. Invest Ophthalmol Vis Sci. 2007;48:681–691. doi: 10.1167/iovs.06-0553. [DOI] [PubMed] [Google Scholar]
- Scherrer B, Warfield SK. Parametric representation of multiple white matter fascicles from cube and sphere diffusion MRI. PloS one. 2012;7:e48232. doi: 10.1371/journal.pone.0048232. [DOI] [PMC free article] [PubMed] [Google Scholar]
- Schmierer K, Wheeler-Kingshott CA, Boulby PA, Scaravilli F, Altmann DR, Barker GJ, Tofts PS, Miller DH. Diffusion tensor imaging of post mortem multiple sclerosis brain. NeuroImage. 2007;35:467–477. doi: 10.1016/j.neuroimage.2006.12.010. [DOI] [PMC free article] [PubMed] [Google Scholar]
- Song SK, Sun SW, Ramsbottom MJ, Chang C, Russell J, Cross AH. Dysmyelination revealed through MRI as increased radial (but unchanged axial) diffusion of water. NeuroImage. 2002;17:1429–1436. doi: 10.1006/nimg.2002.1267. [DOI] [PubMed] [Google Scholar]
- Stanisz GJ, Szafer A, Wright GA, Henkelman RM. An analytical model of restricted diffusion in bovine optic nerve. Magn Reson Med. 1997;37:103–111. doi: 10.1002/mrm.1910370115. [DOI] [PubMed] [Google Scholar]
- Stolzenburg JU, Reichenbach A, Neumann M. Size and density of glial and neuronal cells within the cerebral neocortex of various insectivorian species. Glia. 1989;2:78–84. doi: 10.1002/glia.440020203. [DOI] [PubMed] [Google Scholar]
- Sun SW, Liang HF, Cross AH, Song SK. Evolving Wallerian degeneration after transient retinal ischemia in mice characterized by diffusion tensor imaging. Neuroimage. 2008;40:1–10. doi: 10.1016/j.neuroimage.2007.11.049. [DOI] [PMC free article] [PubMed] [Google Scholar]
- Sun SW, Liang HF, Trinkaus K, Cross AH, Armstrong RC, Song SK. Noninvasive detection of cuprizone induced axonal damage and demyelination in the mouse corpus callosum. Magn Reson Med. 2006;55:302–308. doi: 10.1002/mrm.20774. [DOI] [PubMed] [Google Scholar]
- Tu TW, Budde MD, Quirk JD, Song SK. Using absorption-mode images to improve in vivo DTI quality. Proc Intl Soc Mag Reson Med. 2010;18:4001. [Google Scholar]
- Vellinga MM, Engberink RDO, Seewann A, Pouwels PJW, Wattjes MP, van der Pol SMA, Pering C, Polman CH, de Vries HE, Geurts JJG, Barkhof F. Pluriformity of inflammation in multiple sclerosis shown by ultra-small iron oxide particle enhancement. Brain. 2008;131:800–807. doi: 10.1093/brain/awn009. [DOI] [PubMed] [Google Scholar]
- Wang Y, Wang Q, Haldar JP, Yeh FC, Xie M, Sun P, Tu TW, Trinkaus K, Klein RS, Cross AH, Song SK. Quantification of increased cellularity during inflammatory demyelination. Brain : a journal of neurology. 2011;134:3590–3601. doi: 10.1093/brain/awr307. [DOI] [PMC free article] [PubMed] [Google Scholar]
- Wedeen VJ, Hagmann P, Tseng WY, Reese TG, Weisskoff RM. Mapping complex tissue architecture with diffusion spectrum magnetic resonance imaging. Magnetic resonance in medicine : official journal of the Society of Magnetic Resonance in Medicine / Society of Magnetic Resonance in Medicine. 2005;54:1377–1386. doi: 10.1002/mrm.20642. [DOI] [PubMed] [Google Scholar]
- Werring DJ, Clark CA, Barker GJ, Thompson AJ, Miller DH. Diffusion tensor imaging of lesions and normal-appearing white matter in multiple sclerosis. Neurology. 1999;52:1626–1632. doi: 10.1212/wnl.52.8.1626. [DOI] [PubMed] [Google Scholar]
- Zhang H, Schneider T, Wheeler-Kingshott CA, Alexander DC. NODDI: practical in vivo neurite orientation dispersion and density imaging of the human brain. Neuroimage. 2012;61:1000–1016. doi: 10.1016/j.neuroimage.2012.03.072. [DOI] [PubMed] [Google Scholar]