

Abstract
Protein-protein interactions mediate essentially all biological processes. Despite the quality of these data being widely questioned a decade ago, the reproducibility of large-scale protein interaction data is now much improved and there is little question that the latest screens are of high quality. Moreover, common data standards and coordinated curation practices between the databases that collect the interactions have made these valuable data available to a wide group of researchers. Here, I will review how protein-protein interactions are measured, collected and quality controlled. I discuss how the architecture of molecular protein networks have informed disease biology, and how these data are now being computationally integrated with the newest genomic technologies, in particular genome-wide association studies and exome-sequencing projects, to improve our understanding of molecular processes perturbed by genetics in human diseases.
Keywords: Protein-protein interactions, complex human diseases, genetics and proteomics
Introduction
Genetics has been enormously successful in mapping most genes in humans and other organisms 1,2, in identifying genetic variation across populations 3,4, and in identify thousands of genomic loci associated with risk for disease 5 and reviewed in 6. With the advent of whole-genome sequencing it has furthermore become possible to identify genetic variants that specifically alter protein function and associate these variants with diseases states [reviewed in 7]. However, understanding how the thousands of identified genomic variants affect complex biological mechanisms remains a major challenge and limits our progress towards biological understanding and therapeutic intervention.
With the increase in large-scale methods to map functional associations between genes (e.g., through gene expression correlations, text mining associations, protein-protein interactions, synthetic lethality relationships) many data sets are now being viewed as networks where genes are represented as nodes, and nodes are connected by edges if there is evidence for functional correlations between the nodes in question in one of the aforementioned data types. This has made it clear that most genes exert their function by collaborating with other genes in molecular networks which represent rigid molecular machines, cellular structures, or dynamic signaling pathways 8. The functional correlation between genes and their neighbors in molecular networks, has led to a new paradigm where it is hypothesized that perturbations of entire molecular networks by genomic and environmental influences are driving common and rare diseases 9. To leverage this hypothesis many approaches have been applied where genes in close genomic proximity to incriminated genetic variants are tested for their tendency to assemble into complicated biological networks that do not necessarily fit the mold of conventional pathway definitions. Although these approaches can be applied to many types of functional genomics data, protein-protein interaction networks have emerged as a powerful resource to complement genetic data in order to elucidate biological systems affected in disease 10-19.
While protein-protein interactions have many applications, this review will focus on presenting an overview of the generation and architecture of protein-protein interaction networks, and the implication of these networks in current attempts to interpret genetic data and understanding the molecular basis of human diseases.
2) Mapping and interpreting protein-protein interaction networks
2.1) Background
Since the turn of the millennium when it became technically feasible to elucidate large-scale protein-protein interaction maps (meaning hundreds of proteins systematically tested for thousands of interactions), many properties of these networks and their nodes have been discovered. Not surprisingly the first networks were generated in S.cerevisiae in 2000, soon to be followed in D.melanogaster, C.elegans, and H.sapiens (in 2003, 2004, and 2005, respectively) (Table 1).
Table 1.
Large Scale Protein-Protein Interaction Screens in Eukaryotic organisms
| Method | Organism | Interaction | Reference |
|---|---|---|---|
| Y2H | A.Thaliana | Pairwise interaction | 93 |
| Y2H | S.cerevisiae | Pairwise interaction | 94 |
| Y2H | S.cerevisiae | Pairwise interaction | 95 |
| AP-MS | S.cerevisiae | Protein complex | 96 |
| AP-MS | S.cerevisiae | Protein complex | 97 |
| AP-MS | S.cerevisiae | Protein complex | 29 |
| AP-MS | S.cerevisiae | Protein complex | 34 |
| PCA | S.cerevisiae | Pairwise interaction | 23 |
| Y2H | C.Elegans | Pairwise interaction | 68 |
| Y2H | D.Melanog. | Pairwise interaction | 69 |
| AP-MS | D.Melanog. | Protein complex | 98 |
| Y2H | H.Sapiens | Pairwise interaction | 99 |
| Y2H | H.Sapiens | Pairwise interaction | 100 |
| AP-MS | H.Sapiens | Protein complex | 101 |
| AP-MS | H.Sapiens | Protein complex | 102 |
| AP-MS | H.Sapiens | Protein complex | 103 |
Two major approaches have been applied: Yeast-two-hybrid (Y2H), where a functional assay is used to probe the potential interactions between two proteins [described in detail in 20 and reviewed in 21]; and affinity purification followed by mass spectrometry [AP-MS, reviewed in 22]. Other approaches such as protein complementation assays (PCA) have also been used with success 23. Although out of the scope of this review to go into detail with these methods, it is important to stress they are fundamentally different and in the network data they produce. Y2H and PCA interrogates direct interactions between two proteins, and AP-MS uses direct affinity between a bait protein and other proteins present in a biological sample to “pull down” interacting proteins, the precise identity of which can then be identified using mass spectrometry. The Y2H and PCA approach readily enables the cataloging of direct binary interactions, which is more complicated using AP-MS, where it is not known whether proteins “pulled down” with the bait are direct or indirect interaction partners. On the other hand, Y2H does not readily allow the identification of interactions that only occur in the presence of indirect interaction partners.
The lack of concurrence between interactions reported by the different methods early on was taken as an indication that neither of these methods worked particularly well 24. However, not only have the methods improved over the years 21,22, it is increasingly being recognized that the different methods are complementary and that interactions captured by each method are biologically valid despite diverging 25.
2.2) Coverage and quality of protein-protein interaction networks
Several methods have aimed to calculate the total amount of interactions in an organism, which would help to estimate the coverage of the current data sets. In yeast different groups have arrived at estimates from 20,000 to 40,000 interactions between 6,000 proteins 26-28 illustrating the difficulties of precisely assessing these numbers. These problems are likely to arise from a number of issues such as how to combine information from Y2H and AP-MS experiments, as well as the knowledge that interactions of a protein can be highly dynamic and depend on the growth condition of the cell in question 29, and the specific tissue being analyzed 18,30,31. For this reason the estimates of the amounts of interactions in humans have also varied extensively from ~150,000 to >500,000 32,33.
Similarly, it has been difficult to estimate the accuracy of protein-protein interaction data due to its heterogeneity and in many cases adequate reference data sets: Because protein-protein interaction screens in many cases is identify new interactions, missing overlap between newly identified interactions and those reported in the literature does not necessarily imply that the new interactions are false positives. Earlier false positive rates for AP-MS approaches were estimated to be 10-40%, and reproducibility in the order of 60-85% 29,34. However, Varjosalo et al., recently reported that the reproducibility of AP-MS based interactions were in >95% in the same lab, and >80% when two different labs used standardized protocols to map interactions. It was also shown that the discrepancy between reproducibility within and in-between laboratories was likely due to differences in sample handling and preparation 35. Moreover, recent Y2H and PCA approaches have been suggested to reach false positive rates of <5% 23,27. Although the latter estimates are likely optimistic, and the best way to accurately measure the false positive rates from these studies is still being debated, there is consensus that the newest interaction screens are of high quality and have considerably reduced false positive and false negative interactions compared to earlier studies 22,25,36.
2.3) Protein-protein interaction databases
Some protein-protein interaction databases simply record interactions from the literature and make them available to the community in a structured manner. Others focus on predicted interactions, or on mapping interactions experimentally determined in one organism to homologous proteins in another. As of September 2013 the pathguide resource lists more than 125 protein-protein interaction databases 37. Most of these are independently run and funded, and do not coordinate their curation practices, or their efforts to make data available to the community. For these reasons, it is very difficult to know the precise nature of the interactions users extract from these repositories, what the quality of the data is, and which organism the data originally comes from. Another layer of complexity is added by different policies between databases in how to report interactions between proteins where the constructs come from different organisms. Where most databases report the data to come from two organisms, others map the interactions to a single species, e.g., Human Protein Reference Database (HPRD) 38. Additionally, it is the policy of some databases to only curate the subset of data from an article that falls into the databases particular area of focus, where others systematically curate all data in the publication in question.
To address these challenges, a handful of the most prominent databases - Database of Interacting Proteins (DIP) 39, IntAct 40, Molecular Interaction Database (MINT) 41, MatrixDB 42, Microbial Protein Interaction Database (MPIDB) 43, InnateDB 44, Interologous Interaction Database (I2D) 16, and Molecular Connections (http://www.molecularconnections.com) - have created the International Molecular Exchange (IMEx) consortium 9, to make a unique set of protein interactions available from a single web portal (http://www.imexconsortium.org), and to develop common curation and data presentation practices. In 2011 48% of the publications curated by any database in this consortium was made available on the IMEx consortium webpage 9, and this number is likely to increase in the coming years.
Attempts to quantify the reliability of the curation process between databases, led to the dismal estimate that the agreement between interactions curated from the same literature by different databases was in the order of 55%, and that proteins were correctly identified in only 71% of the cases 45,46. However, in response to these numbers the databases being scrutinized engaged in a recuration effort to firmly establish that curation mistakes only apply to 2%-9% of the data in question 47, and that many errors reported by Cusick et al., were , in fact, not curation mistakes, but related to disagreements on terminology that describes different types of interactions, and what it means to provide a curated data set. This debate highlights important issues regarding protein-interaction data, its related semantics, and the misalignment between the output provided by the protein interaction databases and community expectations of the curated data. The databases in the IMEx consortium provide the data that is available in the literature in a principled format without assessing its quality. In some cases users believe that curated data is equivalent to high-confidence data, and that the curation process is a quality filter, which is not the case (nor should it be). Simultaneously, the recuration effort showed that, although mistakes undoubtedly occur, they are not commonplace and mostly at a low and acceptable level. Looking ahead, as efforts like the IMEx consortium gain even more traction curation practices will undoubtedly improve, as will the information to the users about the specific details of the invaluable data provided by the databases.
2.4) Global integrated protein-protein interaction networks
Although there are challenges to integrating protein interaction data from multiple sources, it has been shown consistently that integrating many different data sets computationally, and devising probabilistic scores for the interactions based on a variety of schemes can lead to very high accuracy when these integrated networks are thoroughly benchmarked 18,19,24,26,48. Perhaps more importantly, integrated protein-interaction networks have in many cases provided high quality predictions of new biology that in can be confirmed through follow up experiments for example by identifying unexpected genes involved in pancreatic biology and type 1 diabetes 15,40 by identifying novel nucleolar proteins 49, by identifying unexpected proteins involved in heart development and congenital heart diseases 30,50, by identifying new components of FGF signaling that were mutated in patients with congenital hypogonadotrophic hypogonadism 51, by elucidating in vivo phosphorylation networks 52, and by identifying networks and proteins involved in autoimmune diseases 12,13. These examples suggest the biological value and importance of integrated networks as a framework for understanding complex phenotypes and to augment and interpret large-scale data sets emerging from the genetic and genomics communities.
For these reasons it is not surprising that a number of different resources are available that provide integrated networks of protein-protein interactions in many cases combined with other data types. A non-exhaustive list includes InWeb 19, GeneMANIA 53, Funcoup 17, I2D 54, PINA 55, ConsensusPathDB 56, STRING 48, and IMEx consortium 9, and mentha 57
It is out of the scope of this review to go into an in depth comparison of these different resources, but I recommend interested users to carefully asses at least the source of the data in the different databases, their approach to quality controlling and scoring the underlying data, and that users know exactly what the biochemical interpretation of an edge is for the different networks. The latter is important because many of the networks resulting from these and other databases are commonly misinterpreted to be based strictly on protein-protein interaction data although they in many cases are a mix of protein-protein interactions, regulatory associations, synthetic lethality relationships, pathway co-occurrence, and text-mining associations. To our knowledge only InWeb, IMEx consortium, mentha, I2D and PINA exclusively use protein-protein interaction data to produce networks. If the objective of creating a network is to identify all possible functional associations between a gene of interest and other genes, including many types of functional association data in the network may be an advantage because of increased coverage. However, the increase in coverage comes at the cost of a more ambiguous interpretation of what the network means from a biochemical and molecular biology perspective. Moreover, since the point of many network analyses is not only to annotate functional associations between genes of interest, but to inform specific follow-up experiments, it can be an advantage to constrain the network building to physical protein interactions. Not only are these interactions often the most informative backbone of the network in question, in the case that an interesting network is identified it will be immediately clear that a Y2H or AP-MS experiment centered on interesting network nodes, will be a means to validate, consolidate, and expand the network in question to get added insight into its molecular biology.
2.4) Properties and terminology of protein-protein interaction networks
With the emergence of large-scale protein-protein interaction networks the data were amenable to scrutiny using tools borrowed from mathematical network theory. These analyses showed that the distribution of interactions follow specific graph-theoretical laws, where the probability of observing a protein with a small number of interactions (~5) is high, and the probability of observing a protein with many (>100) interactions is low. In other words, most proteins have a small amount of interactions, and a few proteins have hundreds of interactions. A plot of the amount of interactions for a given protein against the probability of observing a protein with this amount of interactions will follow a downward sloping straight line in a double logarithmic plot, which is termed a power-law distribution (Figure 1) in graph theory 8. Although this concept may seem abstract, it usually becomes more intuitive when we consider social networks like Facebook (https://www.facebook.com/) or LinkedIN (https://www.linkedin.com/) where a small percentage of people have thousands of connections and but most have several orders of magnitude fewer. The distributions of peoples Facebook friends, or LinkedIN connections also follow a power law, and would be depicted as a straight line in a double logarithmic plot.
Figure 1. Properties of protein-protein interaction networks.

The properties of random networks (A), scale-free networks (B), and hierarchical networks (C). Protein networks are also called scale free, because it is not possible to define a meaningful average node in these networks. Plotting the degree k of nodes in protein interaction networks against the probability of observing that degree P(k), follows a power law (Bb). In these networks the clustering coefficient C(k) does not change as the function of the nodes degree (Bc), meaning that nodes with few interactions and a lot of interactions alike tend to participate in highly connected topological modules in the network. These properties are different for random networks (Aa, Ab, Ac) where edges are randomly distributed across nodes, and hierarchical networks (Ca, Cb, Cc), where clusters are united in an iterative manner. Figure is reproduced from 8 with permission.
Nodes with the highest amount of interactions in a network are often referred to as ‘hubs’. In protein networks, some hubs tend to form physical interactions with all of their interaction partners at the same time and place (and have been called party hubs), while others engage in piecemeal interactions one at a time in different cellular locations (termed date hubs) 58, although it should be noted that the biological validity of these terms has been extensively debated 59-61.
What is commonly accepted is that most networks are ‘small world’, meaning that there is a relatively short distance between any pair of nodes 62. Additionally, they show a high degree of clustering, meaning that the interaction partners A and B of a given protein S often interact with each other too 8,63,64. In social networks this translates to the more intuitive notion that the friends A and B of person S are likely to also be friends with each other due to the social behavior of humans. The biological interpretation of a high degree of clustering in the networks is that proteins, like most people, like to work in groups to execute their function. This biological organization has important implications for molecular biology in that clustering in the network leads to topological modules where proteins are more connected to each other than to the rest of the network (Figure 2a), and it turns out that these topological modules represent groups of nodes that have a common biological role such as being different members in a biological pathway, rigid architectural structure, or molecular machine (Figure 2b). For this reason, running clustering algorithms on protein networks can in many instances retrieve known functional modules such as the exosome or ribosome, and in some cases - in a purely data driven manner - add new proteins to these, or identify modules that were not previously known 49,65,66. As I will discuss in section 3, the organization of protein-protein interaction networks also has important implication for human diseases.
Figure 2. The modular organization of protein-protein interaction networks.
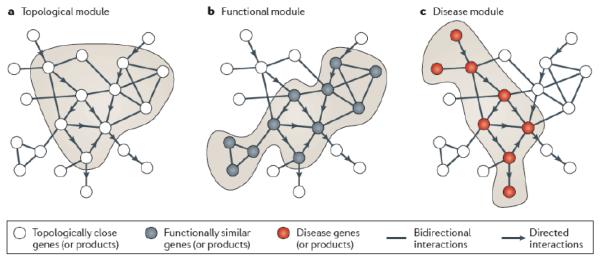
Protein interaction networks have topological modules in which proteins are more connected to each other than to the reset of the network (a). These represent genes in the same pathways, molecular machines, or rigid architectural structures, i.e., functional modules (b). This has implications for human disease biology, as genes involved in the same disease tend to fall into the same clusters or functional modules. Modules enriched for genes from a particular disease are termed disease modules (c). Figure is reproduced from 104 with permission.
2.5 Future challenges measuring cell-type specific interactions and estimating the size of the full human interactome
Despite the clear value of having cell-type specific interactomes, so far no efforts have been launched to generate such a resource. Therefore, it remains unclear what the variations in the interactions of a given protein or functional module will be across different cell types and what this will tell us about the size of the human interactome.
The question of the size of the full interactome given the knowledge about interactions in a handful of cellular contexts, is in many ways is similar to the question of the size of the Internet given the indexation of pages from different search engines that was of major debate in the late 1990’ies. To gain insight engineers proposed to use relative size and overlap analyses from different search engines to approximate these numbers ( http://www7.scu.edu.au/1937/com1937.htm ). Similar approaches could be employed to interaction data both to compare the similarity of different cellular interactomes as well as to estimate the completeness of existing generic networks. For example, the relative size of the experimentally derived network for a bait A of interest across 10 cellular contexts (Aexp1-10) compared to the network of A in InWeb19 (Ainweb) is the fraction of Aexp1-10 in Ainweb, which can formally be expressed as:
Where Pr(Aexp1-10) represent the probability that an interaction of A is seen experimentally in any of the 10 cell contexts, and Pr(Aexp1-10 AInWeb ∣ Aexp1-10) represent the conditional probability that an element belongs to both sets given that it belongs to Aexp1-10. Similar analyses can be carried out for other networks of A (e.g., in Astring, and Amentha in STRING67 and mentha57, respectively), which will enable us to determine 1) the relative completeness of the experimental data in the 10 cell contexts compared to existing interaction data, and 2) the overlap between experimentally derived data and literature-based networks. Furthermore, analogous comparisons of the individual cellular networks (e.g., A1 vs A2) will provide answers to the variability between cell types.
Although this type of analyses will not provide a definitive answer on the total amount of interactions in humans, it will give us much more precise estimates of the completeness of existing data sets, the coverage of the interactions of a protein in a given cell type, and provide insight into where existing networks are close to saturation versus where they are sparse.
The technology to carry out these experiments is available, and we should in the near future begin to see these types of analyses emerge in the literature.
3) Protein-protein interaction networks for understanding complex diseases and phenotypes in humans
As large-scale protein interaction maps became available, it was soon noticed that genes involved in similar phenotypes often interacted physically at the level of proteins in model organisms 66,68,69, and in humans 70,71. These discoveries had obvious implications for human genetics, because at the time there were more than 800 linkage intervals reported in the online Online Mendelian Inheritance in Man database [(OMIM) McKusick-Nathans Institute of Genetic Medicine, Johns Hopkins University (Baltimore, MD) (http://omim.org/)], without an obvious candidate gene, and prioritizing genes in these intervals for follow up validation was a major challenge. The logic was straightforward even if the analysis of interaction data wasn’t: Perhaps it would be possible to systematically analyze protein networks and identify disease modules (that represent pathways or protein complexes) in which several members were known to cause a particular disease (e.g., Alzheimer’s disease)(Figure 2c). In this case non-disease associated members of that module would make good candidates in that disease, in particular if a gene encoding one of these proteins was located in a linkage interval associated with Alzheimer’s .
A barrage of methods that capitalized on several different network-based strategies has now been published. A comprehensive review of these methods has been written by Moreau and Tranchevent 72, and here we will only focus on a subset of the earliest methods that used protein networks as part of the approach, as they laid the foundation and framework for most of the subsequent methods detailed in this reivew. In addition to the methods mentioned in Moreu and Tranchevent, I encourage readers interested in other methods to familiarize themselves with Gene Relationships Among Implicated Loci (GRAIL) 73 and Meta-Analysis Gene-set Enrichment of variant Associations (MAGENTA) 74 which use text mining networks, and pathway mining techniques, respectively, to analyze genetic data.
3.1) Using protein networks to prioritize linkage intervals
The first method by Oti et al., 71 relied on unscored binary interaction pairs to identify candidates in a linkage interval that interacted with proteins coded by genes known previously to be involved in in completely identical diseases. Others incorporated unscored human protein interaction data and other functional association data types into a network where edges could represent both protein interactions as well as other functional connections between the genes 75,76, and these two latter methods did not take advantage of cross-species integration of interaction data. Another approach was to map genes in linkage intervals to protein complexes, and, by systematically text mining of human disease descriptions, to rank the protein complexes based on the diseases represented in these complexes (Figure 3) 19. In the community, there was considerable surprise that these methods could accurately identify known disease genes even when knowledge contaminated data (i.e., data that was potentially derived after the identification of the disease gene the method was trying to identify), was removed from the procedure 19,75,76. The validity of several of these approaches was further confirmed when they successfully identified new unexpected genes involved in type 1 diabetes 40, and congenital heart diseases 67.
Figure 3. Using protein complexes to prioritize genes in linkage intervals.

First, a virtual pull-down of each candidate gene is executed by querying a protein interaction network for interactors of the candidate. Each complex is named the candidate complex. Second, proteins for which the corresponding gene is known to be involved in a disease are identified in the candidate complex, and the phenotypic similarity of diseases represented in the complex and the disease related to the linkage interval are compared using a computational phenotype similarity score. In this case, proteins that are involved in different disorders comparable to Leber congenital amaurosis are colored according to their clinical overlap with this disease. The last step involves scoring and ranking the candidates by the Bayesian predictor. Each candidate is scored based on phenotypes associated with the proteins in the candidate complex, and all candidates in the interval are ranked based on this score. Figure is reproduced from 19 with permission.
3.2) Integrating genome-wide association studies and protein networks for biological discovery
The advent of genome-wide association studies (GWAS) 77, led to the discovery of many single nucleotide polymorphisms (SNPs) associated with phenotypic states. In the most straightforward implementation GWAS compares the frequency of SNP alleles between cases and controls. However, due to linkage disequilibrium in the human genome (i.e., correlation between variants that are in close genomic proximity), a cost efficient strategy is to define a set of proxy SNPs that each represents genomic regions that can harbor tens of genes. In this way the result of a GWAS is the association of SNPs that represent different genomic regions, with little or no information as to which genes in these regions (if any) are likely to be the underlying biological cause of the association signal.
To mitigate this challenge several methods have integrated GWAS loci and protein-interaction data to identify networks of proteins in these loci that interact more than a random expectation. Rossin et al., 13 developed disease association protein-protein link evaluator (DAPPLE, www.broadinstitute.org/mpg/dapple/) to show that proteins encoded in Crohn’s disease and rheumatoid arthritis physically interact to suggest specific biological processes and candidate genes in incriminated loci. This algorithm has become widely used in the genetics community and has for example also been used to analyze data from inflammatory bowel diseases 16 and type 2 diabetes 17 (Figure 4). Similarly, Bergholdt et al., integrated protein-protein interactions and GWAS data to identify candidate genes in type 1 diabetes 15. Another interesting integration of protein networks and GWAS data was Hanum et al., 78, who integrated GWAS data and protein complexes in yeast to identify genetic interactions that informed areas of yeast biology that were not well covered by earlier screens. Together, these analyses have revealed that genes in loci associated to a phenotype through GWAS have a tendency to physically interact in networks that begin to highlight the biology underlying some of the phenotypes in question.
Figure 4. Augmenting and interpreting GWAS data using protein-protein interaction networks.
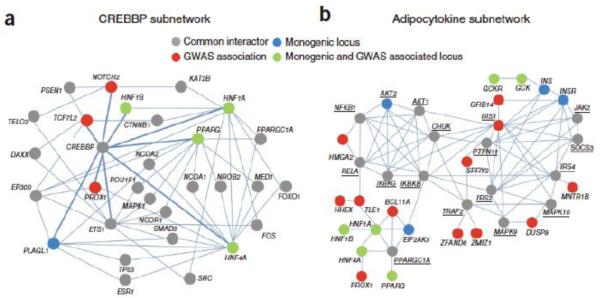
The systematic integrating GWAS loci, individual type-2-diabetes related genes, and protein interaction networks, revealed a CREBBP network (a) and an Adipocytokine network (b). Figure reproduced from 105 with permission.
Alternative ways of combining GWAS studies and protein networks have been proposed by Califano et al. 9, who argue that pathway-wise association studies - where association signal is tallied across pathways - is a way to augment GWAS data, and to improve the low signal-to-noise relationships in these studies. As one of the major advantages to GWAS studies are that they are not biased by prior assumptions about the biology of a disease, these approaches the most attractive if the genetic signal can be complemented and constrained by similarly unbiased protein network data enabling us to identify unexpected or de novo pathways involved in common complex disorders. Methods such as the ones proposed above become increasingly feasible as large-scale methods to map protein networks evolve.
Although it is interesting to make an annotation of the potential pathways spanning loci discovered in GWAS studies, it is more exciting if network-based approaches can also predict new biology relevant to these diseases in question. For example, Rossin et al., 13 showed that a network spanning Crohn’s disease loci from one of the earliest GWAS studies, significantly predicted several genetic variants that were discovered in a later meta analysis of several Crohn’s disease GWAS’, and where the prediction could not in any way have been knowledge contaminated. Similarly, Bergholdt et al 15, followed up on specific genes that were predicted to be involved in type 1 diabetes based on their interaction patterns. Expression profiling in human pancreatic islets exposed to pro-inflammatory cytokines, identified cytokine-regulated genes in these networks likely to play an important role for type 1 diabetes in pancreatic islets.
Most disease-associated SNPs have turned out to affect regulatory regions, rather than reflecting protein-coding changes. As such most genetic variation underlying common complex phenotypes probably affect proteins by the expression level of the corresponding mRNA79. Not only are common variants known to affect transcript levels, but a recent article shows that common variants in many cases correlate with protein abundance 80. Given that protein networks significantly connecting GWAS loci have been observed repeatedly, these observations raise the question how protein networks are affected by regulatory variants in human populations, which currently remains an open question. It is conceivable that changes in protein abundance of network members contribute to a subtle change in information flow in these networks, but future experiments will have to be carried out to test such a hypothesis, and it remains an exciting area of investigation.
Despite our lack of insight into how common variants directly affect the composition and function of cellular protein networks, it is now clear that combining GWAS data and protein networks offer exciting avenues to interpreting association data, informing biology, and gaining molecular insight into common complex disorders.
3.3) Interpreting exome sequencing data using protein networks
As it became feasible to sequence the protein-coding portion of the genome (the exome) using next-generation sequencing many common and rare exome variants have been reported 7. Interpreting this deluge of data poses analogous, but conceptually different, problems as the challenges of interpreting GWAS association signals. GWAS produces a set of common variant loci that are significantly associated to the phenotype in question, but where the specific gene relevant to the association signal is unknown. In contrast, exome-sequencing points to specific genes harboring the identified genomic variants, but there is very rarely a single genetic variant that is significantly associated to the phenotype being analyzed. Where GWAS identifies sets of genes lying in a region significantly associated with the phenotype, exome sequencing identifies a list of genes where no one in particular has a very strong statistical signal. Also here, there have been notable successes in interpreting genetic data using protein interaction networks.
Two studies analyzing the rates and patterns of exonic de novo mutations in patients with autism spectrum disorders independently showed that genes harboring these mutations significantly interact at the level of proteins in a chromatin remodeling network 11,81 (Figure 5). Where Neale et al., used the protein interaction network InWeb 18,19 combined with the DAPPLE algorithm 13 to identify their network, O’Roak et al., used GeneMANIA 53 and created their own null models based on simulations 11. Importantly, the patients sequenced to identify de novo mutations were different. Despite using different cohorts, different protein networks, and different statistical methods, both analyses converged on the same biology hereby serving as each other’s validation that the biology of chromatin remodeling plays an important role in the pathogenesis of autism which was completely unexpected.
Figure 5. De novo exome mutations reveals a significant chromatin remodeling network in autism spectrum disorders.

Genes that harbor de novo mutations in patients with sporadic autism spectrum disorders, significantly interact at the level of proteins, revealing a chromatin remodeling network (the sub network including SMARCC2). Proteins are colored based on the significance of their interactions with other proteins in which de novo mutations were found as determined by the DAPPLE algorithm using protein interactions from InWeb. Figure is reproduced from 81 with permission.
3.4) Other applications
Besides interpreting and augmenting linkage intervals, GWAS loci, and genetic variants resulting from exome-sequencing studies, protein networks have been applied in many ingenious ways to gain insight into the architecture of complex human phenotypes.
An early study analyzed the interactions of proteins involved in human ataxias to gain understanding of their biological interdependencies and to map their links to known neurodegeneration proteins 82. To my knowledge this was the first large-scale systematic experimental protein-protein interaction map of a human disease and showed that ataxia-related proteins interacted with each other to a much higher degree than one would expect by random.
Due to the technical limitations of generating protein networks associated with diseases in humans more generally, we used InWeb to identify 1,524 protein complexes involved in more than 1,000 specific human diseases, and added tissue resolution to these complexes using gene expression data 18. When we plotted the expression signature of each complex with data on which tissues were affected if members of the complex were mutated, we observed a significant correlation, illustrating that disease complexes exhibit tissue-specific signatures both in terms of expression and pathological manifestations, and that these signatures converge on a specific spatio-temporal location in the human organism where the complex has its most important function. Although our analysis relies on integrated protein-protein interaction data from many studies, the reported complexes are of similar quality than the major experimental screens in Eukaryotes. Using a computational approach we circumvented some of the challenges of experimentally generating and analyzing thousands of complexes across hundreds of human diseases and tens of tissues, and made the resulting compendium available online (www.cbs.dtu.dk/suppl/dgf).
Even though it is convenient to categorize genetic risk factors based on the methodology that identifies them, and risk factors within these categories are almost always analyzed in isolation, it is conceivable that large protein networks can be perturbed copy number variants (CNVs), exomic variants, SNPs, and environmental influences that in some combinatorial way drives a particular disease. Therefore, analyzing many different categories of risk factors in combination using an integrated approach could shed new light on the biology of a disease. This hypothesis has been supported by studies of congenital heart diseases 50,83, and schizophrenia 84, where large networks - that do not fit into the definitions of existing biological pathways - driving heart and neurodevelopment, respectively, have been shown to be perturbed by heterogeneous genetic risk factors. These analyses support the hypothesis by Califano et al., that large molecular networks are drivers of diseases while simultaneously highlighting specific genes and genetic risk factors for functional follow up studies.
Exciting new understanding of how vira hijack the machinery of human cells during human immune deficiency (HIV) infections have emerged by analyzing the protein-protein interactions of viral and human proteins 85,86. Similarly, analyzing how DNA tumor virus proteins interact with human proteins have also recently been used to better separate cancer driver from passenger mutations showing that mutations arising in human tumors converge on proteins also targeted by the aforementioned vira 10.
Finally, analyzing how disruption of single edges in a protein interaction network affects biology and the role that these types of perturbations play in human Mendelian disorders has recently come under scrutiny 87-89. These analyses that capitalize on integrating genetic data with structurally resolved protein interaction networks suggest that many in-frame missense mutations observed in Mendelian disorders disrupt protein domains responsible for mediating specific edges in a protein interaction network. This is an exciting discovery, which will improve our molecular-resolution understanding of the function of genetic variants and hopefully enable us to incorporate this type of information into drug discovery and treatment strategies.
Outlook
There is little doubt that the newest protein-protein interaction platforms provide data of high quality, and over the last years, standards for reporting protein-protein interaction data, as well as the agreement on common curation practices have been established enabling the data to be available in structured databases in a uniform manner.
Despite these advances, progress towards a molecular level understanding of many diseases, and the effect of specific disease alleles in human populations are currently limited by a number of factors. These factors include incomplete understanding of protein interaction data in humans, as well as tools to explore these networks and to integrate genetic and proteomic data. As one example of areas in which the analysis of protein networks must improve is statistical testing. While the field of statistical genetics is relatively mature and has reached some community standards for interpreting and reporting robust genetic findings, the field of network analyses and integration is currently in its infancy. For example, while some algorithms like DAPPLE 13, GRAIL73, MAGENTA 74, all account for the haploblock structure of the human genome, as well as the differences in size of the genes in the proximity of SNPs that are used as the starting point of the analysis (gene size correlates with SNP association statistics as larger genes will have a higher probability of being close to a SNP with low association P values), it remains unclear from the description of many other analogous methods if they correct for such confounders. Not only is the correct integration with genetic data important, network-based methods also need to take into consideration the data structure of the networks that they rely on (e.g., degree distribution of genes). Finally, it is often not clear whether the output P-values of network-based algorithms have been properly adjusted for multiple hypothesis testing which leads to ambiguity in the interpretation of their results. Therefore, analogously to the developments in genetics, we need – as a community – to develop and agree on statistical tools and methods that are reliable and take into consideration the inherent interconnectedness of molecular protein networks. We also need to define a standard for identifying statistically robust findings in these networks, for integrating with complicated genetic data sets, and for presenting these data to non-expert users in a intuitive way.
Current interaction networks are generic and static meaning that they are not generated or assembled under the condition of a specific cellular context or across multiple time points and growth conditions of the cell in question. Nor do the interaction networks contain information about which protein isoform that mediates a specific interaction. For many of the purposes mentioned in this review it would be optimal to derive high-resolution cell- specific interaction networks that cover all context-specific interactions. Proteomic technologies are evolving quickly, and have become significantly more cost efficient in the last years. In theory it is now feasible to imagine the elucidation of a full human interactome across many different cell types, but the scope of such a project is similar in size to the largest recent genomics efforts such as the 1000 Genomes Project3 and the ENCODE project90. To my knowledge this type of community-wide effort has not yet been launched although it has been debated for years91, and it remains unclear when such a data-set will be available.
It also remains unclear how existing algorithms that integrate biological networks and genetic data will perform in the face of large datasets of cell-type specific interaction networks. One could imagine several scenarios: One possibility is to pool all the cell-type specific networks to get a meta-network based on high-resolution experiments. More data could improve the performance of algorithms such as DAPPLE13, or it may create saturated networks (where everything connects to everything) thus drowning out the signal. A way to exploit contextualized interaction data could be to use the algorithms to iteratively test cell-specific interactomes and identify the one that performs best on a user-defined genetic dataset. This would enable a data-driven identification of the cell type that best supports the genetic data from an interactome standpoint, similarly to what has recently been accomplished by combining epigenetic and GWAS data to identify cell-type specific chromatin marks that have the most significant influence on SNPs associated with a number of common complex traits92.
Despite the challenges of interpreting and using protein interaction data, and their lack of cell-specific context, they are now being used widely to understand the molecular basis of disease. As proteomic technology improves and becomes increasingly cost-efficient and scalable, as statistical tools and algorithms to analyze these data become available and standardized, and as geneticists become aware of the power of filtering and integrating their data using protein-protein interactions this work should continue to gain momentum and will be an important piece of the puzzle to understand the molecular biology of human diseases.
Highlights.
Large datasets of reliable protein-protein interactions are now available.
Protein databases collect the data and are new adhering to community standards.
Network modularity has important implications for human genetic diseases.
Network analyses of genetic data identify unexpected biology.
Protein networks have many applications in genomics.
Footnotes
Publisher's Disclaimer: This is a PDF file of an unedited manuscript that has been accepted for publication. As a service to our customers we are providing this early version of the manuscript. The manuscript will undergo copyediting, typesetting, and review of the resulting proof before it is published in its final form. Please note that during the production process errors may be discovered which could affect the content, and all legal disclaimers that apply to the journal pertain.
References
- 1.Lander ES, et al. Initial sequencing and analysis of the human genome. Nature. 2001;409:860–921. doi: 10.1038/35057062. [DOI] [PubMed] [Google Scholar]
- 2.Venter JC, et al. The sequence of the human genome. Science. 2001;291:1304–51. doi: 10.1126/science.1058040. [DOI] [PubMed] [Google Scholar]
- 3.Altshuler DM, et al. Integrating common and rare genetic variation in diverse human populations. Nature. 2010;467:52–8. doi: 10.1038/nature09298. [DOI] [PMC free article] [PubMed] [Google Scholar]
- 4.Abecasis GR, et al. A map of human genome variation from population-scale sequencing. Nature. 2010;467:1061–73. doi: 10.1038/nature09534. [DOI] [PMC free article] [PubMed] [Google Scholar]
- 5.Mailman MD, et al. The NCBI dbGaP database of genotypes and phenotypes. Nat Genet. 2007;39:1181–6. doi: 10.1038/ng1007-1181. [DOI] [PMC free article] [PubMed] [Google Scholar]
- 6.Altshuler D, Daly MJ, Lander ES. Genetic mapping in human disease. Science. 2008;322:881–8. doi: 10.1126/science.1156409. [DOI] [PMC free article] [PubMed] [Google Scholar]
- 7.Shendure J. Next-generation human genetics. Genome Biol. 2011;12:408. doi: 10.1186/gb-2011-12-9-408. [DOI] [PMC free article] [PubMed] [Google Scholar]
- 8.Barabasi AL, Oltvai ZN. Network biology: understanding the cell’s functional organization. Nat Rev Genet. 2004;5:101–13. doi: 10.1038/nrg1272. [DOI] [PubMed] [Google Scholar]
- 9.Orchard S, et al. Protein interaction data curation: the International Molecular Exchange (IMEx) consortium. Nat Methods. 2012;9:345–50. doi: 10.1038/nmeth.1931. [DOI] [PMC free article] [PubMed] [Google Scholar]
- 10.Neale BM, et al. Patterns and rates of exonic de novo mutations in autism spectrum disorders. Nature. 2012;485:242–5. doi: 10.1038/nature11011. [DOI] [PMC free article] [PubMed] [Google Scholar]
- 11.O’Roak BJ, et al. Sporadic autism exomes reveal a highly interconnected protein network of de novo mutations. Nature. 2012;485:246–50. doi: 10.1038/nature10989. [DOI] [PMC free article] [PubMed] [Google Scholar]
- 12.Cotsapas C, et al. Pervasive sharing of genetic effects in autoimmune disease. PLoS Genet. 2011;7:e1002254. doi: 10.1371/journal.pgen.1002254. [DOI] [PMC free article] [PubMed] [Google Scholar]
- 13.Rossin EJ, et al. Proteins encoded in genomic regions associated with immune-mediated disease physically interact and suggest underlying biology. PLoS Genet. 2011;7:e1001273. doi: 10.1371/journal.pgen.1001273. [DOI] [PMC free article] [PubMed] [Google Scholar]
- 14.Bergholdt R, et al. Integrative analysis for finding genes and networks involved in diabetes and other complex diseases. Genome Biol. 2007;8:R253. doi: 10.1186/gb-2007-8-11-r253. [DOI] [PMC free article] [PubMed] [Google Scholar]
- 15.Matthews L, et al. Reactome knowledgebase of human biological pathways and processes. Nucleic Acids Res. 2009;37:D619–22. doi: 10.1093/nar/gkn863. [DOI] [PMC free article] [PubMed] [Google Scholar]
- 16.Brown KR, Jurisica I. Unequal evolutionary conservation of human protein interactions in interologous networks. Genome Biol. 2007;8:R95. doi: 10.1186/gb-2007-8-5-r95. [DOI] [PMC free article] [PubMed] [Google Scholar]
- 17.Alexeyenko A, et al. Comparative interactomics with Funcoup 2.0. Nucleic Acids Res. 2012;40:D821–8. doi: 10.1093/nar/gkr1062. [DOI] [PMC free article] [PubMed] [Google Scholar]
- 18.Lage K, et al. A large-scale analysis of tissue-specific pathology and gene expression of human disease genes and complexes. Proc Natl Acad Sci U S A. 2008;105:20870–5. doi: 10.1073/pnas.0810772105. [DOI] [PMC free article] [PubMed] [Google Scholar]
- 19.Lage K, et al. A human phenome-interactome network of protein complexes implicated in genetic disorders. Nat Biotechnol. 2007;25:309–16. doi: 10.1038/nbt1295. [DOI] [PubMed] [Google Scholar]
- 20.Fields S, Song O. A novel genetic system to detect protein-protein interactions. Nature. 1989;340:245–6. doi: 10.1038/340245a0. [DOI] [PubMed] [Google Scholar]
- 21.Braun P. Interactome mapping for analysis of complex phenotypes: insights from benchmarking binary interaction assays. Proteomics. 2012;12:1499–518. doi: 10.1002/pmic.201100598. [DOI] [PubMed] [Google Scholar]
- 22.Gavin AC, Maeda K, Kuhner S. Recent advances in charting protein-protein interaction: mass spectrometry-based approaches. Curr Opin Biotechnol. 2011;22:42–9. doi: 10.1016/j.copbio.2010.09.007. [DOI] [PubMed] [Google Scholar]
- 23.Tarassov K, et al. An in vivo map of the yeast protein interactome. Science. 2008;320:1465–70. doi: 10.1126/science.1153878. [DOI] [PubMed] [Google Scholar]
- 24.von Mering C, et al. Comparative assessment of large-scale data sets of protein-protein interactions. Nature. 2002;417:399–403. doi: 10.1038/nature750. [DOI] [PubMed] [Google Scholar]
- 25.Jensen LJ, Bork P. Biochemistry. Not comparable, but complementary. Science. 2008;322:56–7. doi: 10.1126/science.1164801. [DOI] [PubMed] [Google Scholar]
- 26.Bader GD, Hogue CW. Analyzing yeast protein-protein interaction data obtained from different sources. Nat Biotechnol. 2002;20:991–7. doi: 10.1038/nbt1002-991. [DOI] [PubMed] [Google Scholar]
- 27.Yu H, et al. High-quality binary protein interaction map of the yeast interactome network. Science. 2008;322:104–10. doi: 10.1126/science.1158684. [DOI] [PMC free article] [PubMed] [Google Scholar]
- 28.Sambourg L, Thierry-Mieg N. New insights into protein-protein interaction data lead to increased estimates of the S. cerevisiae interactome size. BMC Bioinformatics. 2010;11:605. doi: 10.1186/1471-2105-11-605. [DOI] [PMC free article] [PubMed] [Google Scholar]
- 29.Gavin AC, et al. Proteome survey reveals modularity of the yeast cell machinery. Nature. 2006;440:631–6. doi: 10.1038/nature04532. [DOI] [PubMed] [Google Scholar]
- 30.Lage K, et al. Genetic and environmental risk factors in congenital heart disease functionally converge in protein networks driving heart development. Proc Natl Acad Sci U S A. 2012;109:14035–40. doi: 10.1073/pnas.1210730109. [DOI] [PMC free article] [PubMed] [Google Scholar]
- 31.Bossi A, Lehner B. Tissue specificity and the human protein interaction network. Mol Syst Biol. 2009;5:260. doi: 10.1038/msb.2009.17. [DOI] [PMC free article] [PubMed] [Google Scholar]
- 32.Venkatesan K, et al. An empirical framework for binary interactome mapping. Nat Methods. 2009;6:83–90. doi: 10.1038/nmeth.1280. [DOI] [PMC free article] [PubMed] [Google Scholar]
- 33.Stumpf MP, et al. Estimating the size of the human interactome. Proc Natl Acad Sci U S A. 2008;105:6959–64. doi: 10.1073/pnas.0708078105. [DOI] [PMC free article] [PubMed] [Google Scholar]
- 34.Krogan NJ, et al. Global landscape of protein complexes in the yeast Saccharomyces cerevisiae. Nature. 2006;440:637–43. doi: 10.1038/nature04670. [DOI] [PubMed] [Google Scholar]
- 35.Varjosalo M, et al. Interlaboratory reproducibility of large-scale human protein-complex analysis by standardized AP-MS. Nat Methods. 2013;10:307–14. doi: 10.1038/nmeth.2400. [DOI] [PubMed] [Google Scholar]
- 36.Rojas A, et al. GATA4 is a direct transcriptional activator of cyclin D2 and Cdk4 and is required for cardiomyocyte proliferation in anterior heart field-derived myocardium. Mol Cell Biol. 2008;28:5420–31. doi: 10.1128/MCB.00717-08. [DOI] [PMC free article] [PubMed] [Google Scholar]
- 37.Bader GD, Cary MP, Sander C. Pathguide: a pathway resource list. Nucleic Acids Res. 2006;34:D504–6. doi: 10.1093/nar/gkj126. [DOI] [PMC free article] [PubMed] [Google Scholar]
- 38.Keshava Prasad TS, et al. Human Protein Reference Database--2009 update. Nucleic Acids Res. 2009;37:D767–72. doi: 10.1093/nar/gkn892. [DOI] [PMC free article] [PubMed] [Google Scholar]
- 39.Xenarios I, et al. DIP, the Database of Interacting Proteins: a research tool for studying cellular networks of protein interactions. Nucleic Acids Res. 2002;30:303–5. doi: 10.1093/nar/30.1.303. [DOI] [PMC free article] [PubMed] [Google Scholar]
- 40.Kerrien S, et al. The IntAct molecular interaction database in 2012. Nucleic Acids Res. 2012;40:D841–6. doi: 10.1093/nar/gkr1088. [DOI] [PMC free article] [PubMed] [Google Scholar]
- 41.Ceol A, et al. MINT, the molecular interaction database: 2009 update. Nucleic Acids Res. 2010;38:D532–9. doi: 10.1093/nar/gkp983. [DOI] [PMC free article] [PubMed] [Google Scholar]
- 42.Chautard E, Fatoux-Ardore M, Ballut L, Thierry-Mieg N, Ricard-Blum S. MatrixDB, the extracellular matrix interaction database. Nucleic Acids Res. 2011;39:D235–40. doi: 10.1093/nar/gkq830. [DOI] [PMC free article] [PubMed] [Google Scholar]
- 43.Goll J, et al. MPIDB: the microbial protein interaction database. Bioinformatics. 2008;24:1743–4. doi: 10.1093/bioinformatics/btn285. [DOI] [PMC free article] [PubMed] [Google Scholar]
- 44.Breuer K, et al. InnateDB: systems biology of innate immunity and beyond--recent updates and continuing curation. Nucleic Acids Res. 2013;41:D1228–33. doi: 10.1093/nar/gks1147. [DOI] [PMC free article] [PubMed] [Google Scholar]
- 45.Turinsky AL, Razick S, Turner B, Donaldson IM, Wodak SJ. Literature curation of protein interactions: measuring agreement across major public databases. Database (Oxford) 2010;2010:baq026. doi: 10.1093/database/baq026. [DOI] [PMC free article] [PubMed] [Google Scholar]
- 46.Cusick ME, et al. Literature-curated protein interaction datasets. Nat Methods. 2009;6:39–46. doi: 10.1038/nmeth.1284. [DOI] [PMC free article] [PubMed] [Google Scholar]
- 47.Salwinski L, et al. Recurated protein interaction datasets. Nat Methods. 2009;6:860–1. doi: 10.1038/nmeth1209-860. [DOI] [PubMed] [Google Scholar]
- 48.Franceschini A, et al. STRING v9.1: protein-protein interaction networks, with increased coverage and integration. Nucleic Acids Res. 2013;41:D808–15. doi: 10.1093/nar/gks1094. [DOI] [PMC free article] [PubMed] [Google Scholar]
- 49.Hinsby AM, et al. A wiring of the human nucleolus. Mol Cell. 2006;22:285–95. doi: 10.1016/j.molcel.2006.03.012. [DOI] [PubMed] [Google Scholar]
- 50.Lage K, et al. Dissecting spatio-temporal protein networks driving human heart development and related disorders. Mol Syst Biol. 2010;6:381. doi: 10.1038/msb.2010.36. [DOI] [PMC free article] [PubMed] [Google Scholar]
- 51.Miraoui H, et al. Mutations in FGF17, IL17RD, DUSP6, SPRY4, and FLRT3 are identified in individuals with congenital hypogonadotropic hypogonadism. Am J Hum Genet. 2013;92:725–43. doi: 10.1016/j.ajhg.2013.04.008. [DOI] [PMC free article] [PubMed] [Google Scholar]
- 52.Linding R, et al. Systematic discovery of in vivo phosphorylation networks. Cell. 2007;129:1415–26. doi: 10.1016/j.cell.2007.05.052. [DOI] [PMC free article] [PubMed] [Google Scholar]
- 53.Zuberi K, et al. GeneMANIA prediction server 2013 update. Nucleic Acids Res. 2013;41:W115–22. doi: 10.1093/nar/gkt533. [DOI] [PMC free article] [PubMed] [Google Scholar]
- 54.Niu Y, Otasek D, Jurisica I. Evaluation of linguistic features useful in extraction of interactions from PubMed; application to annotating known, high-throughput and predicted interactions in I2D. Bioinformatics. 2010;26:111–9. doi: 10.1093/bioinformatics/btp602. [DOI] [PMC free article] [PubMed] [Google Scholar]
- 55.Elsheikh M, Dunger DB, Conway GS, Wass JA. Turner’s syndrome in adulthood. Endocr Rev. 2002;23:120–40. doi: 10.1210/edrv.23.1.0457. [DOI] [PubMed] [Google Scholar]
- 56.Kainulainen K, Karttunen L, Puhakka L, Sakai L, Peltonen L. Mutations in the fibrillin gene responsible for dominant ectopia lentis and neonatal Marfan syndrome. Nat Genet. 1994;6:64–9. doi: 10.1038/ng0194-64. [DOI] [PubMed] [Google Scholar]
- 57.Calderone A, Castagnoli L, Cesareni G. mentha: a resource for browsing integrated protein-interaction networks. Nat Methods. 2013;10:690–1. doi: 10.1038/nmeth.2561. [DOI] [PubMed] [Google Scholar]
- 58.Amezcua-Guerra L, Santiago C, Espinola-Zavaleta N, Pineda C. Bicuspid aortic valve: a synergistic factor for aortic dilation and dissection in Marfan syndrome? Rev Invest Clin. 2010;62:39–43. [PubMed] [Google Scholar]
- 59.Porciani MC, et al. [Prevalence of cardiovascular manifestations in Marfan syndrome] Ital Heart J. 2004;(Suppl 5):647–52. [PubMed] [Google Scholar]
- 60.Dietz HC, et al. Marfan syndrome caused by a recurrent de novo missense mutation in the fibrillin gene. Nature. 1991;352:337–9. doi: 10.1038/352337a0. [DOI] [PubMed] [Google Scholar]
- 61.Milewicz DM, Dietz HC, Miller DC. Treatment of aortic disease in patients with Marfan syndrome. Circulation. 2005;111:e150–7. doi: 10.1161/01.CIR.0000155243.70456.F4. [DOI] [PubMed] [Google Scholar]
- 62.Watts DJ, Strogatz SH. Collective dynamics of ‘small-world’ networks. Nature. 1998;393:440–2. doi: 10.1038/30918. [DOI] [PubMed] [Google Scholar]
- 63.Biben C, et al. Cardiac septal and valvular dysmorphogenesis in mice heterozygous for mutations in the homeobox gene Nkx2-5. Circ Res. 2000;87:888–95. doi: 10.1161/01.res.87.10.888. [DOI] [PubMed] [Google Scholar]
- 64.Caldarelli G, Capocci A, De Los Rios P. Munoz, M. A. Scale-free networks from varying vertex intrinsic fitness. Phys Rev Lett. 2002;89:258702. doi: 10.1103/PhysRevLett.89.258702. [DOI] [PubMed] [Google Scholar]
- 65.DeBosch BJ, Muslin AJ. Insulin signaling pathways and cardiac growth. J Mol Cell Cardiol. 2008;44:855–64. doi: 10.1016/j.yjmcc.2008.03.008. [DOI] [PMC free article] [PubMed] [Google Scholar]
- 66.Gavin AC, et al. Proteome survey reveals modularity of the yeast cell machinery. Nature. 2006;440:631–6. doi: 10.1038/nature04532. [DOI] [PubMed] [Google Scholar]
- 67.Szklarczyk D, et al. The STRING database in 2011: functional interaction networks of proteins, globally integrated and scored. Nucleic Acids Res. 2011;39:D561–8. doi: 10.1093/nar/gkq973. [DOI] [PMC free article] [PubMed] [Google Scholar]
- 68.Li S, et al. A map of the interactome network of the metazoan C. elegans. Science. 2004;303:540–3. doi: 10.1126/science.1091403. [DOI] [PMC free article] [PubMed] [Google Scholar]
- 69.Giot L, et al. A protein interaction map of Drosophila melanogaster. Science. 2003;302:1727–36. doi: 10.1126/science.1090289. [DOI] [PubMed] [Google Scholar]
- 70.McBride KL, et al. Inheritance analysis of congenital left ventricular outflow tract obstruction malformations: Segregation, multiplex relative risk, and heritability. Am J Med Genet A. 2005;134A:180–6. doi: 10.1002/ajmg.a.30602. [DOI] [PMC free article] [PubMed] [Google Scholar]
- 71.Oti M, Snel B, Huynen MA, Brunner HG. Predicting disease genes using protein-protein interactions. J Med Genet. 2006 doi: 10.1136/jmg.2006.041376. [DOI] [PMC free article] [PubMed] [Google Scholar]
- 72.Ware SM, et al. Identification and functional analysis of ZIC3 mutations in heterotaxy and related congenital heart defects. Am J Hum Genet. 2004;74:93–105. doi: 10.1086/380998. [DOI] [PMC free article] [PubMed] [Google Scholar]
- 73.Bergholdt R, et al. Identification of novel type 1 diabetes candidate genes by integrating genome-wide association data, protein-protein interactions, and human pancreatic islet gene expression. Diabetes. 2012;61:954–62. doi: 10.2337/db11-1263. [DOI] [PMC free article] [PubMed] [Google Scholar]
- 74.Berchtold LA, et al. Huntingtin-interacting protein 14 is a type 1 diabetes candidate protein regulating insulin secretion and beta-cell apoptosis. Proc Natl Acad Sci U S A. 2011;108:E681–8. doi: 10.1073/pnas.1104384108. [DOI] [PMC free article] [PubMed] [Google Scholar]
- 75.Franke L, et al. Reconstruction of a functional human gene network, with an application for prioritizing positional candidate genes. Am J Hum Genet. 2006;78:1011–25. doi: 10.1086/504300. [DOI] [PMC free article] [PubMed] [Google Scholar]
- 76.Aerts S, et al. Gene prioritization through genomic data fusion. Nat Biotechnol. 2006;24:537–44. doi: 10.1038/nbt1203. [DOI] [PubMed] [Google Scholar]
- 77.Warde-Farley D, et al. The GeneMANIA prediction server: biological network integration for gene prioritization and predicting gene function. Nucleic Acids Res. 2010;38:W214–20. doi: 10.1093/nar/gkq537. [DOI] [PMC free article] [PubMed] [Google Scholar]
- 78.Kanehisa M, Goto S, Sato Y, Furumichi M, Tanabe M. KEGG for integration and interpretation of large-scale molecular data sets. Nucleic Acids Res. 2012;40:D109–14. doi: 10.1093/nar/gkr988. [DOI] [PMC free article] [PubMed] [Google Scholar]
- 79.Westra HJ, et al. Systematic identification of trans eQTLs as putative drivers of known disease associations. Nat Genet. 2013;45:1238–43. doi: 10.1038/ng.2756. [DOI] [PMC free article] [PubMed] [Google Scholar]
- 80.Wu L, et al. Variation and genetic control of protein abundance in humans. Nature. 2013;499:79–82. doi: 10.1038/nature12223. [DOI] [PMC free article] [PubMed] [Google Scholar]
- 81.Neale BM, et al. Patterns and rates of exonic de novo mutations in autism spectrum disorders. Nature. 2012 doi: 10.1038/nature11011. [DOI] [PMC free article] [PubMed] [Google Scholar]
- 82.Bergholdt SH, Larsen PV, Kragstrup J, Sondergaard J, Hansen DG. Enhanced involvement of general practitioners in cancer rehabilitation: a randomised controlled trial. BMJ Open. 2012;2:e000764. doi: 10.1136/bmjopen-2011-000764. [DOI] [PMC free article] [PubMed] [Google Scholar]
- 83.Subramanian A, et al. Gene set enrichment analysis: a knowledge-based approach for interpreting genome-wide expression profiles. Proc Natl Acad Sci U S A. 2005;102:15545–50. doi: 10.1073/pnas.0506580102. [DOI] [PMC free article] [PubMed] [Google Scholar]
- 84.Kasowski M, et al. Variation in transcription factor binding among humans. Science. 2010;328:232–5. doi: 10.1126/science.1183621. [DOI] [PMC free article] [PubMed] [Google Scholar]
- 85.Jager S, et al. Vif hijacks CBF-beta to degrade APOBEC3G and promote HIV-1 infection. Nature. 2012;481:371–5. doi: 10.1038/nature10693. [DOI] [PMC free article] [PubMed] [Google Scholar]
- 86.Wang X, et al. Three-dimensional reconstruction of protein networks provides insight into human genetic disease. Nat Biotechnol. 2012;30:159–64. doi: 10.1038/nbt.2106. [DOI] [PMC free article] [PubMed] [Google Scholar]
- 87.Nielsen LB, et al. Relationship between ZnT8Ab, the SLC30A8 gene and disease progression in children with newly diagnosed type 1 diabetes. Autoimmunity. 2011;44:616–23. doi: 10.3109/08916934.2011.576724. [DOI] [PubMed] [Google Scholar]
- 88.Hansen DG, et al. A complex intervention to enhance the involvement of general practitioners in cancer rehabilitation. Protocol for a randomised controlled trial and feasibility study of a multimodal intervention. Acta Oncol. 2011;50:299–306. doi: 10.3109/0284186X.2010.533193. [DOI] [PubMed] [Google Scholar]
- 89.Brorsson C, et al. Correlations between islet autoantibody specificity and the SLC30A8 genotype with HLA-DQB1 and metabolic control in new onset type 1 diabetes. Autoimmunity. 2011;44:107–14. doi: 10.3109/08916934.2010.509120. [DOI] [PubMed] [Google Scholar]
- 90.Bernstein BE, et al. An integrated encyclopedia of DNA elements in the human genome. Nature. 2012;489:57–74. doi: 10.1038/nature11247. [DOI] [PMC free article] [PubMed] [Google Scholar]
- 91.Ideker T, Valencia A. Bioinformatics in the human interactome project. Bioinformatics. 2006;22:2973–4. doi: 10.1093/bioinformatics/btl579. [DOI] [PubMed] [Google Scholar]
- 92.Trynka G, et al. Chromatin marks identify critical cell types for fine mapping complex trait variants. Nat Genet. 2013;45:124–30. doi: 10.1038/ng.2504. [DOI] [PMC free article] [PubMed] [Google Scholar]
- 93.Evidence for network evolution in an Arabidopsis interactome map. Science. 2011;333:601–7. doi: 10.1126/science.1203877. [DOI] [PMC free article] [PubMed] [Google Scholar]
- 94.Ito T, et al. A comprehensive two-hybrid analysis to explore the yeast protein interactome. Proc Natl Acad Sci U S A. 2001;98:4569–74. doi: 10.1073/pnas.061034498. [DOI] [PMC free article] [PubMed] [Google Scholar]
- 95.Uetz P, et al. A comprehensive analysis of protein-protein interactions in Saccharomyces cerevisiae. Nature. 2000;403:623–7. doi: 10.1038/35001009. [DOI] [PubMed] [Google Scholar]
- 96.Ho Y, et al. Systematic identification of protein complexes in Saccharomyces cerevisiae by mass spectrometry. Nature. 2002;415:180–3. doi: 10.1038/415180a. [DOI] [PubMed] [Google Scholar]
- 97.Gavin AC, et al. Functional organization of the yeast proteome by systematic analysis of protein complexes. Nature. 2002;415:141–7. doi: 10.1038/415141a. [DOI] [PubMed] [Google Scholar]
- 98.Guruharsha KG, et al. A protein complex network of Drosophila melanogaster. Cell. 2011;147:690–703. doi: 10.1016/j.cell.2011.08.047. [DOI] [PMC free article] [PubMed] [Google Scholar]
- 99.Rual JF, et al. Towards a proteome-scale map of the human protein-protein interaction network. Nature. 2005;437:1173–8. doi: 10.1038/nature04209. [DOI] [PubMed] [Google Scholar]
- 100.Stelzl U, et al. A human protein-protein interaction network: a resource for annotating the proteome. Cell. 2005;122:957–68. doi: 10.1016/j.cell.2005.08.029. [DOI] [PubMed] [Google Scholar]
- 101.Ewing RM, et al. Large-scale mapping of human protein-protein interactions by mass spectrometry. Mol Syst Biol. 2007;3:89. doi: 10.1038/msb4100134. [DOI] [PMC free article] [PubMed] [Google Scholar]
- 102.Havugimana PC, et al. A census of human soluble protein complexes. Cell. 2012;150:1068–81. doi: 10.1016/j.cell.2012.08.011. [DOI] [PMC free article] [PubMed] [Google Scholar]
- 103.Malovannaya A, et al. Analysis of the human endogenous coregulator complexome. Cell. 2011;145:787–99. doi: 10.1016/j.cell.2011.05.006. [DOI] [PMC free article] [PubMed] [Google Scholar]
- 104.Barabasi AL, Gulbahce N, Loscalzo J. Network medicine: a network-based approach to human disease. Nat Rev Genet. 2011;12:56–68. doi: 10.1038/nrg2918. [DOI] [PMC free article] [PubMed] [Google Scholar]
- 105.Morris AP, et al. Large-scale association analysis provides insights into the genetic architecture and pathophysiology of type 2 diabetes. Nat Genet. 2012;44:981–990. doi: 10.1038/ng.2383. [DOI] [PMC free article] [PubMed] [Google Scholar]