

Summary
Genetics and biochemistry have defined the components and wiring of the signaling pathways that pattern the embryo. Among them, the TGF-β pathway has the potential to behave as a morphogen: invitro experiments have clearly established that it can dictate cell fate in a concentration dependent manner. How morphogens convey positional information in a developing embryo, where signal levels are changing with time, is less understood. Using integrated microfluidic cell culture and time-lapse microscopy, we demonstrate here that the speed of ligand presentation has a key and previously unexpected influence on TGF-β signaling outcomes. The response to a TGF-β concentration step is transient and adaptive, slowly increasing the ligand concentration diminishes the response and well-spaced pulses of ligand combine additively resulting in greater pathway output than with constant stimulation. Our results suggest that in an embryonic context, the speed of change of ligand concentration is an instructive signal for patterning.
Introduction
The morphogen model (Wolpert, 2006) posits that during embryonic development, the morphogen level conveys positional information and determines cell fate. This simple picture is complicated by the fact that morphogen levels in a developing tissue are not static (Harvey and Smith, 2009; Kerszberg and Wolpert, 2007; Lee et al., 2001; Schohl and Fagotto, 2002) and the temporal history of stimulation can have an influence comparable to morphogen levels on patterning (Kutejova et al., 2009). The range of possible dynamic signals that could be encountered during development is quite diverse: a monotone increase patterning the vertebrate Dorso-Ventral axis (Schohl and Fagotto, 2002), the fly wing disc (Wartlick et al., 2011) or the neural tube (Balaskas et al., 2012); oscillatory during somitogenesis (Aulehla and Pourquie, 2010); or pulsatile as recently observed in Xenopus animal caps (Warmflash et al., 2012). However, because the dynamics of the ligands that initiate these events in a developing embryo are often hard to discern and to manipulate, it is difficult to disentangle the relative contributions of morphogen levels and dynamics of ligand presentation to the downstream response.
Here we examine how the time course of ligand presentation affects the activity of TGF-β signaling in the myoblast progenitor C2C12 cell line, a model for TGF-β regulated signaling and differentiation (De Angelis et al., 1998; Katagiri et al., 1994; Liu et al., 2001). We adapted an automated microfluidic cell culture platform (Gómez-Sjöberg et al., 2007), that allows us to apply complex time courses of stimulation and record individual cell responses in real time with video microscopy, Fig. S1. Cells grew in the microfluidic chambers at a rate comparable to that observed in regular cell culture dish and growth was unaffected by either imaging or TGF-β1 stimulation, Fig. S2. This approach allows a direct and quantitative measurement of the relationship between the dynamics of ligand presentation, transcriptional response and the specification of discrete fates.
The transcriptional response to TGF-β signaling is mediated by the complex of a receptor-activated Smad (R-Smad) with the co-regulator Smad4. Ligand binding to TGF-β receptors leads to R-Smad phosphorylation, complex formation with Smad4, and nuclear translocation (Massagué et al., 2005). R-Smad2/3 responds specifically to Activin, Nodals and TGF-β ligands while R-Smad1/5/8 responds to BMPs and GDFs, Fig. 1a. Using cells expressing a GFP-Smad4 fusion, we have recently shown that the response to a step increase in TGF-β1 was transient and adaptive: Even though the R-Smad, Smad2 and Smad3, remained phosphorylated and localized to the nucleus for as long as TGF-β ligand was present in solution, transcription, measured either by RT-PCR of endogenous target genes or synthetic TGF-β reporters, terminated after about 4 hours (Warmflash et al., 2012), Fig 1b–h and Fig S2n–p. The C2C12 cell lines stably transfected with fluorescently labelled Smads as reporters responded normally to stimulation when compared to un-transfected cells and the temporal profile of GFP-Smad4 nuclear localization tracked transcriptional activity of endogenous target genes under all conditions examined (Warmflash et al., 2012). The fluorescent Smad4 fusion protein is therefore an attractive reporter of pathway activity since it reveals the immediate consequences of receptor activation, and when co-expressed with a nuclear marker, very amenable to quantitative single cell imaging.
Figure 1. Pathway response to a ligand step is adaptive and graded.
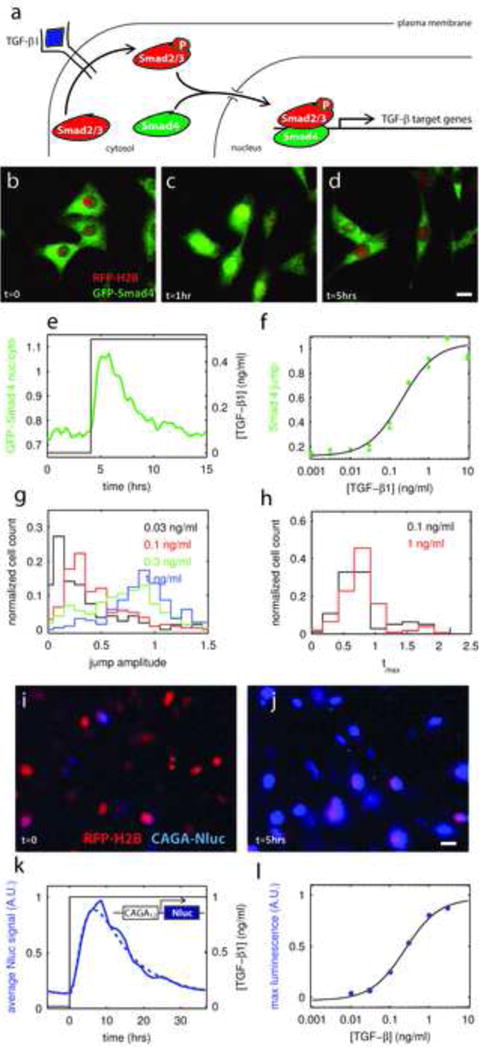
a – Components of the TGF-β signal transduction cascade.
b,c,d – Evolution of GFP-Smad4 (green) intracellular localization after a step stimulation with TGF-β1. Before stimulation GFP-Smad4 is mostly cytoplasmic (b), GFP-Smad4 is re-localized in the nucleus 1 hour after the start of stimulation (c), and returns to the cytoplasm by t=5 hours (d). Bar: 20μm.
e – Average nuclear to cytoplasmic ratio of GFP-Smad4 as a function of time in response to a step increase of TGF-β1 concentration form 0 to 0.5ng/ml (n ~ 400 cells).
f – Dose response curve for GFP-Smad4. The “Smad4 jump” response is defined as the maximum in the Smad4 curve relative to the pre-stimulus baseline (see Fig. S1d). Each point is the average of the jumps of all the cells present in one chamber (n~400). Data from two different chambers are plotted. The response (I) is well fit by the expression: , where L is the ligand concentration, K = 0.20 ± 0.08 ng/ml is the inflection point and a and b are two constants (black line).
g,h Statistical analysis of single cell response for a few TGF-β1 concentrations. The distribution of single cell response amplitude (“jump”) is single peaked and graded with ligand level, (g). Most cells respond within 1 hour of the step up in ligand irrespective of ligand level, (h).
i,j – Evolution of Nanoluciferase (Nluc) signal in single cells after a step stimulation with TGF-β1. Around 5 hours after of beginning of stimulation, an 8–10 fold increase of the luminescence signal (blue) is observed. Nluc was fused to a nuclear localization signal (NLS) to simplify image analysis. Bar: 20μm.
k – Average transcriptional activity downstream of TGF-β stimulation (n ~ 400), as measured by the luminescence signal of the CAGA12-Nluc reporter, as a function of time in response to a step increase of TGF-β1 concentration. Dotted line: fit of our adaptive model (see supplementary methods section 6)
l – Dose response of TGF-β induced luminescence signal of the CAGA12-Nluc reporter. The response is defined as the maximum in the average luminescence curve relative to the pre-stimulus baseline, normalized by the response to the highest dose (n~400). The response (I) is well fit by the expression: , where L is the ligand concentration, K = 0.24 ± 0.1 ng/ml is the inflection point and a and b are two constants (black line).
See also figure S1 and S2
However, in order to understand how pathway activity is interpreted at the level of gene expression, the dynamics of Smad transcription factors should be correlated to the downstream transcriptional response. Traditional population assays destroy the sample, assume homogeneity, and could not practically follow the complex stimuli we apply; we wanted instead to be able to measure transcriptional response in real time and with single cell resolution. For that purpose, we fused a synthetic promoter (Dennler et al., 1998) specific to the Smad3 branch of the TGF-β pathway (CAGA12) to the Nanoluc Luciferase (Nluc), an engineered luminescent protein (Hall et al., 2012) that is over 100× brighter than its Firefly and Renilla variants and therefore allows for detection of luminescence in single cells, Fig. S1. An identical construct with the NanoLuc replaced with GFP yielded fluorescence below background levels in our cells. Luminescence doesn’t suffer from auto-fluorescence or excitation backgrounds and it allows for longer exposure times and therefore greater sensitivity. A synthetic reporter eliminates potential transcriptional feedbacks that could modulate a natural promoter. Since the substrate for NLuc was unstable under cell culture conditions, time-lapse imaging required our microfluidic technology to apply fresh substrate each time an image was acquired and wash it off afterwards, minimizing toxicity. Periodic exposure to substrate also conveniently destabilized NLuc, thus lowering background and revealing the transcriptional response with better temporal resolution. The CAGA12-Nluc induced luminescence could readily be observed using a standard microscopy CCD camera with 2 minute exposure time and addition of TGF-β1 ligand triggered an 8–10 fold increase of the signal, Fig. 1i–l. See methods, S.I. and Fig. S1 for a complete characterization of our CAGA12-Nluc reporter system.
To establish how C2C12 cells encode different levels of morphogen and to make sure cells behaved the same way in the microfluidic chip than in a regular cell culture dish, we first asked how cells respond to a step-increase in TGF-β1 ligand for various concentrations, Fig. 1b–f. These time courses of stimulation provide a dose-response calibration and serve as a reference for the more complex temporal stimulations examined below. Culture medium containing different concentrations of TGF-β1 ligand was renewed every hour to insure proper control over the ligand concentration. Comparison of the dose-response with prior experiments in regular cell culture conditions rules out significant ligand depletion at low concentrations in the small microfluidic chambers. Consistent with our previous experiments (Warmflash et al., 2012), GFP-Smad4 only localized transiently to the nucleus following the step despite continuous stimulation, Movie S1. Single-cell analysis showed that for all concentrations, the vast majority of cells responded in a graded manner to the ligand step with a pulse that peaks within one hour, Fig. 1g–h, S2. We observed that full GFP-Smad4 adaptation depend on cell density, Fig. S2q. In the following, to insure consistency between experiments, we worked in conditions where adaption was complete (initial density ~300 cells/chamber). The transcriptional response measured with our CAGA12-Nluc reporter is also transient, Fig. 1k.
We used modeling to show that all the time dependent stimuli assayed by Nluc expression were consistent with a simple phenomenological model. Unlike previous modeling work focusing on the molecular details of the pathway (reviewed in (Zi et al., 2012)), our model defines the response with only two rate parameters, a timescale for adaptation and the ~5hr Nluc half-life, Fig. 1k. See also the methods and supplementary methods section 6 for a complete description of the fitting procedure. The best fit required TGF-β driven transcription to be adaptive with a peak about one hour after a step in ligand stimulation. This agrees with the observed dynamics of GFP-Smad4 and is a further consistency check. Finally, as with GFP-Smad4, the Nluc dose-response is graded with concentration and follows a simple sigmoid, Fig. 1l.
Pulsed stimulation increases pathway throughput
We have previously shown that Smad4 pulses repetitively into the nucleus in blastula and gastrula staged Xenopus animal caps (Warmflash et al., 2012). To investigate the consequences of pulsing, we stimulated cells with 1 hour pulses of TGF-β1 separated by 6 hours, and obtained a transient response for each pulse, Fig. 2a, Movie S2. Under the same stimulation protocol, the signal from the CAGA12-Nluc reporter approximately doubles from the first pulse to the second and then saturates at a value representing the balance between its production and decay that was fit with the same model and parameters as for the step stimulation, Fig. 2b and mathematical supplement. If the protein was stable, its accumulation would simply count the number of pulses. At the single cell level, there is no correlation in the amplitude of response to successive pulses repeated every 6hr, Fig. S3, and pulses of different heights elicit an autonomous response independent of the previous pulse Fig. 2d. When the pulse repeat-rate becomes comparable to the adaptation time, there is a diminished response around an elevated plateau, Figs. 2c, S3a–l. The single cell responses are reduced in amplitude but still uncorrelated from pulse to pulse, Fig. S3. For an adaptive system, such as the one described in Fig. 1, pulsatile stimulation could be a mechanism for overcoming adaptation to continuous simulation and increasing pathway throughput.
Figure 2. Pulsed stimulation increases pathway throughput and fate regulation.
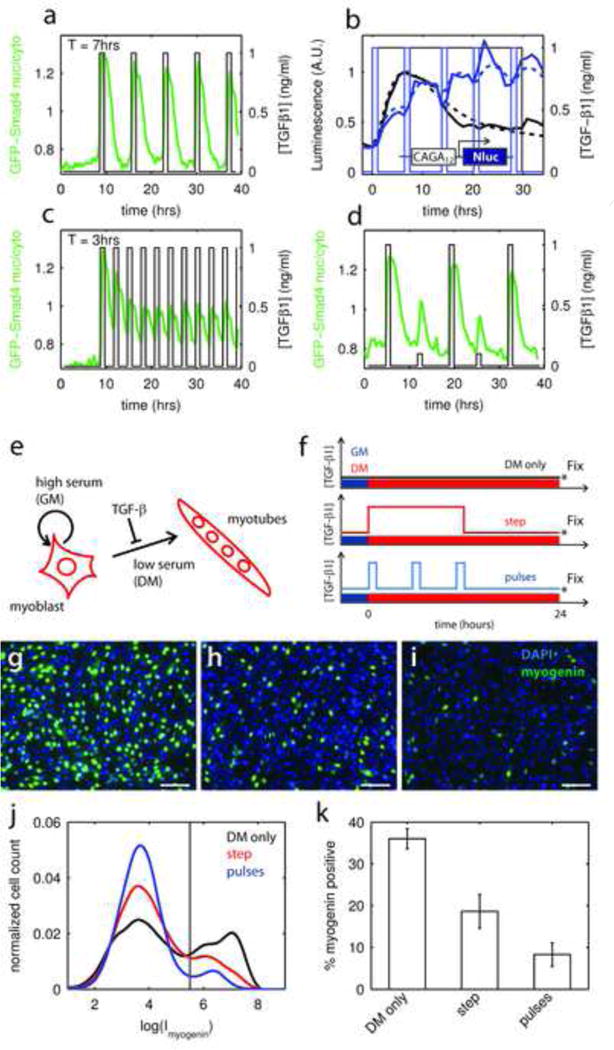
a – Evolution of GFP-Smad4 nuclear to cytoplasmic ratio (thick line, left axis) in response to a pulsatile stimulation. Period of stimulation is 7 hours.
b – Comparison of the transcriptional activity downstream of TGF-β stimulation, as measured by the luminescence signal of the CAGA12-Nluc reporter, when the cells are stimulated with a step (black) or pulsed (blue) stimulation. Dotted lines: fit using the same model parameters as in Fig. 1k.
c – Same as in (a) but with a period of stimulation of 3 hours, shows that when the frequency of stimulation is increased, the amplitude of the averaged response to each pulses decreases.
d – Same as in (a) but with pulses of variable amplitude showing no memory in the response.
e – Differentiation program of the myoblastic cell line C2C12. DM: differentiation medium, GM: growth medium
f – Experimental procedure, exposure to DM alone is contrasted with continuous 15hr exposure or 3 one hour pulses of TGF-β1. The concentration was 0.1ng/ml in all cases.
g, h, i – Immunofluorescence staining of the cultures against myogenin (green channel). (g) Control DM only, (h) DM + TGF-β1 step and (i) DM + TGF-β1 pulses. Counterstain: DAPI (blue). Bar 100 μm.
j – Normalized distribution of single cell intensity of myogenin signal for the 3 conditions color coded as in f. Cells can be separated in two populations: myogenin negative, myogenin positive based on fluorescent intensity. For each condition, n>10,000. Vertical line represents the threshold between the 2 populations.
k – Comparison of the percentage of myogenin positive cells, as defined in (f), for the 3 conditions. The pulses are on average 2.5 times more effective that the step in preventing differentiation (p<10−5). Error bar are given by the s.e.m. from 10 randomly selected fields.
See also Figure S3
C2C12 differentiation is blocked more effectively by TGF-β pulses than continuous stimulation
We next addressed the consequences of pulsed ligand delivery for cell fate specification. The C2C12 progenitors can differentiate to myotubes when exposed to differentiation medium (DM) and presentation of TGF-β1 inhibits this differentiation, Fig. 2e. Working in a standard cell culture dish, we compared the ability TGF-β1 to block cell differentiation when presented either continuously during 15 hours or as 3 one-hour-long pulses separated by 6 hours, spanning the same total time, Fig. 2f. We controlled for TGF-β1 lifetime by using the same TGF-β1 containing media to create the 3 pulses. After 24 hours, we used immunofluorescence to quantify the fraction of cells expressing myogenin, an early marker of commitment to terminal myotube differentiation (Tapscott, 2005), Figs. 2e–k and S3m–t. Again, pulsatile stimulation proved to be more effective at blocking differentiation and 2.5 times fewer cells expressed myogenin in the pulsatile case (p-value p<10−5 vs step simulation) despite the fact that the total duration of ligand exposure was only 3 hours as compared to 15 in the step stimulation. Thus pulsed stimulation with a period exceeding the adaptation time enhances both total transcriptional activity and the regulation of cell fate, and the effect is nearly proportional to the number of pulses (2.5× from 3 pulses). Pulsed stimulation is a general mechanism to bypass internal feedbacks limiting pathway output. This mechanism could be at work in blastula and gastrula staged Xenopus animal caps, where all timescales are shorter (Warmflash et al., 2012).
Pathway activity depends on the speed of concentration increase
Another generic property of adaptive systems is that their response depends not only on the level but also on the rate of stimulation (Tu et al., 2008). Adaptation to a step in stimulus suggests that the system filters out slowly changing ligands concentration irrespective of their absolute level. To probe this aspect of the temporal response of the pathway, we stimulated the cells with a linear ramp in ligand at various rates of increase, Fig. 3a–d. We found that when the increase is sufficiently fast compared to the adaptation time, the response was comparable to step stimulation. The maximum in the GFP-Smad4 response curve clearly decreased with decreasing ramp rate, Fig. 3a–d. The single cell response became more diffuse in slow ramps in comparison to steps, Fig. S4a, as expected for an adaptive system. Again, the transcriptional response measured with the CAGA12-Nluc is consistent with the observation made with GFP-Smad4, as confirmed by the fits, Fig. 3e–h, S4 and supplementary methods section 6. The rate of ligand delivery has a pronounced effect on cellular response to TGF-β stimulation: the response to a given level can be all or nothing depending on the speed at which the concentration has been increased.
Figure 3. Pathway activity depends on rate of change.
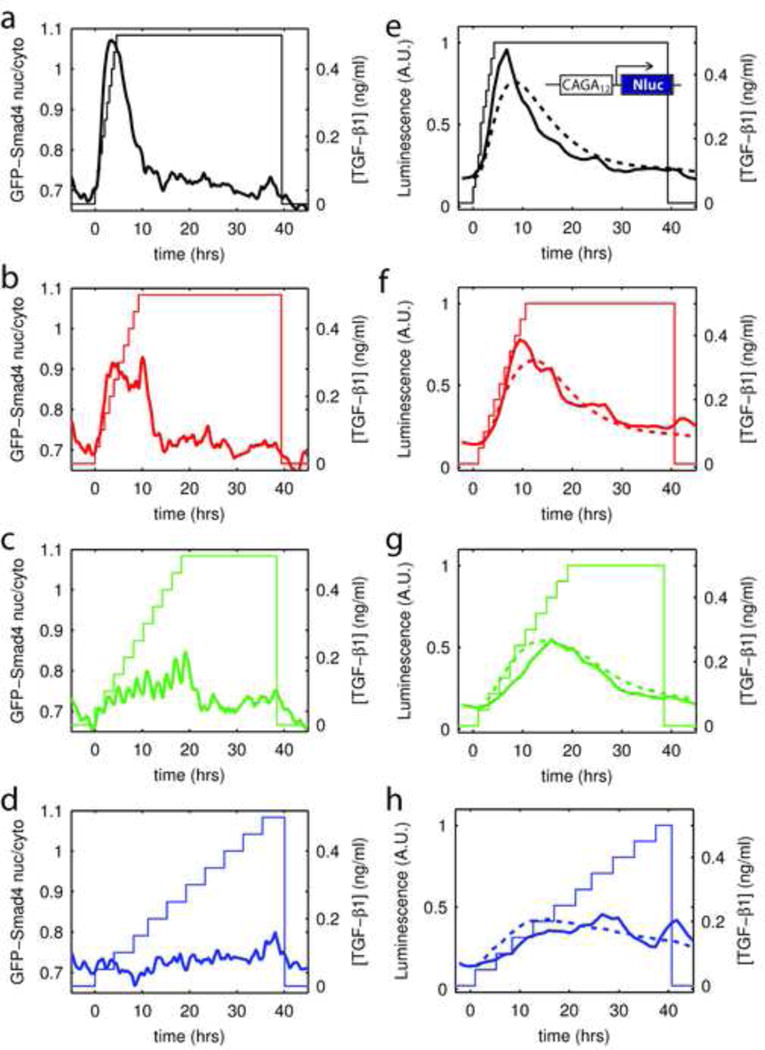
a–d – Evolution of GFP-Smad4 nuclear to cytoplasmic ratio (thick lines, left axis) in response to increases of the TGF-β1 concentration (right axis) from 0 to 0.5ng/ml (a nearly saturating dose) at various rate of increase.
e–h – Evolution of the transcriptional activity downstream of TGF-β stimulation, as measured by the luminescence signal of the CAGA12-Nluc reporter in response to increases of the TGF-β1 concentration from 0 to 0.5ng/ml (a nearly saturating dose) at various rate of increase. Dotted lines: fit using the same model parameters as in Fig. 1k.
Our observation that the speed of increase of concentration is as relevant as concentration itself has important consequences as to how a cell reading the morphogen through an adaptive pathway can learn its position relative to a source. Consider a morphogen that diffuses from a source and is degraded. Its steady state profile is exponential, Fig. 4a, but the speed of morphogen increase also depends on the distance to the source, Fig. 4b. We can now contrast how two pathways, a “linear” and an “adaptive” one, will respond to this ligand time course and extract positional information. The linear pathway responds only to ligand level, Fig. 4c, while the adaptive pathway is sensitive to both level and speed and its response to a step is transient, Fig. 4d. Both pathways will produce a response that depends on the distance to the source, Fig. 4e–f, however, the fact that the adaptive response peaks well before the linear one reaches steady state would tend to suggest that the time required for a fate decision is much less for cells using an adaptive pathway. This could well confer a fitness advantage in rapidly developing embryos, Fig. 4g–h. To test that idea, we have utilized the pathway responses from Fig. 4e–f as the input to a gene regulatory network (GRN) (Saka and Smith, 2007) featuring the minimal set of elements to achieve fate determination: mutual repression between fates and bistability, see Fig. 4g and supplementary methods section 7. Factor B is more sensitive to TGF-β and is excluded from the region of highest morphogen by repression from A. The GRN responds rapidly so as to track the pathway response, and the bistability then locks in the maximum signal seen by a cell. We chose the parameters of the GRN for each case so that the adaptive and linear models resulted in identical spatial patterns and then compared the time to achieve those patterns. The result is clear-cut: the final French-flag pattern is reached 3 times faster if an adaptive pathway is used to read the morphogen gradient, Fig 4h–i.
Figure 4. Speed Fating: an adaptive signaling pathway can extract positional information without a spatial gradient.
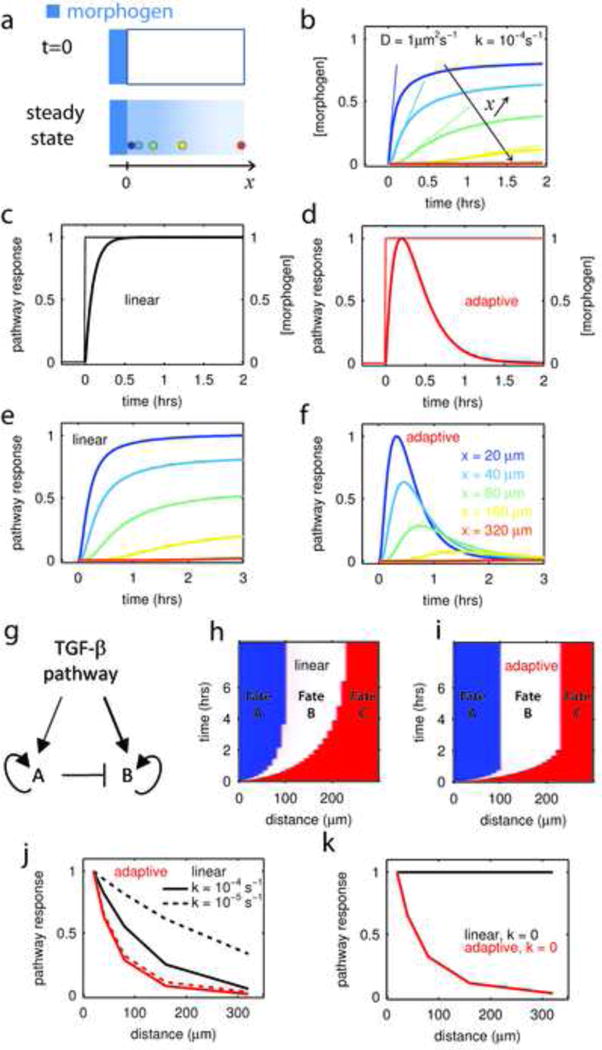
a-At t=0, a morphogen (in blue) is allowed to diffuse in a tissue from a constant source located in x=0 (upper panel). The diffusion constant is D and ligand decays at a rate k. In such conditions, the steady state profile of concentration is an exponential gradient with characteristic length (lower panel). Colored circles represent cells at various distances from the source.
b –The temporal profile of ligand concentration, calculated at various distances from the source (x) and for ligand parameters, D, k, characteristic for embryonic development (Muller et al., 2012), show that both the steady state concentration and the speed at which this steady state is reached depend on the distance to the source. Color code in (a) or (f)
c–d Comparison of a linear pathway (c) and an adaptive pathway (d) responding to a ligand step as in (b);. For the “linear” pathway, the response (y) to ligand input (I) is given by the differential equation y˙ = I − cy, where c sets the time scale of response. The adaptive pathway is defined by the system y˙ = I − cy − 0.25c2.x; x˙ = y (see supplementary methods) where again c sets the response time and x is a feedbcak. The reaction time of both pathways is defined to be identical (c = 10h−1) and both of them have an amplitude of response that is linear with the ligand concentration. As a consequence they would show an identical dose-response curve to ligand presented as a step.
e - Response of the linear pathway (c) to the different ligand profiles presented in (b). The linear pathway can extract positional information, i.e. the observed response varies as a function of the distance from the morphogen source. Color code for distance follows panel (f).
f - Response of the adaptive pathway (d) to the different ligand profiles presented in (b) depends on the distance to the morphogen source. However the differentiation decision, defined by the time of the response maximum in the adaptive case or when the response saturates for the linear pathway, can be faster in the adaptive system.
g – Minimal gene regulatory network for fate decision between two fates (A and B) induced downstream of TGF-β pathway activity. Factor A is activated at lower TGF-β levels than B, as depicted by the thickness of the arrows.
h–i– Establishment of a French flag pattern in function of time for a linear (h) or adaptive (i) pathway. Fate A (blue) and B (white) are induced downstream of TGF-β signaling and A represses B as in the GRN described in (g). Fate C (red) represents the default fate (both A and B are off). When an adaptive pathway is used, the final pattern is reach 3 times faster.
j – Comparison of how the two pathways extract positional information from a spreading gradient of morphogen. The adaptive pathway is more efficient at patterning since its distance-response curve is much sharper. Furthermore, response-distance function of the adaptive system is insensitive to changes in morphogen properties (dotted lines, 10 fold decrease in decay rate) while the linear pathway is.
The dynamic response of the adaptive pathway also has the advantage that it is insensitive to ligand dynamics: a 10-fold decrease in the ligand decay rate leaves the relative response as a function of distance unchanged for the adaptive pathway while it becomes much flatter for cells using a linear pathway, Fig. 4j. Nothing changes with the adaptive pathway in the extreme case that the morphogen does not decay at all, while the linear pathway conveys no information about position in this condition, Fig. 4k, S4ij. We term positional information acquired through an adaptive pathway speed fating.
Discussion
The influence of the speed of increase of morphogen concentration on cell response has been generally overlooked. This is mostly because the key experiments (Green et al., 1992; Gurdon et al., 1999), including our own (Wilson et al., 1997), that established that both the activin/nodal and BMP branches of the TGF-β pathway behave as morphogens, i.e. that different concentrations of ligand could give rise to different fates, were performed by delivering ligand steps or short pulses of variable height to isolated Xenopus blastula cells, in-vitro. More realistic temporal stimuli were not considered. In particular a ligand step does not discriminate between an adaptive response and one that registers level only.
Static and dynamic positional information are not mutually exclusive, and one biochemical pathway can display either behavior or a blend depending on kinetic parameters. Their relative contribution can drift during evolution while the complex downstream transcriptional gene network that assigns distinct fates to pathway output remains invariant (Balaskas et al., 2012; Saka and Smith, 2007). However the adaptive sensing of position is invariably faster, less contingent on ligand parameters such as decay rate, and inherently more robust to slow changes in protein levels or the environment. Bacterial chemotaxis is a good example of this strategy and a phenotypic model similar to ours was used to fit ramp stimuli (Tu et al., 2008). Exact adaptation is not required for speed fating, merely maximal response proportional to the time rate of change.
In our experiments the ligand directly activated the pathway, while in the embryo signaling results from a complex interaction of activators and inhibitors. Nevertheless measurement of Wnt, TGF-β, and BMP signaling in Xenopus (Lee et al.; Schohl and Fagotto) show that activation of the associated transcriptional effectors (β-catenin, Smad2, Smad1) increase in time and do so most rapidly in regions associated with the greatest pathway activity (e.g. ventral for BMP4). What matters for speed fating is the temporal profile of pathway activity, which will obviously integrate contributions of both inhibitors and activators.
Negative feedbacks following stimulation, either intracellular through receptor inactivation or extracellular through secreted inhibitors, are a very common feature of the signal transduction pathways that are used throughout development, and would tend to lead to partial adaptation. So, independently of the exact molecular details that are specific to each system, the possibility that the time derivative of a signal confers positional information has to be considered, and dynamic characterization of signaling pathways in terms of input-output should be included in modern morphogen models.
Methods
Microfluidic cell culture and imaging
Cell Culture Chips were obtained from the Stanford Foundry, and controlled by custom made Matlab interface adapted from the one kindly provided by the Quake laboratory. Prior to C2C12 cell seeding, chambers were coated with 20 μg/ml Fibronectin from bovine plasma (Sigma) for at least 2 hours. The day preceding the experiment, ~100 cells/chamber were seeded. Cells were fed every hour either with growth medium (GM, DMEM + 10%FBS) alone or with GM containing TGF-βl according to the time course of ligand concentration shown in figures, except for the experiment shown in Fig. 3a where medium was changed every half hour. Fluorescence imaging of GFP-S4 was performed every 15 minutes. Nluc luminescence was acquired every hour and fresh Nluc substrate was provided before each acquisition. Single cell data was extracted using custom made Matlab image analysis routines.
C2C12 differentiation
At confluence (t=0), culture medium was switched from GM to either differentiation medium (DM, DMEM + 2% Horse Serum) only or DM complemented with 0.1ng/ml TGF-β1. TGF-β1 was presented either continuously for 15 hours (step) or as 3 one hour long pulses each separated by 6 hours. To control for ligand consumption/degradation, the medium used for the first pulse was saved and used for the subsequent ones. All samples were fixed and stained for myogenin (clone F5D, 1:200, DSHB) at t=24h, following standard immunofluorescence protocols, detailed in supplementary methods.
CAGA12-Nluc single cell imaging
TGF-β responsive elements are appealing candidates for a single cell TGF-β reporter system, but unfortunately they didn’t produce enough signal for detection at the single cell level when driving expression of either GFP or Firefly luciferase.
We thus switched to NanoLuc luciferase (Nluc), a small (19.1kDa) engineered luciferase commercially available from Promega (Hall et al., 2012). The enzyme is advertised to be 150 fold brighter than other luciferases. It uses furimazine, a coelenterazine analog as a substrate. Unfortunately furimazine is not stable under conventional cell culture condition (half-life ~ 1h). In order to solve that issue, we took advantage of the Cell culture Chip capabilities: the Nluc substrate was kept in a refrigerated container in an oxygen-free atmosphere to prevent its degradation for days. Before each acquisition, fresh substrate (10μ.M in dmem) was flushed over the cells and rinsed once the picture was acquired, thus minimizing cell exposure to the substrate. We observed that this procedure conveniently destabilized Nluc to about half its half-life (~5hours). Single cell luminescence signal was measured every hours. CAGA12-Nluc luminescence could readily be detected in single cells with 2 minutes exposure times (objective: 10x 0.45 NA; camera: Hamamatsu ORCA R2, maximum gain, binning 4). See supplementary methods section 5 and Fig. S1 for a detailed description of the validation of the CAGA12-Nluc reporter system.
Fitting Nluc transcriptional response
In order to quantify the degree of internal consistency among our two reporters, GFP-Smad4 and CAGA12-Nluc, for various dynamic stimuli, we have designed a model with only three essential parameters (after allowing for a scale factor to define microscope camera units) each of which can be tied fairly tightly to a single experiment: the timescale of adaptation (2/c), the EC50 of the dose-response curve to TGF-β stimulation (KI) and the life time of Nluc (τ). At the core of our signal transduction cascade is an adaptive module. See Fig. S4b for a graphc presentation of the model. A linear model for adaptation had the fewest free parameters and proved adequate for our data:
| (1) |
| (2) |
Where I is the ligand dependent input and y the output of the adaptive module. The response of this module following an input step at t = 0 is
| (3) |
Which is in good agreement with the single cell GFP-Smad4 data, especially the fact that the timescale for adaptation (2/c) is ligand independent (Fig. 1h). It is worth noting that this is not the case with other commonly used adaptive cicruits such as the incoherent feedforward loop where the adaptation time varies with the inverse input level, i.e., I has units of frequency.
Upstream of the adaptive module is a receptor module. The dependence of both Smad4 and Nluc in response to a ligand step L scales as L/(KI + L), Fig. 1, so it is plausible to simply model the receptor module and its connection to adaptation by
| (4) |
For the transcriptional output downstream of the adaptive module, we used:
| (5) |
| (6) |
where z1 can loosely be though of as message, and z2 as protein (Nluc). The relaxation time τ need not be the same in the two equations, but since the data requires τ ~ 5 hrs, while the adaptive system has a time scale of ~1 hr, the time course of z2 is largely insensitive to how relaxation time is distributed between the two equations, so we made the rates equal, thereby eliminating a parameter that would be impossible to fit. Fits of the Nluc data are presented in Fig. 1k, Fig. 2b, Fig. 3e–h and Fig. S4. a detailed description of the fiting procedure and hypothesis is given in supplementary methods, section 6.
Model for Dynamic Embryonic Patterning
To reinforce the intuition that adaptive systems can infer position from the rate the ligand changes in time, we consider that argument in a more mathematical fashion. As an idealized model of morphogen spreading in an embryo, we consider a ligand (L) that diffuses into the region x > 0 with a diffusion constant (D) form an infinite source in x = 0 and is degraded at a rate (k):
| (7) |
| (8) |
For t = ∞, Eq. 8 becomes , the exponential gradient of morphogen. We have plotted in Fig. 4b the temporal profile of ligand concentrations experienced by cells at various distances from the source of morphogen.
We then compare how a linear pathway and an adaptive pathway respond to the ligand profiles calculated from eq. 8. For the “linear” pathway, the response (y) to ligand input (I) is given by the differential equation:
| (9) |
where c sets the time scale of response. The adaptive pathway is defined by the system
| (10) |
where again c sets the response time and x is a feedback (note this is the same system than the one we used to fit the Nluc data). The reaction time of both pathways is defined to be identical (c = 10/h−1) and both of them have an amplitude of response that is linear with the ligand concentration. As a consequence they would show an identical dose-response curve to ligand presented as a step, Fig. 4ef.
Finally, to make the point that the transcriptional output from adaptive system can reach its maximal value and thus infer position well before the ligand reaches its asymptotic value, we have modeled a bistable gene regulatory network (GRN) that captures the output (y(t)) of the signaling pathway from equation (9) or (10) and renders it permanent. This is very consistent with standard embryology, where a signal is applied during a window of compentency, at the end of which the fate of the targets is specified and no longer requires the signal.
A minimal model requires two proteins, A,B both bistable. They define three territories in order of decreasing signal level: A ON B OFF (blue stripe in Fig. 4hi); A OFF B ON (white stripe in Fig. 4hi); both OFF (red stripe in Fig. 4hi). This GRN is defined by the arrow diagram in fig. 4g or by the system of equations:
| (11) |
| (12) |
where m(t) is the time dependent input from morphogen signaling pathway upstream of the GRN. It is a quadratc function of y(t) given by eq. 9 or eq. 10 with parameters chosen to place the asymptotic expression domains of A,B in defined locations. Results presented in Fig. 4hi and supplemental movie S3 show how this GRN assigns cell fate as a function of time. A detailed description of the hypothesis behind this model is given in supplementary methods, section 7.
Supplementary Material
Highlights.
C2C12 cell response to a TGF-β concentration step is transient and adaptive
Pulsed stimulation increases pathway throughput
Cell response depends on the rate of ligand change as well as its final value
Distance from a morphogen source can be learned from concentration increase rate
Acknowledgments
The authors are grateful to the members of the Quake and Skotheim laboratories at Stanford University for the help they provided to set up the Cell Culture Chip system in our lab, to Qixiang Zhang and Shu Li for technical assistance and members of the A.H.B. and E.D.S. laboratories for helpful discussions. Funding supporting this work was provided by The Rockefeller University, NYSTEM, National Institutes of Health Grant R01 HD32105 (to A.H.B.) and R01 GM 101653 to (A.H.B. & E.D.S.), National Science Foundation Grant PHY-0954398 (to E.D.S.), the European Molecular Biology Organization ALTF 1476-2010 (to B.S.) and the Human Frontier Science Program LT000851/2011-L (to B.S.)
Footnotes
Publisher's Disclaimer: This is a PDF file of an unedited manuscript that has been accepted for publication. As a service to our customers we are providing this early version of the manuscript. The manuscript will undergo copyediting, typesetting, and review of the resulting proof before it is published in its final citable form. Please note that during the production process errors may be discovered which could affect the content, and all legal disclaimers that apply to the journal pertain.
Author contributions
BS, AW, AHB and EDS designed the research. BS, AW and EDS Performed research. BS, AW, AHB and EDS Analyzed data. BS, AW, AHB and EDS wrote the paper.
Bibliography
- Aulehla A, Pourquie O. Signaling Gradients during Paraxial Mesoderm Development. Cold Spring Harbor Perspectives in Biology. 2010;2:a000869–a000869. doi: 10.1101/cshperspect.a000869. [DOI] [PMC free article] [PubMed] [Google Scholar]
- Balaskas N, Ribeiro A, Panovska J, Dessaud E, Sasai N, Page KM, Briscoe J, Ribes V. Gene regulatory logic for reading the Sonic Hedgehog signaling gradient in the vertebrate neural tube. Cell. 2012;148:273–284. doi: 10.1016/j.cell.2011.10.047. [DOI] [PMC free article] [PubMed] [Google Scholar]
- De Angelis L, Borghi S, Melchionna R, Berghella L, Baccarani-Contri M, Parise F, Ferrari S, Cossu G. Inhibition of myogenesis by transforming growth factor beta is density-dependent and related to the translocation of transcription factor MEF2 to the cytoplasm. Proc Natl Acad Sci USA. 1998;95:12358–12363. doi: 10.1073/pnas.95.21.12358. [DOI] [PMC free article] [PubMed] [Google Scholar]
- Dennler S, Itoh S, Vivien D, ten Dijke P, Huet S, Gauthier JM. Direct binding of Smad3 and Smad4 to critical TGF beta-inducible elements in the promoter of human plasminogen activator inhibitor-type 1 gene. EMBO J. 1998;17:3091–3100. doi: 10.1093/emboj/17.11.3091. [DOI] [PMC free article] [PubMed] [Google Scholar]
- Gómez-Sjöberg R, Leyrat AA, Pirone DM, Chen CS, Quake SR. Versatile, fully automated, microfluidic cell culture system. Anal Chem. 2007;79:8557–8563. doi: 10.1021/ac071311w. [DOI] [PubMed] [Google Scholar]
- Green JB, New HV, Smith JC. Responses of embryonic Xenopus cells to activin and FGF are separated by multiple dose thresholds and correspond to distinct axes of the mesoderm. Cell. 1992;71:731–739. doi: 10.1016/0092-8674(92)90550-v. [DOI] [PubMed] [Google Scholar]
- Gurdon J, Standley H, Dyson S, Butler K, Langon T, Ryan K, Stennard F, Shimizu K, Zorn A. Single cells can sense their position in a morphogen gradient. Development. 1999;126:5309–5317. doi: 10.1242/dev.126.23.5309. [DOI] [PubMed] [Google Scholar]
- Hall MP, Unch J, Binkowski BF, Valley MP, Butler BL, Wood MG, Otto P, Zimmerman K, Vidugiris G, Machleidt T, et al. Engineered Luciferase Reporter from a Deep Sea Shrimp Utilizing a Novel Imidazopyrazinone Substrate. ACS Chemical Biology. 2012;7:1848–1857. doi: 10.1021/cb3002478. [DOI] [PMC free article] [PubMed] [Google Scholar]
- Harvey SA, Smith JC. Visualisation and quantification of morphogen gradient formation in the zebrafish. Plos Biol. 2009;7:e1000101. doi: 10.1371/journal.pbio.1000101. [DOI] [PMC free article] [PubMed] [Google Scholar]
- Katagiri T, Yamaguchi A, Komaki M, Abe E, Takahashi N, Ikeda T, Rosen V, Wozney JM, Fujisawa-Sehara A, Suda T. Bone morphogenetic protein-2 converts the differentiation pathway of C2C12 myoblasts into the osteoblast lineage. J Cell Biol. 1994;127:1755–1766. doi: 10.1083/jcb.127.6.1755. [DOI] [PMC free article] [PubMed] [Google Scholar]
- Kerszberg M, Wolpert L. Specifying Positional Information in the Embryo: Looking Beyond Morphogens. Cell. 2007;130:205–209. doi: 10.1016/j.cell.2007.06.038. [DOI] [PubMed] [Google Scholar]
- Kutejova E, Briscoe J, Kicheva A. Temporal dynamics of patterning by morphogen gradients. Current Opinion in Genetics & Development. 2009;19:315–322. doi: 10.1016/j.gde.2009.05.004. [DOI] [PubMed] [Google Scholar]
- Lee MA, Heasman J, Whitman M. Timing of endogenous activin-like signals and regional specification of the Xenopus embryo. Development. 2001;128:2939–2952. doi: 10.1242/dev.128.15.2939. [DOI] [PubMed] [Google Scholar]
- Liu D, Black BL, Derynck R. TGF-beta inhibits muscle differentiation through functional repression of myogenic transcription factors by Smad3. Genes & Development. 2001:2950–2966. doi: 10.1101/gad.925901. [DOI] [PMC free article] [PubMed] [Google Scholar]
- Massagué J, Seoane J, Wotton D. Smad transcription factors. Genes & Development. 2005;19:2783–2810. doi: 10.1101/gad.1350705. [DOI] [PubMed] [Google Scholar]
- Muller P, Rogers KW, Jordan BM, Lee JS, Robson D, Ramanathan S, Schier AF. Differential diffusivity of Nodal and Lefty underlies a reaction-diffusion patterning system. Science. 2012;336:721–724. doi: 10.1126/science.1221920. [DOI] [PMC free article] [PubMed] [Google Scholar]
- Saka Y, Smith J. A mechanism for the sharp transition of morphogen gradient interpretation in Xenopus. BMC Developmental Biology. 2007;7:47. doi: 10.1186/1471-213X-7-47. [DOI] [PMC free article] [PubMed] [Google Scholar]
- Schohl A, Fagotto F. Beta-catenin, MAPK and Smad signaling during early Xenopus development. Development. 2002;129:37–52. doi: 10.1242/dev.129.1.37. [DOI] [PubMed] [Google Scholar]
- Tapscott SJ. The circuitry of a master switch: Myod and the regulation of skeletal muscle gene transcription. Development. 2005;132:2685–2695. doi: 10.1242/dev.01874. [DOI] [PubMed] [Google Scholar]
- Tu Y, Shimizu TS, Berg HC. Modeling the chemotactic response of Escherichia coli to time-varying stimuli. Proc Natl Acad Sci USA. 2008;105:14855–14860. doi: 10.1073/pnas.0807569105. [DOI] [PMC free article] [PubMed] [Google Scholar]
- Warmflash A, Zhang Q, Sorre B, Vonica A, Siggia ED, Brivanlou AH. Dynamics of TGF-β signaling reveal adaptive and pulsatile behaviors reflected in the nuclear localization of transcription factor Smad4. Proc Natl Acad Sci USA. 2012;109:E1947–1956. doi: 10.1073/pnas.1207607109. [DOI] [PMC free article] [PubMed] [Google Scholar]
- Wartlick O, Mumcu P, Kicheva A, Bittig T, Seum C, Jülicher F, González-Gaitán M. Dynamics of Dpp signaling and proliferation control. Science. 2011;331:1154–1159. doi: 10.1126/science.1200037. [DOI] [PubMed] [Google Scholar]
- Wilson PA, Lagna G, Suzuki A, Hemmati-Brivanlou AH. Concentration-dependent patterning of the Xenopus ectoderm by BMP4 and its signal transducer Smad1. Development. 1997;124:3177–3184. doi: 10.1242/dev.124.16.3177. [DOI] [PubMed] [Google Scholar]
- Wolpert L. Principles of Development. 3. Oxford, UK: Oxford university press; 2006. [Google Scholar]
- Zi Z, Chapnick DA, Liu X. Dynamics of TGF-β/Smad signaling. FEBS Letters. 2012;586:1921–1928. doi: 10.1016/j.febslet.2012.03.063. [DOI] [PMC free article] [PubMed] [Google Scholar]
Associated Data
This section collects any data citations, data availability statements, or supplementary materials included in this article.