Abstract
We present an optically encoded photoacoustic flow imaging method based on optical-resolution photoacoustic microscopy. An intensity-modulated continuous-wave laser photothermally encodes the flowing medium, and a pulsed laser generates photoacoustic waves to image the encoded heat pattern. Flow speeds can be calculated by cross-correlation. The method was validated in phantoms, at flow speeds ranging from 0.23 mm/s to 11 mm/s. Venous blood flow speed in a mouse ear was also measured.
Blood flow is an important physiological parameter and can be used to identify abnormal cell activities, such as hypermetabolism in cancers [1]. Major noninvasive blood flow measurement techniques include Doppler ultrasound flowmetry [2], laser Doppler velocimetry [3], and Doppler optical coherence tomography [4]. All of these techniques rely on acoustic or optical scattering contrasts from moving media. Based on optical absorption contrast, photoacoustic (PA) microscopy has been recently applied to high-resolution blood flow imaging. In comparison to other techniques, PA microscopy provides inherently background-free detection and speckle-free imaging [5]. Several PA flow measurement techniques based on the PA Doppler effect have been explored [6-8], but it has been reported that the PA Doppler signal strength decreases as the particle concentration increases [8, 9]. Additionally, the axial resolution achieved by tone-burst excitation with a continuous-wave (CW) laser was relatively low compared with the axial resolution achieved by pulsed excitation. Unlike the previous methods based on the PA Doppler effect, Sheinfeld et al. measured the flow speed based on PA detection of thermal clearance [10]. This method does not reply on the inhomogeneity of the absorbers in the flow, and thus can potentially measure the flow speed of homogenous media. However, the method was unable to separate thermal convection from conduction, leading to low accuracy for slow flow measurements.
Recently, ultrasound-encoded photoacoustic flowmetry has been demonstrated [11, 12]. Based on a similar idea, we present here an in vivo optically encoded PA flowgraphy (OE-PAF) capable of high-resolution flow speed measurement of a homogeneous medium. As a heating source, an intensity-modulated CW laser—acting as a “writing” beam—generates temperature variations within the flowing medium. A pulsed laser is used as a “reading” beam to generate PA waves, which are detected by a confocally aligned ultrasonic transducer. Since PA signals are sensitive to the local temperature, the heated area generates higher PA signal amplitudes than nearby regions. By scanning the reading beam along the flow direction, we can acquire PA images of the flow that has been photothermally encoded by the writing beam. This method offers three advantages. First, the modulation of the heating beam can be changed to generate different patterns, i.e., we can “write” different “barcodes” into the flow, allowing the heating pattern to be optimized for the best contrast-to-noise ratio. Second, both the photothermal encoding and the PA detection employ endogenous optical absorption contrasts; thus, OE-PAF is label-free. Third, since OE-PAF directly measures the displacement of the encoded flowing medium, thermal diffusion does not directly impact the measurement. Therefore we do not need to calibrate the thermal diffusivity.
Mathematically, we assume that the temperature at the origin x = 0 is modulated by a sinusoidal heating beam, with a function H(t):
| (1) |
where H0 is a constant, f0 is the heating frequency, and t is the heating time. The PA measurement is performed by linearly scanning the PA detection spot along the flow direction, i.e., an imaged blood vessel of interest. Along the motor scanning direction, the temperature change induced by the heating beam can be described as
| (2) |
where ΔT0(x) is the amplitude of the temperature change, x is the distance from the heating point to the PA measurement point, tb is a point on the B-scan (cross-sectional scan) time axis, 2πf0t0 is the initial phase of the heating sinusoidal function (t0 is a constant), vf is the flow speed, and θ is the angle between the flow velocity and motor scanning velocity vectors. The amplitude of the detected PA signal, V, generated by the pulsed laser excitation, is proportional to the local pressure rise, which can be described by [13]
| (3) |
where γ0 and γ’0 are empirical constants related to the Grueneisen parameter, μa(x) is the optical absorption coefficient, and F(x) is the optical fluence of the reading beam. Thus the time-variant part of the PA signal detected by the transducer can be written as
| (4) |
where γ’1(x) = ΔT0(x)γ’0. If the motor scans at a constant speed vm, equation (4) becomes
| (5) |
Equation (5) shows that, due to the blood flow and the motion of the transducer, the frequency of the heating pattern has become [1– vm / (vf cosθ )]f0 ; thus the frequency shift from the heating frequency is
| (6) |
When vm = vfcoxθ, the PA signal becomes time-invariant:
| (7) |
At position x, the PA signal amplitudes vary with the heating time t, which can be described as
| (8) |
By performing cross-correlation between the time-variant PA signals at positions x1 and x2, the time delay Δt between the two signals can be calculated as follows:
| (9) |
where tmeas is the total measurement time. It can be seen that Δt is related to the flow speed as well as the motor scanning speed, a relationship which can be expressed as
| (10) |
where Δx = x2 – x1. If vm >> vf cosθ, or if we assume signals in the same B-scan are acquired at the same time point, then when θ = 0°, equation (10) can be reduced to
| (11) |
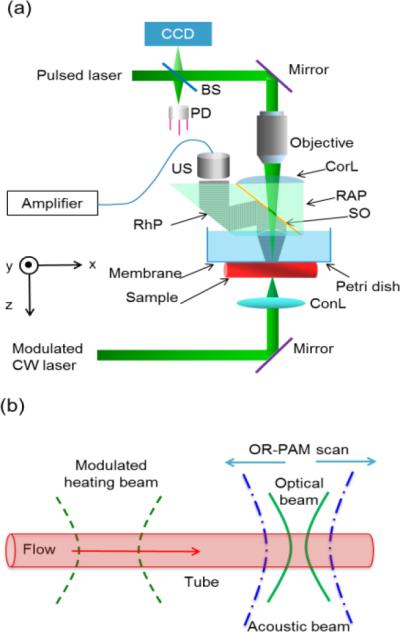
Fig. 1(a) is a schematic of the experimental setup. A second-generation optical-resolution photoacoustic microscopy system (OR-PAM) [14] imaged the heat propagation. A pulsed laser beam (532 nm) with a spot size of ~2 μm was focused onto the sample. The generated PA signals were detected by an ultrasonic transducer with a central frequency of 50 MHz. To achieve high sensitivity, the ultrasound focus was coaxially and confocally aligned with the optical focus. The B-scan rate was 8.3 Hz over a transverse range of 3 mm with 1600 A-lines. An intensity-modulated CW laser light (532 nm wavelength; MLLIII-532, General Optoelectronic) with a spot size of ~0.4 mm heated the flow medium to generate temperature variation. The CW laser (100 mW) was intensity-modulated at 0.5 Hz. The maximum distance between the heating and detection beam was 3 mm, jointly limited by thermal diffusion, signal-to-noise ratio, and scanning range of the PAM system used in the experiment. The minimum distance between the two beams was zero when the centers of the two beam spots coincide. A tube (300 μm inner diameter, VWR® International) filled with red ink solution was connected to a syringe. Flow speeds were set by a syringe pump (BSP-M99, Braintree Scientific Inc.). Fig. 1 (b) is a schematic of an OR-PAM scan for thermal flow measurement in a tube.
Fig. 1.

Schematic of the optically encoded photoacoustic (PA) flowgraphy. (a) Schematic of second-generation OR-PAM system. BS, beam splitter; CCD, charge-coupled device; ConL, condenser lens; CorL, correction lens; CW, continuous wave; PD, photodiode; ; RAP, right-angle prism; RhP, rhomboid prism; SO, silicone oil; US, ultras onic transducer; . (b) Schematic of OR-PAM scan for thermal flow measurement in a tube.
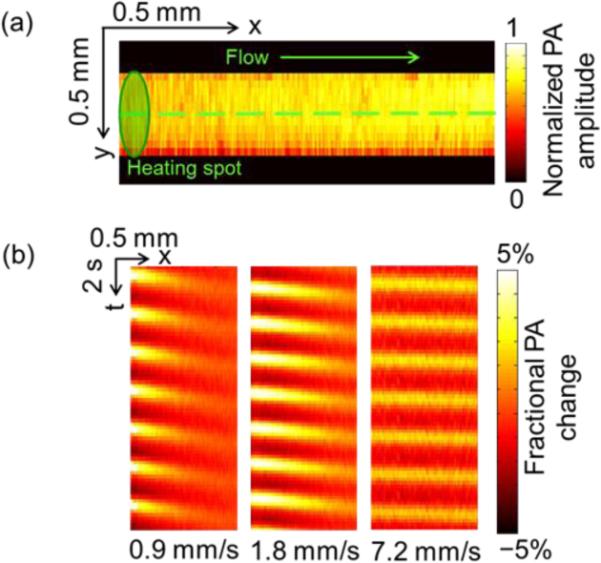
As shown in Fig. 2(a), the PA amplitudes from a tube image without heating were relatively evenly distributed. Fig. 2(b) shows space-time PA images acquired with heating on at three different flow speeds. The images in Fig. 2(b) were obtained after subtracting the signals averaged over the total measurement time. To increase the signal-to-noise ratio (SNR), the PA images were averaged over 8 heating cycles. From Fig. 2(b), it can be seen that the PA signals were modulated by a sinusoidal wave both at the scanning axis (denoted by x) and the heating time axis (denoted by t), as indicated by equation (5) and equation (8). Along the heating time axis of the thermal pattern, the slope of the pattern, Δt / Δx , is the inverse of the flow speed, 1/vf, as indicated by equation (11). Thus it can be inferred that the slope was steeper for slower flow speeds, and vice versa.
Fig. 2.

PA flow images of ink solution in a tube with a modulated heating frequency of 0.5 Hz. (a) Maximum-amplitude projection (MAP) image of a silicone tube fille d with red ink solution. Dashed line: B-scan range. (b) Representative space-time images of a tube along the dashed line in (a) at different flow speeds.
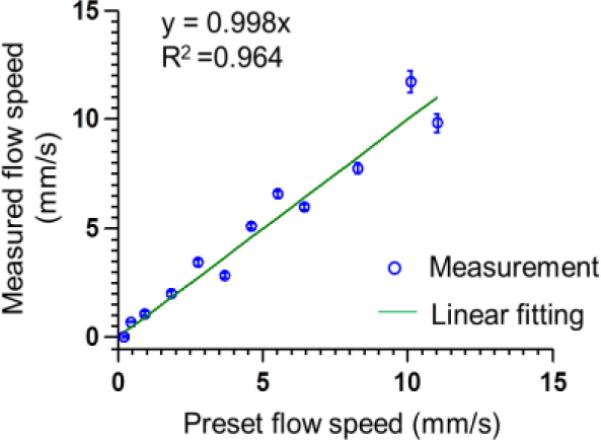
During heating, the maximum PA amplitude was 10.8% greater than the average PA amplitude, corresponding to a 2.2 °C temperature rise (room temperature 20 °C) [13]. Supplementary video 1 shows the thermal waves propagating along the tube. From the video, it can be seen that during the heating, a thermal wave was generated at the heating spot and propagates with the flow. During the measurement, the flow speeds were varied from 0.23 mm/s to 11.00 mm/s. The measured flow speeds were shown in Fig. 3. The straight line is a linear fit of the measurement points with a fitting equation of y = kx. The coefficient k was found to be 0.998. The measurement errors were estimated using the normalized RMSD, which was 2.0%.
Fig. 3.

Measured flow speeds based on optically encoded PA flowgraphy in a silicone tube. Modulated heating frequency: 0.5 Hz. Error bars represent standard errors. N = 10 for each flow speed.
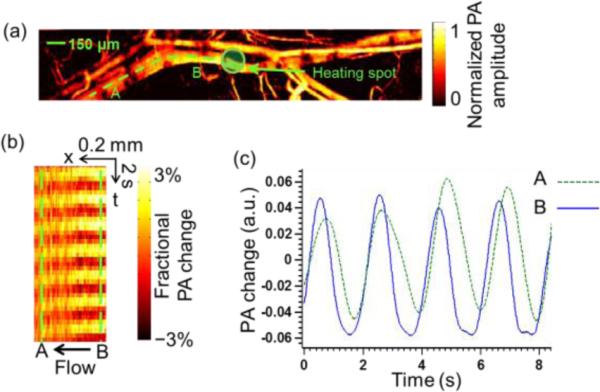
In vivo blood flow measurement was conducted in a nude mouse ear. The heating frequency was 0.5 Hz. The signals were averaged over 16 heating cycles to increase the SNR. Fig. 4 (a) shows a MAP image of a mouse ear. The diameter of the vessel of interest is about 100 μm. The motor scanned from A to B. We used an arbitrary-trajectory scanning technique [15], so that B-scans could follow the paths of curved blood vessels. The heating spot was located at position B. The space-time PA image of the heating pattern is shown in Fig. 4 (b). The image was obtained after the signals averaged over the total measurement time were subtracted. By comparing the signals between position A and position B (marked by the dashed line), we calculated the time delay, from which we determined the flow direction as from position B to position A. Then using equation (11), the flow speed in the mouse ear was calculated to be 0.90 mm/s. During heating, the maximum PA amplitude was 6.6% greater than the average PA amplitude, corresponding to a temperature rise of 2.5 °C (a body temperature of 37 °C was assumed)[13]. Supplementary video 2 shows a second in vivo experiment where the dynamic change in the PA amplitude from the mouse ear vessels was imaged with 0.1 Hz heating. The area near the heating spot shows stronger PA amplitude during the heating duty cycle, verifying the thermal effect. The 2D imaging frame rate was 1 Hz over a 0.8× 1.6 mm2 area, using a MEMS-PAM system [16]. All the animal experimental procedures were in conformance with the laboratory animal protocol approved by Washington University in St. Louis.
Fig. 4.

In vivo flow measurement in a mouse ear with a modulated heating frequency of 0.5 Hz. (a) PA image of vessels in a mouse ear. A, starting poin t for B-scan following the curvature of the vessel. B, ending point of B-scan. Dashed line, B-scan range. (b) Space-time image along the dashed line in (a). (c) PA signal change with time at point A and B.
To achieve repeating heating patterns with sufficient contrast-to-noise ratio, before the next heating cycle, the heating pattern “written” in the previous cycle has to flow fast enough to get out of the original heating spot. i.e., , (vf cosθ )·T ≤ d, where T is the heating period and d is the heating spot size. Given d = 0.4 mm, T = 2 s, and θ = 0°, then vf ≤ 0.2 mm/s. From the equation, it can be seen that decreasing the heating frequency and minimizing the heating spot size could reduce the minimum measureable flow speed. Increasing the sensitivity of the PA system and improving the contrast-to-noise ratio of the heating pattern (e.g., by increasing the heating power) could make the minimum measurable flow speed closer to the theoretical value. Contrariwise, thermal diffusion could smooth out the heating pattern and decrease the contrast-to-noise ratio, which would increase the minimum measurable flow speed.
From equation (10), it can be inferred that the time delay Δt should be positive, i.e., , thus vf ≤ v / cosθ. For our current experimental setup, vm = 25 mm/s, θ = 0°, and thus the maximum measurable flow speed is 25 mm/s.
Though the current experiment setup used a CW laser to generate the sinusoidal thermal pattern, the heating beam could also come from a pulsed laser, and different heating functions could be applied as long as adequate contrast-to-noise ratio is achieved. Note that the proposed method is sensitive to all thermal carriers and can be applied to homogeneous media. With the current setup, the heating beam and detection beam are on the opposite sides of the sample, imposing limitations on the thickness and absorbance of the sample. In the future, an improved setup with the two beams at the same side could be utilized.
In summary, we present an optically encoded photoacoustic flowgraphy in vivo. In this method, the flow was encoded by a thermal pattern. Then, we “read” the pattern using an optical-resolution photoacoustic microscopy system. The flow speed was calculated from PA images by cross-correlation. The proposed technique enabled high-resolution measurement of flow speed as slow as 0.23 mm/s in phantoms and in vivo measurement of blood flow in a mouse ear.
Supplementary Material
Acknowledgments
The authors would like to thank Dr. Konstantin Maslov for helpful discussions and experimental assistance. The authors would also like to thank Prof. James Ballard for his close reading of the manuscript. This research was supported by the National Institutes of Health Grants DP1 EB016986 (NIH Director's Pioneer Award), R01 CA134539, and R01 CA159959. L.V.W. has a financial interest in Microphotoacoustics, Inc. and Endra, Inc., which, however, did not support this work
References
- 1.Yao J, Maslov KI, Wang LV. Technology in cancer research & treatment. 2012;11:301–307. doi: 10.7785/tcrt.2012.500278. [DOI] [PMC free article] [PubMed] [Google Scholar]
- 2.Shung KK. Diagnostic ultrasound: Imaging and blood flow measurements. CRC press; 2005. [Google Scholar]
- 3.Shepherd AP, Öberg PÅ. Laser-Doppler blood flowmetry. Vol. 107. Springer; 1990. [Google Scholar]
- 4.Chen Z, Milner TE, Srinivas S, Wang X, Malekafzali A, van Gemert MJC, Nelson JS. Opt. Lett. 1997;22:1119–1121. doi: 10.1364/ol.22.001119. [DOI] [PubMed] [Google Scholar]
- 5.Wang LV, Hu S. Science. 2012;335:1458–1462. doi: 10.1126/science.1216210. [DOI] [PMC free article] [PubMed] [Google Scholar]
- 6.Fang H, Maslov K, Wang LV. Applied Physics Letters. 2007;91:264103–264103. [Google Scholar]
- 7.Brunker J, Beard P. J Acoust Soc Am. 2012;132:1780–1791. doi: 10.1121/1.4739458. [DOI] [PubMed] [Google Scholar]
- 8.Yao J, Maslov KI, Shi Y, Taber LA, Wang LV. Optics letters. 2010;35:1419–1421. doi: 10.1364/OL.35.001419. [DOI] [PMC free article] [PubMed] [Google Scholar]
- 9.Beard P. Interface focus. 2011;1:602–631. doi: 10.1098/rsfs.2011.0028. [DOI] [PMC free article] [PubMed] [Google Scholar]
- 10.Sheinfeld A, Eyal A. Proc. SPIE. 2013;8581:85881. [Google Scholar]
- 11.Wang L, Xia J, Yao J, Maslov KI, Wang LV. Phys Rev Lett. 2013;111:204301. doi: 10.1103/PhysRevLett.111.204301. [DOI] [PMC free article] [PubMed] [Google Scholar]
- 12.Wang LV, Wu H.-i. Biomedical optics: principles and imaging. Wiley. com; 2012. [Google Scholar]
- 13.Hu S, Maslov K, Wang LV. Opt. Lett. 2011;36:1134–1136. doi: 10.1364/OL.36.001134. [DOI] [PMC free article] [PubMed] [Google Scholar]
- 14.Yeh C, Soetikno B, Hu S, Maslov KI, Wang LV. Proc. SPIE. 2014;8943:8943591. [Google Scholar]
- 15.Yao J, Huang C-H, Wang L, Yang J-M, Gao L, Maslov KI, Zou J, Wang LV. J. Biomed. Opt. 2012;17:0805051–0805053. doi: 10.1117/1.JBO.17.8.080505. [DOI] [PMC free article] [PubMed] [Google Scholar]
Associated Data
This section collects any data citations, data availability statements, or supplementary materials included in this article.


