Abstract
PTEN encodes a lipid phosphatase that is underexpressed in many cancers owing to deletions, mutations or gene silencing1–3. PTEN dephosphorylates phosphatidylinositol 3,4,5-triphosphate (PIP3), thereby opposing the activity of class I phosphatidylinositol 3-kinases (PI3Ks) that mediate growth and survival factors signaling through PI3K effectors such as AKT and mTOR2. To determine whether continued PTEN inactivation is required to maintain malignancy, we generated an RNAi-based transgenic mouse model that allows tetracycline-dependent regulation of PTEN in a time- and tissue-specific manner. Postnatal PTEN knockdown in the hematopoietic compartment produced highly disseminated T-cell leukemia (T-ALL). Surprisingly, reactivation of PTEN mainly reduced T-ALL dissemination but had little effect on tumor load in hematopoietic organs. Leukemia infiltration into the intestine was dependent on CCR9 G-protein coupled receptor (GPCR) signaling, which was amplified by PTEN loss. Our results suggest that in the absence of PTEN, GPCRs may play an unanticipated role in driving tumor growth and invasion in an unsupportive environment. They further reveal that the role of PTEN loss in tumor maintenance is not invariant and can be influenced by the tissue microenvironment, thereby producing a form of intratumoral heterogeneity that is independent of cancer genotype.
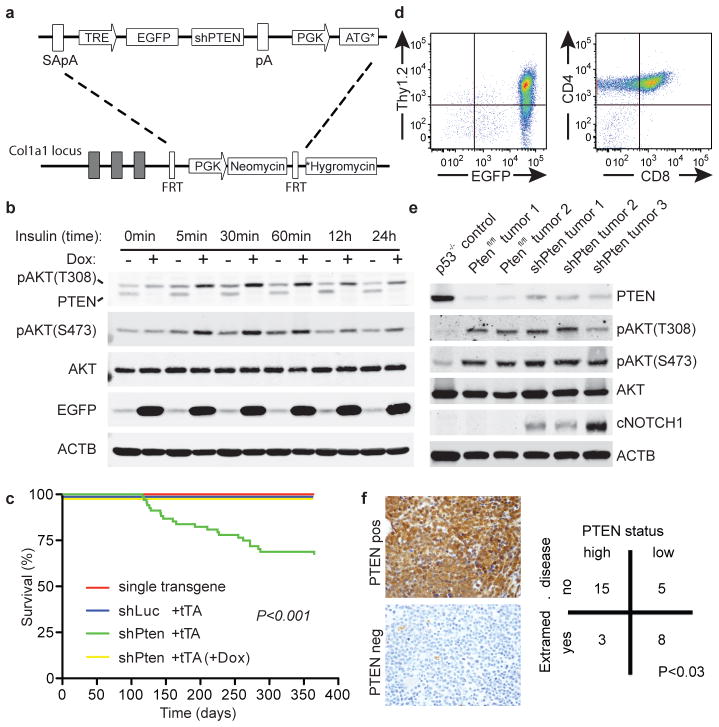
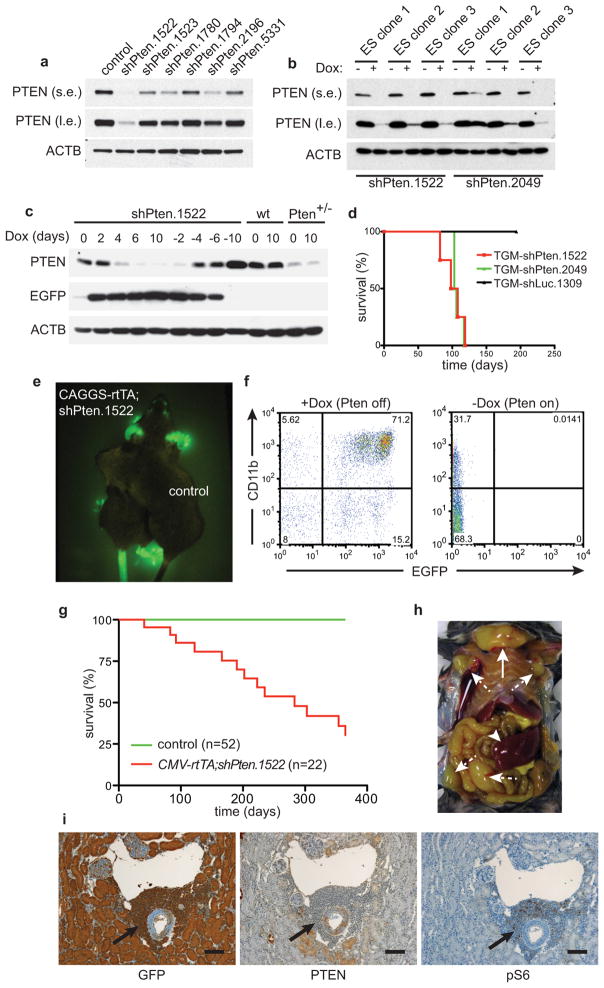
Stable RNA interference using short-hairpin RNAs (shRNAs) provides a powerful approach for studying tumor suppressor gene activity in vitro and in vivo4–6. To explore the role of PTEN loss in tumor maintenance, we developed shRNA transgenic mouse lines targeting Pten using miR30-based shRNAs expressed from an inducible tetracycline responsive element (TRE) promoter6 (Fig. 1a and Extended Data Fig. 1). Murine embryonic fibroblasts (MEFs) obtained from E13.5 embryos of shPten;R26-rtTA2 double transgenic mice displayed reversible knockdown of PTEN upon doxycycline (Dox) addition and withdrawal, which correlated with increased AKT phosphorylation following insulin stimulation (Extended Data Fig. 1c and Fig. 1b). As expected7,8, Dox-treated mice expressing shPten in multiple tissues developed several tumor types including T cell malignancies (Extended Data Fig. 1e–i).
Figure 1.
Pten shRNA transgenic mice develop disseminated CD4/CD8 double-positive (DP) T-cell leukemia. (A) Outline of the targeting construct and the ES cell targeting strategy. SA –splice acceptor site. pA – polyadenylation site. TRE – tetracycline responsive element promoter. EGFP – enhanced green fluorescent protein. PGK – phosphoglycerate kinase promoter. ATG*-truncated ATG sequence. FRT – FLP recognition target. *Hygromycin – ATG-less hygromycin cDNA. (B) Immunoblot (WB) analysis of murine embryonic fibroblasts from shPten.1522;Rosa26-rtTA2 transgenic mice ±doxycycline (Dox) for 5 days at indicated timepoints after stimulation with 100 nM insulin. (C) Overall survival of Vav-tTA;shPten mice (n=49) and controls (n=98, P<0.001 by log-rank). (D) Flow cytometric analysis of a representative primary Vav-tTA;shPten tumor for EGFP, Thy1.2, CD4 and CD8 (n=10). (E) WB analysis of T-cell tumors from Trp53−/−, Ptenfl/fl;Lck-Cre and Vav-tTA;shPten mice for the indicated proteins. (F) PTEN immunohistochemistry (IHC) of bone marrow samples of 31 human patients with T-ALL categorized as positive (upper left panel) or low/negative (lower left panel). Association of PTEN expression with status for disseminated disease was calculated using a contingency table (Fisher’s Exact Test).
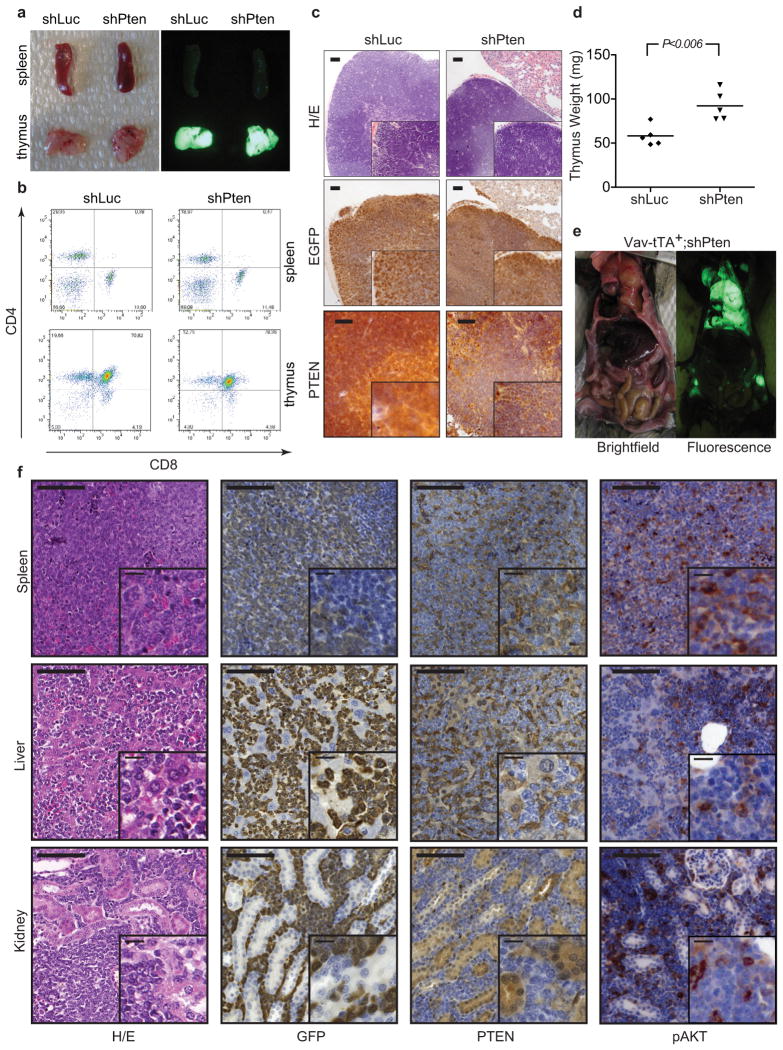
Owing to the high frequency of T cell disease in the shPten mice and the frequent inactivation of PTEN in human T-ALL9, we focused on the effects of PTEN suppression and reactivation in the lymphoid compartment. We crossed shLuc and shPten mice to a Vav-tTA transgenic line, which expresses a “tet-off” tet-transactivator in early B and T cells10 and drives shRNA expression in a manner that is silenced upon Dox addition (Extended Data Fig. 2 and data not shown). The Vav-tTA;shPten displayed thymic hyperplasia (Extended Data Fig. 2a–d) and, by 16 weeks, a subset deteriorated and had to be euthanized (Fig. 1c), whereas control animals remained healthy (P<0.001). Diseased mice showed massive EGFP-positive tumors that consisted of Thy1.2+CD4+CD8+ double positive (DP) T-cells filling the thoracic cavity and infiltrating spleen, lymph nodes as well as extrahematopoietic organs like the liver, kidney and intestine (Fig. 1d, Extended Data Fig. 2e+f, Ext. Data Fig. 3a and data not shown). shPten-expressing tumors demonstrated marked PTEN knockdown and increased AKT phosphorylation comparable to Pten null T-cell malignancies [Fig. 1e, see ref. 11].
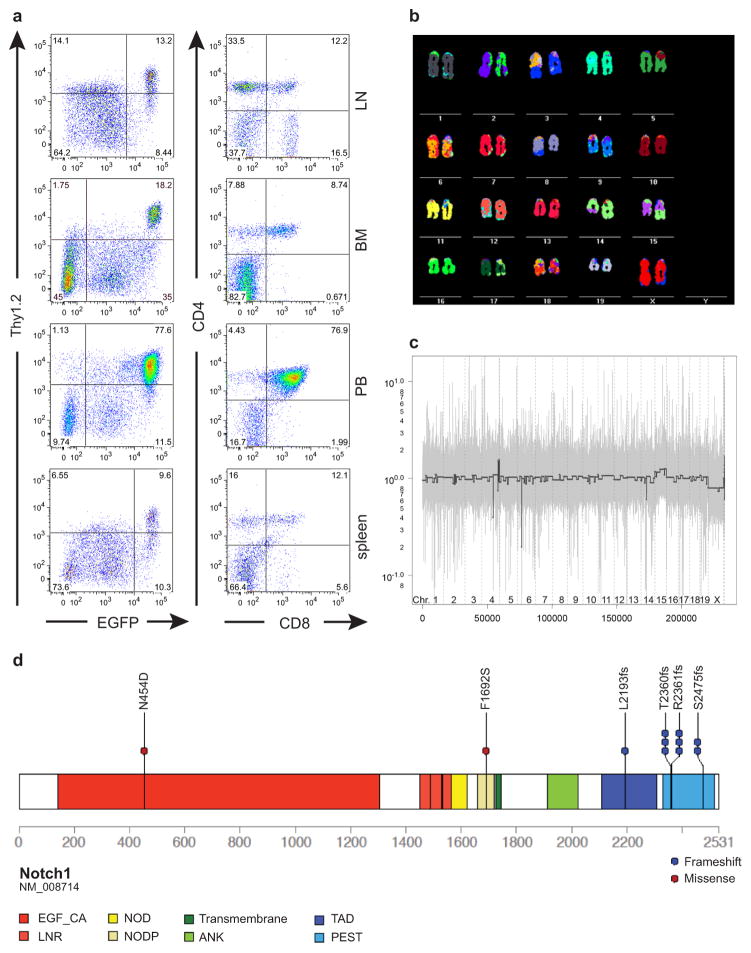
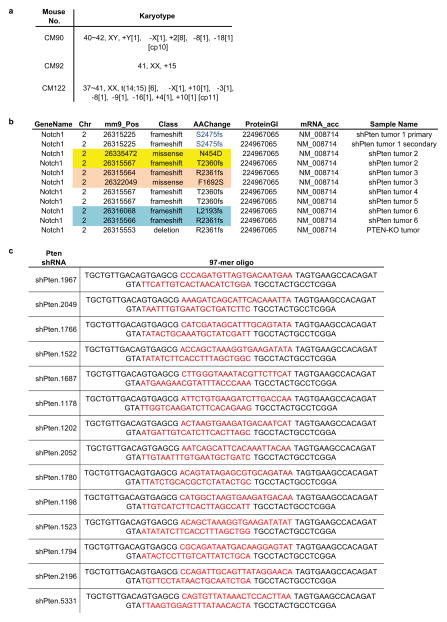
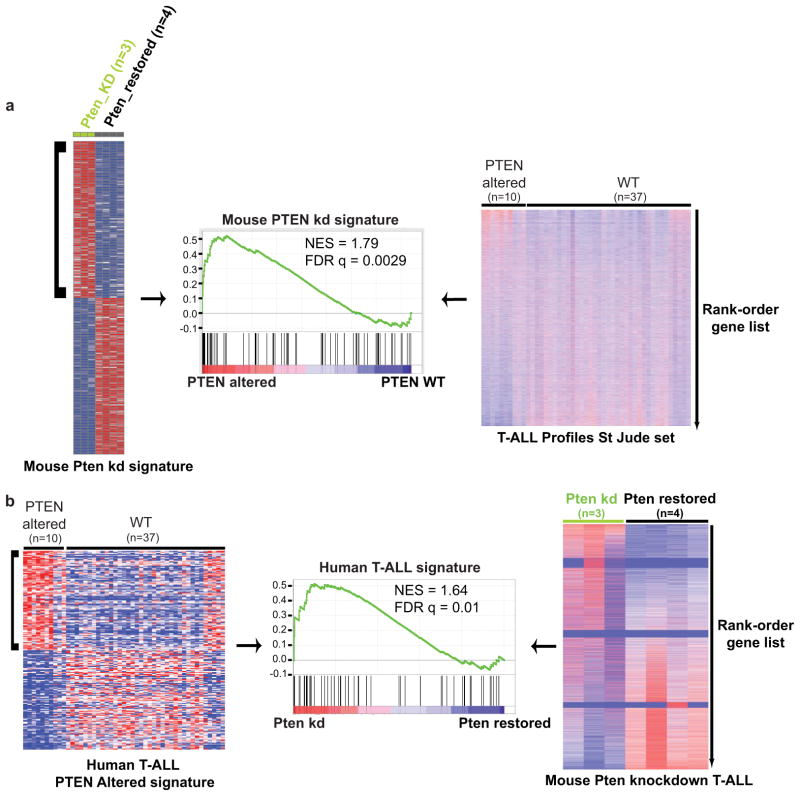
Human T-ALL with PTEN loss often overexpress MYC and can harbor NOTCH1 and CDKN2A mutations12. Analysis of murine shPten-expressing tumors by spectral karyotyping, comparative genomic hybridization (CGH) and sequencing of the T cell receptor beta chain gene showed that most primary tumors were clonal and harbored the same recurrent translocations between the Tcra locus and Myc observed in a Pten knockout model and a small subset of human T-ALL (Extended Data Fig. 3b+c and Extended Data Fig. 4a)13,14. One shPten T-ALL showed a Cdkn2a deletion by CGH and 6 out of 8 tumors analyzed showed activating mutations in the Notch1 PEST domain (Fig. 1e, Extended Data Fig. 3c+d, Extended Data Fig. 4b). Gene set enrichment analysis (GSEA) of gene expression profiles obtained from shPten leukemia demonstrated enrichment for a human PTEN mutated T-ALL signature, whereas conversely profiles from human PTEN mutated T-ALLs were enriched for a murine shPten signature (Extended Data Fig. 5a+b). Thus, although all the T-cell leukemias were initiated by a Pten shRNA, they acquire molecular features reminiscent of the human disease12,13,15.
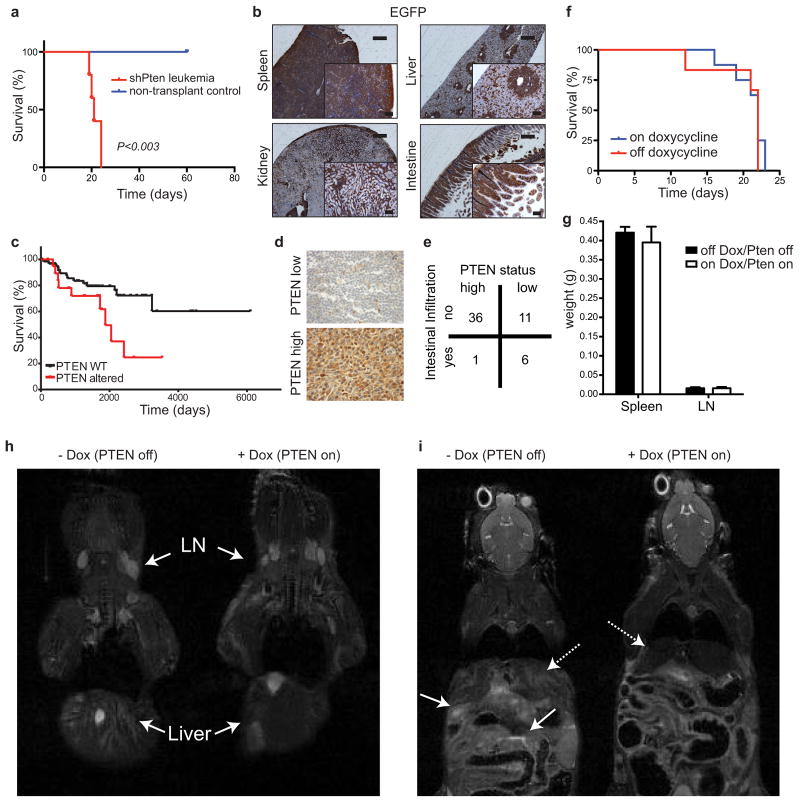
The leukemia arising in shPten mice was highly malignant, and rapidly produced disease when transplanted into recipient mice (Extended Data Fig. 6a). Of note, since the Vav-tTA;shPten transgenics were of a mixed genetic background, Rag1−/− recipients were used to avoid graft rejection. These recipients succumbed to a highly disseminated form of T-ALL consisting of CD4/CD8 DP cells that rapidly took over the hematopoietic organs, accumulated to high levels in the peripheral blood (PB), and spread to the liver, kidney and intestine (Fig. 2d, Extended Data Fig. 6b). Remarkably, decreased PTEN levels were associated with disease dissemination and lower survival in T-ALL patients (Fig. 1f and Extended Data Fig. 6c), and were also linked with intestinal infiltration in patients with peripheral T-cell lymphoma (Extended Data Fig. 6d+e). The association between PTEN loss and disease dissemination in murine and human T cell malignancies underscores the relevance of the model to human disease.
Figure 2.
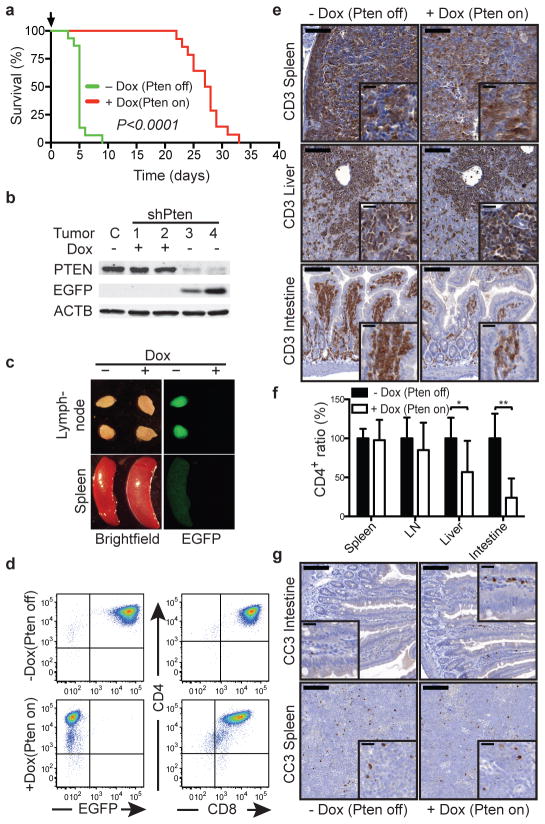
The impact of PTEN reactivation on leukemia viability is influenced by anatomical site. (A) Overall survival of Rag1−/− mice transplanted with 1×10⁵ cells from Vav-tTA;shPten (shPten) tumors and treated with Dox (Pten on; n=14), or untreated controls (Pten off; n=15), P<0.0001 by log-rank test. (B) WB analysis of splenic tumor cells from control, untreated, and mice treated with Dox for 5d. (C) Brightfield and EGFP images of lymph nodes and spleen from an untreated mouse (Pten off) and mouse treated with Dox for 5d (Pten on) (n=10). (D) Flow cytometric analysis of CD4, EGFP and CD8 expression in tumor cells from the peripheral blood of mice ±Dox for 5d (n=10). (E) IHC analysis for CD3 expression in the spleen, liver and small intestine from shPten T-ALL transplanted mice ±Dox for 5d (n=3 per group). Scale bars:100 μm (20 μm in insets). (F) Relative tumor infiltration in the indicated organs of transplanted Rag1−/−mice off (n=7) and on (n=7) Dox, quantified by flow cytometric analysis of CD4+ cells; * P<0.05, ** P<0.01 by t-test. (G) IHC staining for cleaved caspase 3 in the spleen and intestine from mice 10d after transplant with shPten T-ALL either treated with Dox for 36h or left untreated. Representative sections from one of three mice per cohort are shown. Scale bars: 100 μm (20 μm in insets).
We reasoned that the transplanted leukemias described above would be ideal for our experiments as they are highly malignant such that individual primary isolates can be studied for their response to different perturbations in multiple secondary recipients. Recipients were monitored for disease development by weekly analysis of peripheral blood (PB) for the presence of EGFP+ (shPten expressing) cells. Upon disease manifestation, a cohort of mice was given Dox to silence the shRNA and reactivate PTEN. Strikingly, Dox treatment almost tripled the survival time of mice harboring Vav-tTA;shPten leukemia (Fig. 2a; P<0.0001) but had no effect on mice harboring Pten−/− leukemia (Extended Data Fig. 6f). Immunoblotting of leukemic cells harvested from mice indicated that the system worked as expected: hence, Dox addition led to upregulation of Pten mRNA (data not shown), silenced EGFP and reestablished PTEN to endogenous levels (Fig. 2b and Extended Data Fig. 7d). Therefore, PTEN reactivation had a marked anticancer effect but was by no means curative.
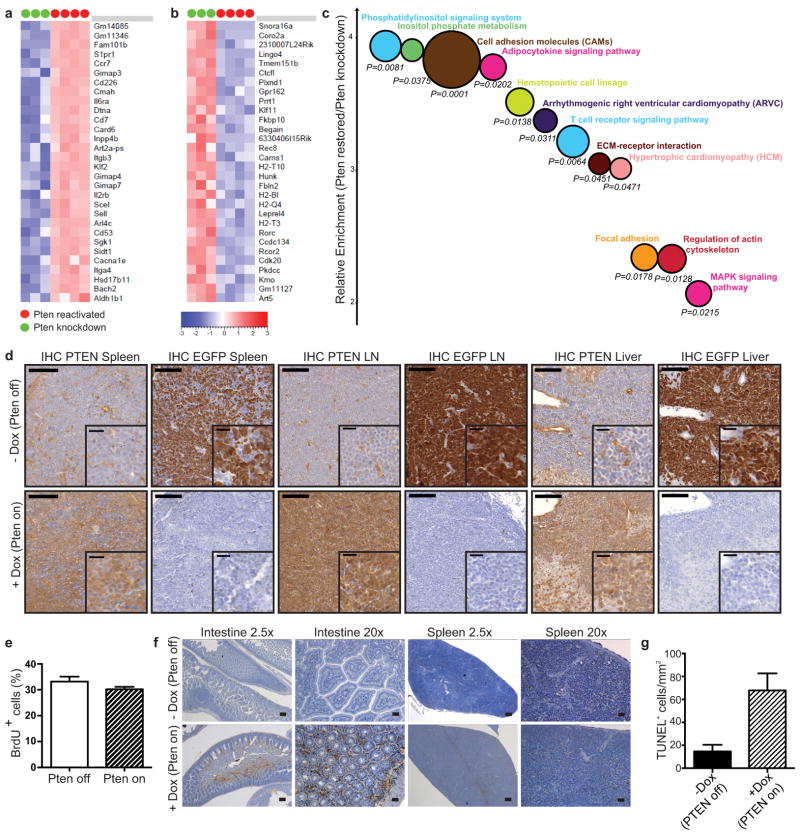
Leukemia-bearing mice showed magnetic resonance imaging (MRI) signals in multiple hematopoietic compartments, the liver, and intestine (Extended Data Fig. 6h+i and data not shown). While PTEN reactivation had no overt effect on tumor growth in the lymph nodes or spleen, it visibly decreased tumor infiltration into intestine and liver (Fig. 2c and Extended Data Fig. 6g–i). These findings were corroborated by immunohistochemistry and flow cytometric quantification of CD4+ leukemic cells (Fig. 2e,f). Notably, Dox treatment had a minimal impact on the proliferation or apoptosis of leukemic cells residing in the lymph nodes and spleen, but triggered apoptosis in leukemic cells that had disseminated into the intestine (Fig. 2g and Extended Data Fig. 7e–g). Thus, the impact of Pten expression on disease progression is dictated by the anatomical location of the leukemic cell.
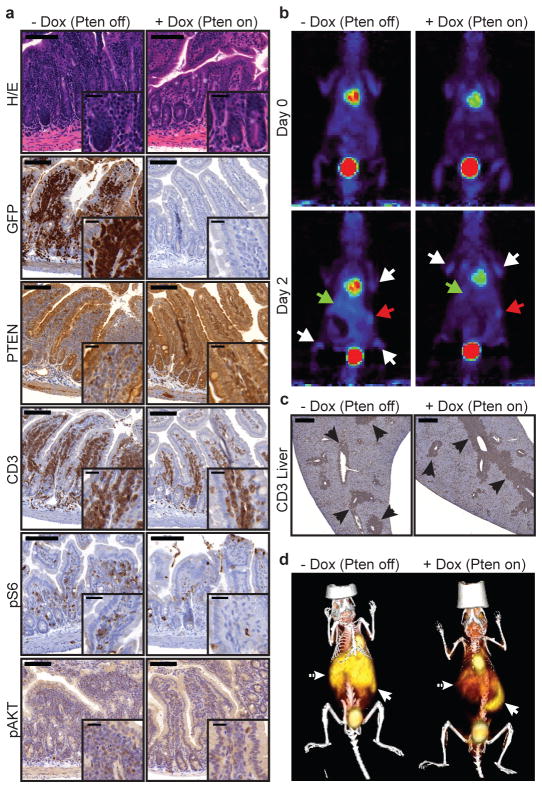
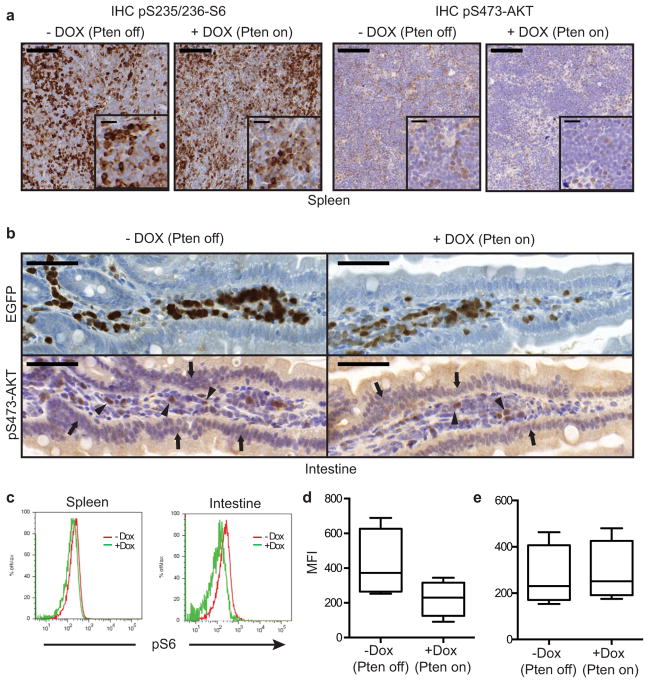
We next assessed the phosphorylation state of key PI3K effectors in tissue sections by IHC and pathway functionality by positron emission tomography (PET) of 18F-fluorodeoxy glucose (FDG) uptake into leukemia cells16. The heterogeneous responses correlated with the ability of PTEN to effectively suppress aberrant PI3K signaling: whereas S6 and AKT phosphorylation were reduced in disseminated leukemic cells obtained from the intestine, it persisted in the leukemic cells harvested from the spleen of the same animal (Fig. 3a and Extended Data Fig. 8). Similarly, mice displayed a marked reduction in FDG signal stemming from the liver and intestine within 2 days of PTEN reactivation, an effect that could not simply be accounted for by loss of leukemia burden (Fig. 3b+c). Conversely, the FDG signal emanating from the spleen and bone marrow (BM) remained strong (Fig. 3b,d and Suppl. Video 1+2). The divergent responses to PTEN activation in a clonal leukemia imply that the control of the PI3K pathway can be dramatically affected by microenvironmental factors.
Figure 3.
Tissue-dependent effects of PTEN reactivation on PI3K signaling. (A) Small intestinal sections from shPten T-ALL transplanted mice ±Dox were stained with hematoxylin/eosin (HE) or by IHC for the indicated molecules. Representative sections from one of three mice per cohort are shown. Scale bars represent 100 μm (20 μm in insets). (B) Serial 18F-FDG PET analysis of shPten T-ALL transplanted mice before and 2d after beginning of Dox treatment. White arrows: BM, red arrow: spleen, green arrow: liver/intestine. Representative images from two out of 12 analyzed mice are shown. (C) CD3 IHC staining of shPten tumor infiltrations in the liver of mice ±Dox 4d after treatment initiation (n=3 per group). Arrows highlight CD3+ tumor infiltrates. Scale bars represent 500 μm. (D) 18F-FDG PET/CT analysis of shPten T-ALL transplanted mice ±Dox 4d after beginning of Dox treatment. Full arrow: spleen, dashed arrow: liver/intestine. Representative images from two out of six analyzed mice are shown.
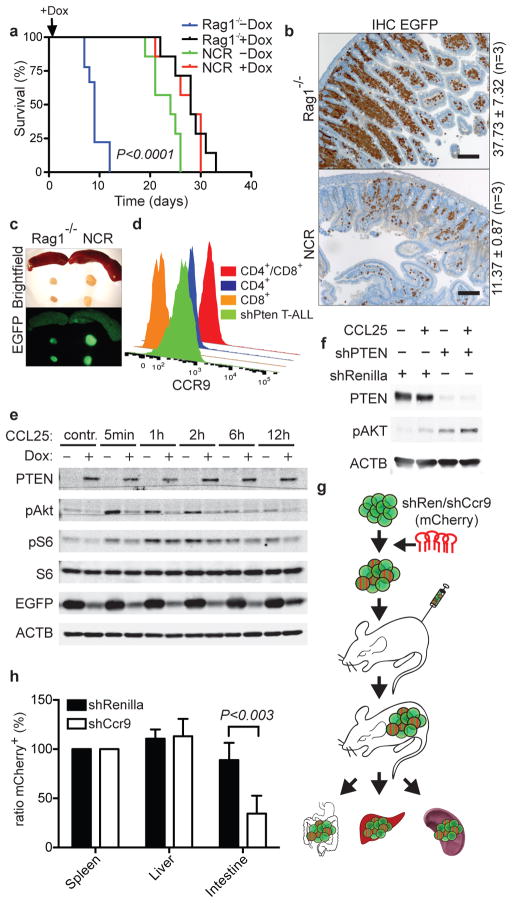
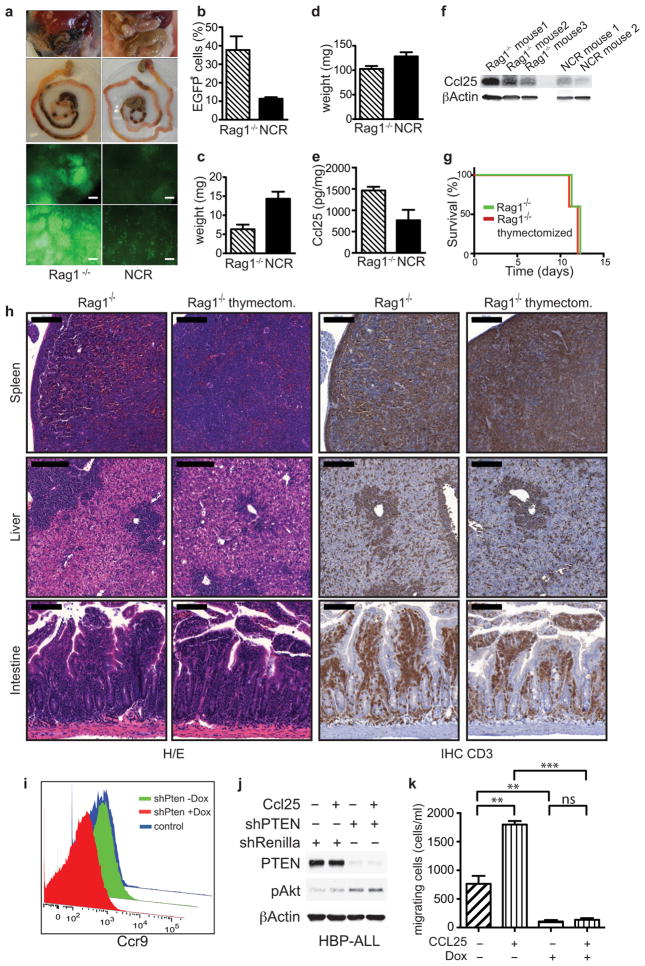
Surprisingly, untreated NCR nude (NCR) mice transplanted with the same number of shPten tumor cells survived as long as Rag1−/− recipient mice treated with Dox, and did not show a survival advantage following Dox addition (Fig. 4a). The untreated NCR recipients displayed vastly reduced intestinal dissemination of leukemic cells compared to normal and thymectomized Rag1−/− recipients (Fig. 4b and Extended Data Fig. 9a,b,g,h), while spleen and lymph nodes were strongly affected (Fig. 4c and Extended Data Fig. 9c+d). Apparently, genetic differences between Rag1−/− and NCR mice contribute to variation in disease aggressiveness and the response to PTEN reactivation.
Figure 4.
CCL25-CCR9 chemokine signaling contributes to leukemia dissemination. (A) Overall survival of Rag1−/− mice (n=9; −Dox, n=7; +Dox) and NCR mice (n=7; −Dox, n=7; +Dox) transplanted with 1×10⁵ shPten leukemia cells. Survival of Rag1−/−(−Dox) vs. NCR(−Dox) mice; P<0.0001 by log-rank test. (B) IHC staining for EGFP in intestinal sections from Rag1−/− and NCR mice transplanted with shPten leukemia (n=3 per cohort). Scale bars: 100 μm. Numbers show mean fraction (±SD) of infiltrating EGFP+ tumor cells of total viable cells as determined by flow cytometry (P<0.03 by t-test). (C) Representative images of lymph nodes and spleens from Rag1−/− and NCR mice (n=7). (D) CCR9 receptor expression on shPten leukemia cells, normal CD4/CD8 double-positive and CD4 or CD8 single-positive thymic T-cells measured by flow cytometry (n=3 per group). (E) WB analysis of indicated proteins in shPten leukemic cells ±Dox after stimulation with 500 ng/ml CCL25 for the indicated time. (F) WB of indicated proteins in human T-ALL1 cells infected with either shRenilla control or shPTEN.1522 and ±stimulation with CCL25 for 15 min. (G) Outline of competition experiment of untransduced vs. shCcr9-mCherry- or control shRenilla-mCherry transduced EGFP+ shPten tumor cells. (H) Normalized ratio of mCherry+;EGFP+ cells over all EGFP+ cells isolated from spleen, liver and intestine of 5 mice per cohort from 2 independent transplantations. Cells were analyzed by flow cytometry and normalized to the mCherry/EGFP ratio in the spleen to account for differences in transduction rate.
Whereas Rag1−/− mice are defective in immunoglobulin and T cell receptor gene rearrangement, NCR mice have mutations in Foxn1, a gene that controls terminal differentiation of epithelial cells in the thymus and other organs17. Among other changes, NCR mice show decreased expression of Ccl2518,19, which encodes a chemokine that is mainly expressed by epithelial cells in the thymus and small intestine and acts as an important chemoattractant for T-cells in the gut20,21. CCL25 acts through CCR9, a GPCR that can signal through the PI3K pathway and is expressed on a subset of developing thymocytes22,23. Signaling through a related receptor, CCR7, is important for leukemia dissemination into the central nervous system24; moreover, the CCL25/CCR9 network is required for T cell dissemination during inflammatory bowel disease, which can be countered by CCR9 antagonists currently in clinical trials25,26. CCL25 levels were decreased in the intestine of NCR mice (Extended Data Fig. 9e+f), while CCR9 was highly expressed on the shPten leukemia cells (Fig. 4d). Notably, CCR9 expression was not affected by PTEN reactivation as determined by FACS and RNAseq analysis (Extended Data Fig. 9i and data not shown).
To test if PTEN influences T-ALL homing and survival in the intestine by modulating CCL25 signaling, shPten T-cell leukemia isolates were treated with CCL25 (± Dox to modulate PTEN), and cell signaling and motility was assessed in short-term culture. Whereas CCL25 stimulation had little impact on PI3K signaling in the presence of PTEN, PTEN knockdown sensitized cells to CCL25 induced AKT phosphorylation and, to a lesser extent, S6 phosphorylation (Fig. 4e). Similar results were obtained with two human T-ALL lines transduced with either shPTEN or a control shRNA (Fig. 4f and Extended Data Fig. 9j). CCL25 addition also increased migration of murine shPten T-ALL cells in a transwell assay, and the effect was largely abrogated by PTEN reactivation (Extended Data Fig. 9k).
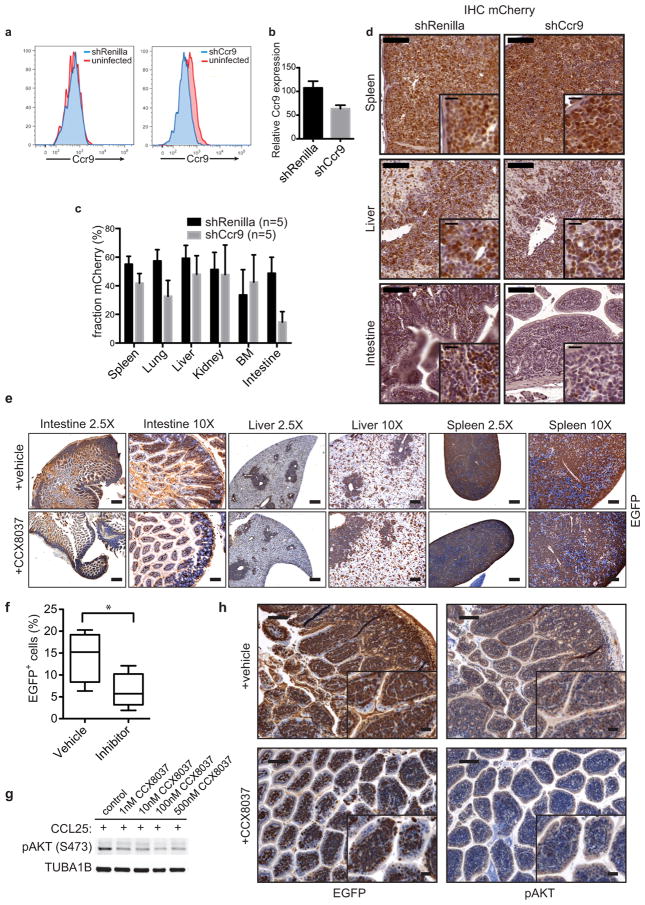
Dual-color in vivo competition experiments were performed to assess the contribution of CCR9 signaling to T-ALL dissemination (Fig. 4g). After identifying shRNAs efficient at knocking down CCR9 expression (Extended Data Fig. 10a+b), EGFP+ shPten leukemic cells were transduced with either shCcr9 or shRenilla control shRNAs coexpressing the mCherry red-fluorescent protein (Fig. 4g and Extended Data Fig. 10d). Upon transplantation and subsequent disease development, mice were euthanized and the fraction of EGFP/mCherry+ cells vs. all EGFP+ cells was determined in various organs (Fig. 4g,h). shCcr9-expressing T-ALL cells showed significantly decreased abundance in the intestine but not the spleen or liver (Fig. 4h and Extended Data Fig. 10c+d). Mice transplanted with shPten leukemic cells were also treated with a small molecule inhibitor for CCR9 that is in clinical trials for the treatment of inflammatory bowel disease26. Although the effects on survival were modest, leukemia dissemination was reduced in the intestine, whereas cells in the spleen and liver were unaffected (Extended Data Fig. 10e–h and data not shown). Hence, in the intestine, PTEN suppression promotes leukemic cell dissemination and maintenance by modulating CCL25-CCR9 signaling.
In human cancers, PTEN deletions often coincide with tumor expansion, metastasis, and a generally worse prognosis9,27,28, results confirmed and extended for T cell disease in this report. Using a powerful new mouse model enabling reversible suppression of endogenous PTEN expression, we show that PTEN loss can promote tumor cell survival at distant sites by amplifying weak environmental cues that enable tumor cells to survive in an otherwise non-supportive microenvironment. Accordingly, the promiscuous yet passive ability of PTEN to attenuate PI3K signaling2 may be influenced by the nature and intensity of PIP3 generating signals in different microenvironments, and targeting such tissue specific signals might present a valid strategy to treat cancer spread. Still, the requirement for PTEN loss in tumor maintenance is not absolute and can be influenced by genetic context29,30 and, as shown here, the tumor microenvironment. These observations paint a more complex picture of how PTEN inactivation drives tumor maintenance, and reveal an interplay between tumor and microenvironment that would not be predicted from studies on cultured cells. Nonetheless, this interplay produces a form of intratumoral heterogeneity that is independent of genotype but can impact disease progression and perhaps the clinical response to molecularly targeted therapies.
Additional Methods
Constructs and shRNAs
To identify potent shRNAs targeting murine and human Pten, various 97bp oligonucleotides predicted from sensor-based and other shRNA design algorithms (Extended Data Figure 4c and data not shown)31,32 were XhoI-EcoRI cloned into the miR30 cassette of the MLP vector and tested as described previously (Extended Data Fig. 1a)33. The two most efficient murine Pten shRNAs (Pten.1522 and Pten.2049) were cloned into a recombination-mediated cassette exchange (RCME) vector (cTGM) targeting the Col1a1 locus (see Fig. 1a) 6,34. For knock down of human PTEN, the Pten.1522 shRNA, which showed complete overlap with the human PTEN sequence, was used. For knockdown of murine Ccr9, multiple shRNAs were designed, cloned and tested as described above. The two most efficient shRNAs shCcr9.904 (97-mer: 5′-TGCTGTTGACAGTGAGCGCAAGGATAAGAATGCCAAGCTATAGTGAAGCCACAGAT GTATAGCTTGGCATTCTTATCCTTATGCCTACTGCCTCGGA-3′) and shCcr9.2357 (97-mer: 5′-TGCTGTTGACAGTGAGCGCCCCAACAGTTTACAACCTTTATAGTGAAGCCA CAGATGTATAAAGGTTGTAAACTGTTGGGATGCCTACTGCCTCGGA-3′) were cloned into a LMN-cherry vector (MSCV-miR30-pgk-NeoR-IRES-mCherry) for dual-color competition assays (see below).
ES cell targeting and generation of transgenic mice
Two potent shRNAs against murine Pten were cloned into a cassette that links EGFP and shRNA expression downstream of TRE, and targeted into a defined locus downstream of the collagen, type I, alpha 1 (Col1a1) gene in KH2 ES cells expressing the reverse transactivator (rtTA2) from the Rosa26 promoter34 by recombination-mediated cassette exchange (RMCE) (Fig. 1a and Extended Data Fig. 1a)6,34. Southern blotting showed correct transgene insertion, and Dox-inducible knockdown of endogenous PTEN was confirmed by Western blot analysis (Extended Data Fig. 1b).
Germline transgenic mice were generated by tetraploid embryo complementation. Murine embryonic fibroblasts (MEFs) were generated from d13.5 old embryos according to standard protocols. Since both shRNAs caused a similar degree of Pten knockdown and PI3K pathway activation and equally promoted tumorigenesis in in vivo transplantation experiments (Extended Data Fig. 1c,d and data not shown), we focused subsequent analysis on a single (shPten.1522) transgenic line.
Mice were bred to CMV-rtTA, CAGGS-rtTA and Vav-tTA transactivator lines 6,10,35 to generate compound heterozygous or homozygous (e.g. shPten+/−;CMV-rtTA+/− or shPten+/+;Vav-tTA+/+) double-transgenic mice using standard breeding techniques. To induce shRNA expression, Pten and firefly luciferase (Luc) or Renilla luciferase (Ren) shRNA mice bred to CMV-rtTA or CAGGS-rtTA mice were put on food containing 625mg/kg doxycycline (Harlan Teklad, IN, USA) immediately after weaning. As predicted from knockout mice7,36, most double transgenic mice harboring the inducible shPten allele together with the broadly expressing CMV-rtTA or the CAGGS-rtTA3 transactivator strains6,35 developed tumors within 12 months of Dox addition (Extended Data Fig. 2; data not shown). Dox food was also used to shut off shRNA expression in Vav-tTA transgenic animals at different time points. For the Vav-tTA;shPten mice survival studies, a number of Vav-tTA+;shPten+ mice (n=49) and controls (Vav-tTA+;shLuc+ (n=20), Vav-tTA+;shPten− (n=68), Vav-tTA+;shPten+, +Dox (n=10)) were generated and analyzed. No difference in phenotype was observed between heterozygous (shPten+/−;Vav-tTA+/−) and homozygous mice (shPten+/+;Vav-tTA+/+). All mouse experiments were performed in accordance with institutional and national guidelines and regulations and were approved by the Institution Animal Care and Use Committee [IACUC#06-02-97-17 (Cold Spring Harbor Laboratory) and #11-06-017 (Memorial Sloan Kettering Cancer Center)].
Statistics and reagents
For all murine survival studies, a group size of at least 5 animals per condition was chosen, which allowed the detection of two fold differences in survival with a power of 0.89, assuming a two-sided test with a significance threshold α of 0.05 and a standard deviation of less than 50% of the mean. For the primary animals, all mice with the correct genotype were included in the analysis. For the transplantation experiments, all mice receiving similar amounts of transplanted cells as determined by flow cytometric and/or whole-body immunofluorescent evaluation 5–10 days after transplant were included in the analysis. For the reactivation and treatment experiments, animals were assigned into different groups by random picking from the non-selected transplanted group of mice 5–10 days after transplant. Blinding of animals in the reactivation/inhibitor treatment studies was not feasible, because of requirements by the local animal housing facility to mark cages if containing special food/treatment.
Appropriate statistical tests were applied as indicated, including non-parametric tests for experiments where sample size was too small to assess normal distribution. All t-tests and derivatives were two-sided. For all tests, variation was calculated as standard deviation and included in the graphs as error bars. To investigate if PTEN expression has an impact on tumor dissemination in human T-ALL, we performed IHC staining for PTEN on bone marrow (BM) sections from 31 patients with newly diagnosed T-ALL, for which clinical data on disease dissemination was available. Due to the relatively low number of patient specimens and because the variables were non-linear, we analyzed the data in a contingency table using Fisher’s exact test. We also re-analyzed the contingency table using Berger’s test, with similar results (Berger and Boos, Journal of the American Statistical Association 1994). For probing an association between PTEN expression status and intestinal infiltration in human T-cell lymphoma patients, the same statistical tests were applied.
All antibodies used for Western blot analysis were purchased from Cell Signaling Technology (Danvers, MA) unless otherwise specified, including the antibodies against PTEN (cat#9188), pAKT(S473, cat#4060), pAKT(T308, cat#2965), Akt (cat#4691), S6(cat#2317), pS6(S235/236, cat#4858), cleaved Notch1 (cat#4147), Erk (p44/42 MAPK, cat#4696), phospho-Erk1/2 (p-p44/42 MAPK (Thr202/Tyr204), cat#4370). For intracellular flow cytometric analysis of pS6(S235/236), directly Pacific-Blue fluorescence-coupled antibodies were purchased from Cell Signaling (cat#8520).
Antibodies for flow cytometry were purchased from BioLegend (San Diego, CA) unless otherwise specified. Mouse antibodies included CD3 (clone 145-2C11), CD4 (clone GK1.5), CD8 (clone 53-6.7), Thy1.2 (clone 30-H12), CD45 (clone 30-F11), CCR9 (clone 9B1), CD11b (clone M1-70), Gr-1 (clone RB6-8C5), CD44 (clone IM7), CD25 (clone PC61).
Human T-ALL cell lines HBP-ALL and TALL1 were a kind gift from Dr. I. Aifantis (Dept. of Pathology, NYU, New York, NY). All cell lines were tested for absence of mycoplasma and authenticated by flow cytometry and Western blotting.
Transplantation experiments
For transplantation, single cell suspensions were generated from primary tumors and 1×10⁵ cells were injected into sublethally (450 rad) irradiated recipient female Rag1−/− (on a C57B6 background, cat#2216) or NCR nude mice (on an inbred albino background, cat#2019) via tail vein injection. All mice used as transplant recipients were purchased from Jackson Laboratory (Bar Harbor, Maine, USA). Mice were monitored by serial flow cytometric analysis of the peripheral blood. Once EGFP+ cells reached >5% of total leukocytes, cohorts of mice were started on doxycycline containing food as indicated.
Analysis of human T-ALL and PTCL patient samples
For the analysis of survival of PTEN normal vs. PTEN altered patients with T-ALL, published genomic and mRNA expression data on patients with T-ALL was used (accession no. GSE28703)15. PTEN altered (n=20) include patients with PTEN deletion, mutation, underexpression (<0.8 sigma after z scoring) and any combination of such alterations, PTEN normal (n=62) include all other patients with available data. For IHC analysis, samples from patients with T-cell acute lymphoblastic leukemia (T-ALL) were analyzed as individual bone marrow biopsies. For the T-cell lymphoma samples, tissue microarrays were constructed as previously published (Nature. 2012 Jul 12;487 (7406):244-8) using a fully automated Beecher Instrument, ATA-27. The study cohort comprised 84 patients with T-cell lymphomas and 31 patients with T-ALL, the T-cell lymphomas could be subdivided into enteropathy associated t cell lymphoma (4) and peripheral t cell lymphoma involving bowel or gastrointestinal tract (7), T/NK cell lymphoma (4), angioimmunoblastic t cell lymphoma (9), anaplastic large cell lymphoma (14), and peripheral t cell lymphoma with non bowel or gastrointestinal tract involvement (46). All samples were consecutively ascertained at the Memorial Sloan-Kettering Cancer Center (MSKCC) between 2001 and 2012. Use of tissue samples were approved with an Institutional Review Board Waiver and the Human Bio-specimen Utilization Committee. All biopsies were evaluated at MSKCC, and the histological diagnosis was based on hematoxylin and eosin (H&E) staining. The PTEN antibody, (Rabbit monoclonal antibody from Cell Signaling, 138G6, #9559, Danvers, MA) was used at a 1:30 dilution. IHC analysis was performed on the Ventana Discovery XT automated platform according to the manufacturer’s instructions (Tuscon, AZ). Results were scored as 0, 1, 2 for PTEN with 0 = No staining of tumor cells, with endothelial cells and macrophages positive; 1 = Weak staining of tumor cells, compared to endothelial cells and macrophages positive; 2 = Strong staining of tumor cells, compared to endothelial cells and macrophages positive. Representative images were taken using the Olympus BX41 model, DP20 camera, at 60× objective.
MRI
The mice were anesthetized with 2–3% isoflurane delivered in O2 and allowed to breathe spontaneously during the imaging study. The mice were positioned supine in a custom-made acrylic cradle fitted with a snout mask for continuous delivery of anesthesia. Non-invasive, MRI compatible monitors (pulse-oximetry, respiratory rate and rectal temperature probe, SA Instruments, Inc., Stony Brook, NY) were positioned for continuous monitoring of vital signs while the animal underwent MRI imaging. During imaging, body temperature was kept strictly within 36.5–37.5°C using a computer assisted air heating system (SA Instruments, Inc., Stony Brook, NY). All imaging was performed on a 9.4T/20 MRI instrument interfaced to a Bruker Advance console and controlled by Paravision 5.0 software (Bruker Biospin, Billerica, MA). A volume radio-frequency coil (diameter 11.2mm) used in transmit and receive mode were used for all imaging acquisitions. Following localizer anatomical scout scans, a 2D multi-slice T2-weighted RARE sequence along the coronal slice direction with fat suppression was obtained with the following parameters: TR=12500ms, TE=40ms, RARE factor=8, NA=8, FOV=6.0×6.0 cm2 (256×256) yielding an in plane resolution of 0.234 × 0.234 mm2, slice thickness=0.9mm total scanning time = 10min 40sec.
18F-FDG-PET analysis
For PET analysis, mice were fasted for 6h before i.v. injection of 0.5mCi 18F-FDG. Mice were kept for 1h under isoflurane anesthesia and subsequently imaged on a Focus 120 microPET (Siemens, NY, USA) or in some cases an Inveon MicroPET/CT (Siemens, NY, USA). Image normalization and analysis was performed using the ASI Pro MicroPET analysis software and the Inveon Workplace software package (Siemens Medical Solutions USA, PA, USA).
CGH
CGH experiments were performed using standard Agilent 244k mouse whole genome arrays, and hybridizations were carried out according to the manufacturer’s recommendations. Data processing, normalization and segmentation were carried out as described 37.
Multiplex-FISH (M-FISH)/Spectral karyotyping analysis
Cells were cultured in RPMI-1640 with L-glutamine (PAA, Austria) supplemented with 10% fetal bovine serum (FBS), 1% penicillin-streptomycin, 50μM mercaptoethanole, 50 U/ml human interleucin 2 and 5μg/ml concanavalin A for 48 to 72 h at 37°C and 5% CO2. To prepare metaphases, colcemid at a final concentration of 0.1μg/ml was added to the cells for 120 min. Spinning at 300g for 8 minutes was followed by hypotonic treatment in pre-warmed 0.075 M KCl for 20 min. at 37°C. Cells were fixed in cold ethanol / acetic acid (3:1) and air-dried slides were prepared.
The M-FISH hybridization was performed with a panel of mouse M-FISH probes (21XMouse mFISH probe kit, MetaSystems) according to the manufacturer’s instructions. In brief, the probes were denatured at 75°C for 5 min. and pre-annealed at 37°C for 30min. Slides were incubated in 0.1xSSC for 1 min, denatured in 0.07N NaOH at room temperature for 1 min., quenched in 0.1xSSC at 4°C and 2xSSC at 4°C for 1 min. each, dehydrated in an ethanol series and air dried. M-FISH probe was applied onto the slides and hybridization was performed for 48 h in a humidified chamber at 37°C. Following hybridization, the slides were washed in 0.4xSSC at 72°C for 2 min., followed by a wash in 2xSSC, 0.05% Tween20 at room temperature for 2 min. Counterstaining was performed using DAPI (4′,6-diamidino-2-phenylindole) and mounted with phenylene-diamine.
Slides were visualized using a Leica DMRXA-RF8 epifluorescence microscope equipped with special filter blocks (Chroma Technology, Brattleboro, VT). For image acquisition, a Sensys CCD camera (Photometrics) with a Kodak KAF 1400 chip was used. Both the camera and microscope were controlled with Leica Q-FISH software (Leica Microsystems Imaging Solutions, Cambridge, UK). Images were analyzed using the Leica MCK-Software package (Leica Microsystems Imaging Solutions, Cambridge, UK).
Western blotting, flow cytometry and antibodies
Western blotting was performed according to standard protocols. Briefly, tissues were either snap frozen in liquid nitrogen and homogenized, or dissociated into single cells using 100 μm nylon mesh (CellStrainer, BD Falcon, NJ, USA). Protein was extracted using standard protein lysis buffer (20 mM Tris (pH 7.5), 150 mM NaCl, 1 mM EDTA, 1 mM EGTA, 1% Triton, 2.5 mM sodium pyrophosphate, 1 mM beta-Glycerophosphate, 1 mM Na3VO4) supplemented with a protease inhibitor cocktail (Complete Roche Diagnostics, Penzberg, Germany) and quantified using a Bradford Protein Assay (Bio-Rad, CA, USA). Proteins were separated on a polyacrylamide gel (ProteanIII, Bio-Rad, CA, USA) and transferred to a PVDF membrane (Immobilon-F, Millipore, MA, USA). Protein bands were resolved using fluorochrome-conjugated secondary antibodies on an Odyssey scanner (Licor, NE, USA). All Western blot experiments were replicated at least twice.
For the analysis of pAkt and pS6 induction after CCL25 stimulation, shPten T-ALL cells derived from spleen tissues of tumor-bearing shPten mice and adapted to cell culture were either left untreated or treated with Dox for 4 days to reactivate Pten, starved over night at 0.5% FBS and then treated with Ccl25 for the indicated time points. For the Ccl25 stimulation assay of the human T-ALL cell lines HBP-ALL and TALL1, the cells were infected with a retroviral vector coexpressing a shPTEN.1522 or Renilla control shRNA and a puromycin-resistance cassette linked to GFP. After selection with puromycin for a 5 days, the cells were starved over night at 0.1% FBS and then treated with Ccl25 for 15 min before harvesting for immunoblot analysis.
For flow cytometric analysis (fluorescence activated cell sorting, FACS), single cell suspensions were brought to a concentration of 1×10⁶ cells/ml in FACS-buffer (phosphate-buffered saline, pH 7.4, 1%BSA) and stained with the indicated antibodies as per the manufacturer’s protocol. After washing, cells were measured on a Guava easyCyte (Millipore, MA, USA) or LSRII (BectonDickinson, NJ, USA) FACS machine. Cell sorting was performed on a BectonDickinson FACSAria II machine. For intracellular pS6 measurement, cells were fixed with 2% paraformaldehyde and permeabilized with methanol before staining for pS6 as previously described 38.
Ccl25 expression
For quantification of Ccl25 chemokine levels in the intestine of Rag1−/− and NCR nude mice, parts of the jejunum and ileum were dissected from euthanized animals, cleaned in phosphate-buffered saline (pH 7.4), and snap frozen in liquid nitrogen. Tissues were homogenized in T-PER Tissue Protein Extraction Buffer (Pierce Biotechnology, Inc, Rockford, IL) supplemented with a protease inhibitor cocktail (Complete Roche Diagnostics, Penzberg, Germany) to prevent degradation of proteins during and after homogenization. Protein extracts were centrifuged at 20,000 rcf, supernatants were collected, and total protein content was assayed using the Bradford Protein Assay (Bio-Rad, CA, USA). Tissue homogenates were analyzed for Ccl25 protein levels by a 3-step sandwich enzyme-linked immunosorbent assay as per the manufacturer’s instructions (R&D Systems, MN, USA).
Transwell migration assay
For transwell migration assays, 5×10⁵ cells with or without dox treatment were starved in RPMI containing 1% serum for 12h over night and the next day 3×10⁵ viable cells were plated in 200μl in the upper part of a 24-well Boyden chamber insert with a membrane pore size of 8μm (Greiner Bio-One, NC, USA). The lower part of the chamber was filled with 600μl medium containing 500ng/ml recombinant Ccl25 (R&D Systems, MN, USA). Following a 4 hour incubation at 37°C and 7.5% CO2, migrating cells in the lower chamber were counted using a Guava easyCyte cell counter (Millipore, MA, USA). Transwell migration experiments were run in triplicate for each condition on two independent tumor isolates.
Histology and IHC
Organ samples were fixed in fresh 4% paraformaldehyde at 4 °C overnight and further subjected to routine histological procedures for embedding in paraffin. 5-μm sections of the samples from at least three different animals per group were placed on microscopic slides next to one another to enable cross-comparison within a slide after H&E staining or IHC staining with the antibodies indicated. Antibodies used were GFP (D5.1) XP, PTEN (D4.3), phospho (p)-AKT (S473) (D9E), p-ribosomal protein S6 (S235/236) (D57.2.2E), Cleaved Caspase-3 (Asp175) (all: Cell Signaling Technologies, Danvers, MA), Ki67 (VP-K451, Vector Laboratories, Burlingame, CA), and CD3 (A0452) (DAKO, Glostrup, Denmark). Stained slides were scanned with a Pannoramic Scan 250 Flash or MIDI system and images acquired using Pannoramic Viewer 1.15.2 (both: 3DHistech, Budapest, Hungary). Additional images were taken on a Zeiss Axio Imager.Z2 system.
shCcr9 hairpin design and competition experiments
shRNAs targeting Ccr9 were generated as previously described33 and cloned into a retroviral vector coexpressing mCherry (LMN-C39). Knockdown of Ccr9 was quantified in a murine TALL cell line by flow cytometry using an Alexa647-conjugated antibody against murine CCR9 (clone 9B1, eBiosciences, San Diego, CA, USA). The two most efficient shRNAs shCcr9.904 (97-mer: 5′-TGCTGTTGACAGTGAGCGCAAGGATAAGAATGCCAAGCTATAGTGAAGC CACAGATGTATAGCTTGGCATTCTTATCCTTATGCCTACTGCCTCGGA-3′) and shCcr9.2357 (97-mer: 5′-TGCTGTTGACAGTGAGCGCCCCAACAGTTTACAACCTTTAT AGTGAAGCCACAGATGTATAAAGGTTGTAAACTGTTGGGATGCCTACTGCCTCGGA-3′) were used for subsequent assays. For the infection of tumor cells, EGFP+ shPten T-ALL cells were grown on OP9-DL1 feeders in the presence of 10ng/ml mIL7 in Optimem Glutamax medium (Gibco/Life Technologies, CA, USA) and infected with either shCcr9 or shRenilla control shRNAs. About 0.75 × 10⁶ infected shPten cells (20–30% mCherry+) were transplanted into recipient Rag1−/− mice irradiated with 450rad, and monitored for disease development. Diseased mice were euthanized, and spleen, BM, liver, lung, small intestine and kidney tissues were collected and minced to generate single cell suspensions for flow cytometric measurement of EGFP and mCherry positive cell fractions. Relative mCherry fractions from different organs were determined by normalizing to the spleen fraction as 100%.
CCR9 inhibitor treatment
The CCR9 inhibitor CCX8037 was kindly provided by Chemocentryx (CA, USA)25,40. For cell culture treatment, different concentrations of CCX8037 were used as indicated. For in vivo experiments, mice were treated with 30mg/kg inhibitor or vehicle (HPMC 1%) administered via subcutaneous injection every 12h (CCX8037).
Clonality analysis of murine shPten tumors
Clonality analysis by PCR amplification and sequencing of murine TCRβ sequences was performed as previously described41. Briefly, clonality was assayed at V-DJ and D-J rearrangements in a mixure of 20 family-specific upstream primers located within Vβ gene segments, consensus primers located 5′ of Dβ1 and Dβ2 gene segments and consensus downstream primers located 3′ of Jβ1 and Jβ2 gene segments. PCR products were analyzed by direct Sanger sequencing.
Profiling of Notch1 mutations by Sanger sequencing
Vav-tTA;shPten tumors were analyzed for Notch1 hotspot mutations located in Exon 26, 27 and 34 by Sanger sequencing as described previously (O’Neil et al., Activating Notch1 mutations in mouse models of T-ALL, Blood 2006 107:781–785), including one new oligonucleotide primer pair: Ex34B-f: 5′-GCCAGTACAACCCACTACGG-3′; Ex34B-r: 5′-CCTGAAGCACTGGAA-AGGAC-3′.
RNAseq data generation and Bioinformatic Analysis
Total RNA was extracted from shPten leukemic cells on/off Dox purified by sorting for CD4 expression with magnetic beads using Trizol (Invitrogen, NY). RNA quality and quantity were assessed using Agilent RNA 6000 Nano Chip (Agilent Technologies, Inc. Santa Clara, CA) and Qubit 2.0 fluorometer (Life Technologies, NY), respectively. RNAseq libraries were prepared from 1 μg of total RNA per sample using the TruSeq RNA Sample Preparation Kit v2 (Illumina, Inc. Santa Clara, CA) following the standard protocol with slight modification (10 PCR cycles). RNAseq library quality and quantity were assessed using the Agilent DNA 1000 Chip and Kappa Library qPCR kit (Kappa Biosystems, Inc, Woburn, MA). Libraries were clustered on an Illumina cBot and sequenced on the HiSeq2000 (2 × 100 bp reads) using Illumina chemistry (Illumina, Inc., San Diego, CA).
The RNA-Seq paired-end reads were mapped to the mouse mm9 genome and its corresponding transcript sequences using an in-house mapping and quality assessment pipeline15. Transcript expression levels were estimated as Fragments Per Kilobase of transcript per Million mapped reads (FPKM) and gene FPKMs were computed by summing the transcript FPKMs for each gene using the Cuffdiff2 program42. We called a gene “expressed” in a given sample if it had a FPKM value >= 0.5 based on the distribution of FPKM gene expression levels and excluded genes that were not expressed in any sample from the final gene expression data matrix for downstream analysis. Differentially expressed genes were identified using LIMMA43 and false discovery rate was estimated by Benjamini & Hochberg method44. Gene Set Enrichment Analysis (GSEA)45,46 and the Database for Annotation, Visualization and Integrated Discovery (DAVID v6.7)47 were used to assess pathway enrichment. All mouse RNAseq data sets are submitted to the European Nucleotide Archive (ENA) and can be accessed under the accession no. PRJEB5498 at http://www.ebi.ac.uk/ena/data/view/PRJEB5498.
Gene Signature Enrichment Analysis (GSEA)
To test for mouse shPten signature enrichment in PTEN-disrupted human T-ALL, we established a shPten-dependent signature using the 100 most upregulated genes in shPten T-ALL samples (untreated, n=3) against PTEN-restored samples (Dox-treated, n=4) samples. Publicly available human T-ALL gene expression profiles (GSE28703, n=47) were processed using RMA (quantile normalization) and supervised for PTEN status (PTEN disrupted including PTEN deletion, mutation or both, n=10; PTEN wild-type n=37) according to the published sample genetic features annotation15. Statistical significance of GSEA results was assessed using 1000 samples permutations. For enrichment of human PTEN T-ALL signature in mouse shPten T-ALL (Dox-off) profiles against PTEN-restored (Dox-on) profiles, a human PTEN-disrupted signature was generated by including the 100 most upregulated genes in PTEN-disrupted vs PTEN-wild type T-ALL samples. Mouse genes were ranked by supervising untreated to Dox-treated shPten TALL. Statistical significance of human PTEN-disrupted signature enrichment was assessed using 1000 gene set permutations.
Extended Data
Extended Data Figure 1. Pten shRNA-transgenic mice enable conditional expression of PTEN and develop tumors after prolonged PTEN knockdown.
a, Western blot (WB) analysis of PTEN protein knockdown in NIH 3T3 cells infected with different Pten shRNAs at low multiplicity of infection. (s.e.: short exposure, l.e.: long exposure). b, PTEN protein knockdown assessed by WB in ES cell clones targeted with two different Pten shRNAs, either treated with doxycycline (Dox) or left untreated. c, MEFs from Rosa26-rtTA;shPten.1522 transgenic mice, wild type control mice, or Pten+/− mice were treated with Dox for the indicated times and analyzed for PTEN, GFP, and ACTB expression by WB. d, Overall survival of mice receiving bone marrow cells from tTA-transgenic mice infected with an inducible TRE-GFP-miR30 (TGM) retroviral vector expressing shPten.1522, shPten.2049 or control after irradiation with 600 rad. e, Fluorescence image of a CAGGS-rtTA;shPten.1522 mouse on Dox for 5 days and a CAGGS-rtTA only control mouse. f, Flow cytometric analysis of the peripheral blood of a CAGGS-rtTA;shPten.1522 mouse on Dox and an off Dox control mouse for myeloid (CD11b) and GFP marker expression 10 days after initiating Dox food. g, Overall survival curve of CMV-rtTA;shPten.1522 double-transgenic and control mice (single transgenic shPten.1522 or CMV-rtTA). Dox treatment for shRNA induction was started after weaning (at ~4 weeks of age). h, Situs of a tumor-bearing CAGGS-rtTA;shPten.1522 double-transgenic mouse. A large thymic tumor (full arrow), as well as enlarged lymph nodes (dashed arrows) and spleen (arrowhead), are visible. i, Immunohistochemical staining of kidney sections from a CAGGS-rtTA;shPten.1522 mouse for the indicated antigens. Arrows highlight a tumor infiltrate around a kidney venule. Scale bars show 100 μm.
Extended Data Figure 2. Vav-tTA;shPten transgenic mice with targeted shPten expression in the hematopoietic lineage display thymic hyperplasia by 6 weeks, and a subset develops thymic tumors infiltrating multiple peripheral organs.
a, Brightfield (left) and fluorescence (right) images of spleen and thymus from Vav-tTA;shLuc (control) and Vav-tTA;shPten double-transgenic mice at 5 weeks. b, FACS analysis of spleen and thymus single cell suspensions from Vav-tTA;shLuc/shPten mice for CD4/CD8 expression. c, Immunohistochemical (IHC) analysis of thymic tissue from 6 week old Vav-tTA;shLuc and Vav-tTA;shPten mice. Sections were stained with haematoxylin/eosin (H/E), anti-GFP or anti-PTEN antibodies, showing heterogeneous GFP staining and correspondingly variable PTEN knockdown. Scale bars are 200 μm for H/E and GFP, and 100 μm for PTEN. The insets are 2× magnifications. d, Thymus weight of 6-week old Vav-tTA;shLuc and Vav-tTA;shPten mice (n=5 for both groups, P<0.006 by t-test). e, Brightfield and GFP-fluorescence images of a Vav-tTA;shPten mouse with tumors. f, IHC staining of spleen, liver, and kidney tissues from a Vav-tTA;shPten mouse with primary T-cell disease. Sections were stained for H/E, GFP, PTEN and phospho-AKT(S473) as indicated, showing heterogeneous staining due to variable tumor infiltration. Scale bars represent 100 μm (insets 25 μm).
Extended Data Figure 3. Immunophenotype, chromosomal aberrations and Notch1 mutations observed in murine shPten tumors.
a, Flow cytometric analysis of organ infiltration by primary tumors in Vav-tTA;shPten.1522 transgenic mice. Single cell suspensions of indicated tissues were analyzed for EGFP, Thy1.2, CD4 and CD8 expression. LN: lymph node, BM: bone marrow, PB: peripheral blood. b, Spectral karyotyping analysis of a T-cell tumor arising in Vav-tTA;shPten.1522 mice, showing a t(14;15) translocation. c, Comparative genomic hybridization (CGH) analysis of a Vav-tTA;shPten.1522 leukemia. Genomic tumor DNA was analyzed on Affymetrix CGH SNP arrays and compared to normal skin tissue. X-axis indicates genomic coordinate and y-axis represents log2(tumor/germline). d, Schematic of the murine NOTCH1 protein generated using protein paint (http://explore.pediatriccancergenomeproject.org/proteinPainter), highlighting the different NOTCH1 protein domains and the mutations detected in the murine shPten T-ALL tumors.
Extended Data Figure 4. Summary of karyotyping and Notch1 sequencing of shPten TALL tumors.
a, Results from a multiplex FISH analysis of three different primary shPten induced T-ALL tumors. At least 10 cells were analyzed for each sample, and chromosomal gains, deletions or translocations are highlighted. b, Summary of Notch1 mutations identified in shPten and Pten KO tumors. c, Sequence of all shRNAs targeting murine Pten that were tested in the study. Sense and guide strand are highlighted in red.
Extended Data Figure 5. Gene Set Enrichment Analysis shows similar gene expression patterns in human and mouse T-ALL lacking Pten.
a, Gene Set Enrichment analysis (GSEA) of a mouse shPten signature in PTEN-altered human T-ALL was tested after establishing the shPten-dependent signature using the 100 most upregulated genes in shPten T-ALL samples (untreated, n=3) against PTEN-restored samples (Dox-treated, n=4) as determined by RNA-seq analysis (data not shown). Publicly available human T-ALL gene expression profiles (GSE28703, n=47) were processed using RMA (quantile normalization) and supervised for PTEN status (PTEN altered including PTEN deletion, mutation or both, n=10; PTEN wild-type (WT), n=37) according to the published sample annotation18. Statistical significance of GSEA results was assessed using 1000 samples permutations. b, For enrichment of human PTEN TALL signature in mouse shPten knockdown (kd) T-ALL (Dox-off) profiles against Pten-restored (Dox-on) profiles, a human PTEN-disrupted signature was generated by including the 100 most upregulated genes in PTEN-disrupted vs PTEN-wild type T-ALL samples. Mouse genes were ranked by supervising untreated to Dox-treated shPten T-ALLs. Statistical significance of human PTEN-disrupted signature enrichment was assessed using 1000 gene set permutations.
Extended Data Figure 6. Secondary recipients of shPten T-ALL cells display extensive intestinal tumor infiltration similar to a subset of human patients characterized by peripheral T-cell lymphoma and low PTEN expression.
a, Overall survival of sublethally irradiated Rag1−/− mice transplanted with 1×10⁵ T-ALL cells from primary Vav-tTA;shPten.1522 mice compared to untransplanted mice (n=5 for both groups, P<0.003). b, IHC staining for EGFP expression in the indicated tissues from secondary T-ALL transplant recipients. Scale bars represent 400μm and 100 μm for insets. c, Overall survival of PTEN normal (WT) vs. PTEN altered patients with T-ALL analyzed from published data on patients with T-ALL15, P=0.02). PTEN altered (n=20) include patients with PTEN deletion, mutation, underexpression (<0.8 sigma after z scoring) and any combination of such alterations, PTEN normal (n=62) include all other patients with available data. d, PTEN IHC staining of tissue micro-arrays of tumor sections from MSKCC patients with peripheral T-cell lymphomas (PTCL). Examples of low (upper panel) and high (lower panel) PTEN expression samples are shown. e, Contingency table showing a significant association (p<0.003; Fisher Exact Test) between low expression of PTEN and intestinal infiltration in PTCL patients. f, Overall survival of Rag1−/− mice transplanted with T-ALL cells from Ptenfl/fl; Lck-Cre mice ±Dox (n=5 for each group). g, Weight of spleen (n=4) and lymph nodes (n=8) in Rag1−/− mice transplanted with Vav-tTA;shPten leukemic cells untreated or treated with Dox for 5 days. h, MRI of Rag1−/− mice transplanted with Vav-tTA;shPten leukemic cells untreated or treated with Dox for 5 days, 14 days after transplant. Arrows highlight lymph nodes (LN) and increased signals in the liver. Representative images for one out of 3 analyzed mice per condition are shown. i, MRI imaging of the intestine and liver of the same mice as in h are shown. Dashed arrows highlight the liver, full arrows the intestine.
Extended Data Figure 7. Pten reactivation affects multiple pathways and increases apoptosis in tumor cells infiltrating the intestine, but not in the spleen.
a, Heatmap of top 30 upregulated and b, downregulated genes after Pten reactivation as determined by RNAseq on CD4-sorted leukemic samples isolated from the spleen. Three mice with Pten knocked down and four mice with reactivated Pten were analyzed. Pten is one of the top 50 upregulated genes after reactivation, but not included on the list. c, Bubblegraph visualization of the most significantly affected pathways as determined by DAVID pathway analysis. Y-axis represents relative pathway enrichment in Pten reactivated vs. Pten knockdown leukemic cells, and size of the bubble graph is inversely proportional to p-value. d, IHC analysis for expression of GFP and PTEN in spleen, lymph node (LN) and liver from shPten-tumor transplanted mice ±Dox treatment (5 days after start of Dox treatment; n=3 per group). Representative sections are shown. Scale bars are 100 μm for full images and 20 μm for insets. e, In vivo BrdU uptake in leukemic cells isolated from the lymph nodes of mice transplanted with Vav-tTA;shPten primary T-ALL tumors ±Dox. n=3 for each group. f, TUNEL staining of spleen and intestinal sections of Rag1−/− mice serially transplanted with Vav-tTA;shPten leukemia cells and either left untreated or treated with Dox 24h before sectioning. Scale bars are 200μm (2.5×) and 50μm (10×). g, Quantification of TUNEL stained sections from the intestinal sections in f. TUNEL positive cells from three representative areas of 1 mm2 from two different intestine sections were counted for each condition (P<0.01).
Extended Data Figure 8. Akt and S6 protein phosphorylation is affected by PTEN reactivation in the intestine.
a, Immunohistochemical (IHC) staining for phospho-S6 (pS235/236-S6) and phospho-AKT (pS473AKT) of spleen sections from Rag1−/− mice transplanted with Vav-tTA;shPten tumor cells from primary mice and either treated with Dox or left untreated two days after treatment begin (n=3 per group). Scale bars are 100 μm, 20 μm for insets. Representative images are shown. b, IHC staining for pS473-AKT (bottom) in the intestine, showing very low pAKT signal in the intestinal epithelial cells independent of Dox treatment status (arrows; bottom left and right panels), conversely strong staining for pAKT was detected in some of the infiltrating tumor cells (arrow heads). The signal was reduced concomitantly with the overall reduction of the Pten-shRNA linked GFP signal (top) after 36 h of Dox treatment (+ Dox; right panels). c, Representative histogram of flow cytometric analysis for intracellular pS6 signal in CD4+ cells isolated from spleen and intestine of Rag1−/− mice transplanted with shPten tumor cells and either treated with Dox for 5 days or left untreated. d, Flow cytometric quantification of pS6 signal in CD4+ cells isolated from the intestine and e, spleens of Rag1−/− mice transplanted with primary shPten tumors and treated ±Dox for 5 days (n=4 for each condition, P<0.04 for the intestine and n.s. for the spleen by paired t-test). MFI: mean fluorescent intensity.
Extended Data Figure 9. NCR mice display a reduced intestinal tumor infiltration, which is not dependent on the absence of the thymus.
a, Brightfield pictures of the intestinal situs of Rag1−/− and NCR nude mice serially transplanted with shPten tumors (upper four panels) and fluorescence images (FI) of cells infiltrating the small intestine in these mice (lower four panels). Scale bars are 800 μm (upper FI panels) and 100 μm (lower FI panels). Pictures were taken on a Nikon SMZ 1000 stereomicroscope. b, Quantification of the intestinal infiltration in transplanted Rag1−/− or NCR mice by flow cytometry (P<0.03). c, Weight of lymph nodes (P<0.01) and d, spleens (P=n.s.) in transplanted Rag1−/− and NCR mice. e, CCL25 expression in the small intestine of Rag1−/− and NCR mice measured by ELISA. f, Western blot analysis of CCL25 expression in the small intestine of Rag1−/− and NCR mice. g, Overall survival of Rag1−/− and thymectomized Rag1−/− mice after transplant with shPten T-ALL cells (n=5 per group). h, H/E and immunohistochemical analysis of CD3 expression of spleen, liver and intestine from Rag1−/−and thymectomized Rag1−/− mice transplanted with shPten T-ALL cells. Scale bars represent 200 μm for spleen and liver and 100 μm for intestinal samples. i, Flow cytometric measurement of CCR9 expression on shPten leukemia cells either in the absence of Dox (Pten knocked down) or Dox treated (Pten reactivated). One representative analysis out of four analyzed on/off Dox pairs is shown. A CCR9 negative B-cell line was used as control. j, Immunoblot analysis of PTEN, phospho-AKT(S473) and ACTB expression in human HBP-ALL T-ALL cells infected with either a control shRNA (shRenilla) or a shRNA targeting PTEN, and either starved or stimulated for 15 min with 500 ng/ml CCL25. k, shPten tumor cell migration across a Boyden chamber in the presence or absence of 1 μg/ml Dox and 500 ng/ml CCL25. One representative experiment of two is shown, samples were run in triplicate; ** p<0.01, *** p<0.001 by t-test.
Extended Data Figure 10. CCR9 inactivation by shRNA knockdown or by pharmacologic inhibition attenuates intestinal tumor infiltration.
a, CCR9 expression on the surface of shPten tumor cells either infected with a control shRNA against Renilla luciferase (left) or with a shRNA targeting Ccr9 (right) as measured by flow cytometry, compared to uninfected cells respectively. b, Flow cytometry-based quantification of CCR9 suppression in shCcr9 infected shPten T-ALL cells compared to shRenilla-infected cells, n=5 for each cohort. c, Raw percentage of shRenilla/shCcr9 expressing shPten T-ALL cells in different tissue compartments of mice 12 days after transplantation, determined by flow cytometry, n=5 for each cohort. p<0.0005 (intestine). d, Immunohistochemical (IHC) analysis for mCherry (left: shRenilla-mCherry; right:shCcr9-mCherry) expressing cells in tissue sections of mice from c. Spleen, liver and intestinal sections of mice transplanted with shRenilla- or shCcr9-infected T-ALL cells were analyzed for mCherry expression. Representative stains from one mouse out of three analyzed mice are shown. Scale bars represent 100 μm (insets 20 μm). e, IHC staining for EGFP expression in representative sections of small intestine, liver and spleen of Vav-tTA;shPten tumor bearing mice treated with vehicle or the CCR9 inhibitor CCX8037 (n=3). Scale bars are 400 μm for the 2.5× and 100 μm for the 10× images. f, Flow cytometric quantification of intestinal tumor infiltration in Rag1−/− mice transplanted with Vav-tTA;shPten leukemia cells and treated with vehicle (n=4) or a small molecule inhibitor of CCR9 (n=5). *P<0.05 by t-test. g, Immunoblot analysis of phospho-AKT expression 15 min after stimulation of shPten leukemia cells with CCL25 in the absence or presence of indicated concentrations of CCX8037. h, IHC analysis of EGFP and phospho-AKT signal in representative sections of small intestine from Vav-tTA;shPten tumor bearing mice treated with vehicle or the CCR9 inhibitor CCX8037. Scale bars are 100 μm (25 μm for insets).
Supplementary Material
Acknowledgments
We are grateful to Jacqueline Cappellani, Danielle Grace, Janelle Simon and Meredith Taylor for technical assistance, Sang-Yong Kim for performing tetraploid embryo complementation, Jinjun Cheng for RNAseq analysis, Michael Riggs for CGH array analysis, Mihaela Lupu and Carl Le for MRI imaging, Valerie Longo and Pat Zanzonico for PET analysis, Janine Pichardo for data management, Louis Lopez and Avani Giri for tissue microarray construction, Michael Saborowski for help with IHC staining, Alberto Roselló-Díez and Marina Asher for expertise in antibody staining characterization and Charles Sherr for constructive comments and editorial advice. We thank Juan Jaen, Mark Penfold and Matthew Walters from Chemocentryx (Mountain View, CA) for providing the CCR9 small molecule inhibitor. C.M was supported by a fellowship from the DFG (Mi1210/1-1). I.A. (DKH# 109902) received support by a fellowship from the Deutsche Krebshilfe. C.S. was supported by the Angel Foundation with a Curt Engelhorn fellowship. This work was also supported by a program project grant from the National Cancer Institute, a Leukemia and Lymphoma Society Specialized Center of Research, and philanthropic funds from the Don Monti Foundation. S.W.L. is supported by the Geoffrey Beene Foundation and is an investigator in the Howard Hughes Medical Institute.
Footnotes
Author Contributions
C.M. and S.W.L. designed the study. C.M., C.S. P.K.P. and L.L. performed shRNA design and testing, targeting vector construction and E.S. cell targeting. C.M., B.B., I.A., C.S. and L.L. performed mouse breeding, transplantation experiments and analysed data. C.M. and I.A. performed in-vitro migration assays and analysed data. C.M. and H.B. ran the mouse MRI experiments and analysed data. C.M. and B.B. performed the 18F-FDG-PET experiments and analysed data. J.H. performed CGH analysis, and J.H. and C.M. analysed data. J.T-F. performed the histopathologic analysis of mouse and human tumors, and J.T-F. and C.M. analysed data. B.B. and C.M. performed paraffin embedding, sectioning and IHC staining of mouse tissues and analysed data. C.M. performed flow cytometry, immunoblotting and analysed data. J.N. and J.C. performed the RNAseq sample processing and J.N., J.M., J.R.D., C.S. and C.M. analysed data. C.S. ran the GSEA analysis and comparison with human expression data. M.A. and M.R.S. performed the SKY analysis of mouse tumors, and M.A., M.R.S. and C.M. analysed data. S.W.L. supervised the project. C.M., C.S., B.B. and S.W.L. wrote the paper. All authors reviewed the manuscript.
Reprints and permission information is available at www.nature.com/reprints/.
Datasets from RNAseq analysis were deposited at the Sequence Read Archive (SRA) at the European Nucleotide Archive (ENA) with the accession no. PRJEB5498.
The authors declare no competing financial interest.
References
- 1.Li J, et al. PTEN, a putative protein tyrosine phosphatase gene mutated in human brain, breast, and prostate cancer. Science. 1997;275:1943–1947. doi: 10.1126/science.275.5308.1943. [DOI] [PubMed] [Google Scholar]
- 2.Engelman JA, Luo J, Cantley LC. The evolution of phosphatidylinositol 3-kinases as regulators of growth and metabolism. Nat Rev Genet. 2006;7:606–619. doi: 10.1038/nrg1879. [DOI] [PubMed] [Google Scholar]
- 3.Salmena L, Carracedo A, Pandolfi PP. Tenets of PTEN tumor suppression. Cell. 2008;133:403–414. doi: 10.1016/j.cell.2008.04.013. [DOI] [PubMed] [Google Scholar]
- 4.Dickins RA, et al. Probing tumor phenotypes using stable and regulated synthetic microRNA precursors. Nature genetics. 2005;37:1289–1295. doi: 10.1038/ng1651. [DOI] [PubMed] [Google Scholar]
- 5.Dickins RA, et al. Tissue-specific and reversible RNA interference in transgenic mice. Nat Genet. 2007;39:914–921. doi: 10.1038/ng2045. [DOI] [PMC free article] [PubMed] [Google Scholar]
- 6.Premsrirut PK, et al. A rapid and scalable system for studying gene function in mice using conditional RNA interference. Cell. 2011;145:145–158. doi: 10.1016/j.cell.2011.03.012. [DOI] [PMC free article] [PubMed] [Google Scholar]
- 7.Di Cristofano A, Pesce B, Cordon-Cardo C, Pandolfi PP. Pten is essential for embryonic development and tumour suppression. Nat Genet. 1998;19:348–355. doi: 10.1038/1235. [DOI] [PubMed] [Google Scholar]
- 8.Stambolic V, et al. High incidence of breast and endometrial neoplasia resembling human Cowden syndrome in pten+/− mice. Cancer Res. 2000;60:3605–3611. [PubMed] [Google Scholar]
- 9.Gutierrez A, et al. High frequency of PTEN, PI3K, and AKT abnormalities in T-cell acute lymphoblastic leukemia. Blood. 2009;114:647–650. doi: 10.1182/blood-2009-02-206722. [DOI] [PMC free article] [PubMed] [Google Scholar]
- 10.Kim WI, Wiesner SM, Largaespada DA. Vav promoter-tTA conditional transgene expression system for hematopoietic cells drives high level expression in developing B and T cells. Exp Hematol. 2007;35:1231–1239. doi: 10.1016/j.exphem.2007.04.012. [DOI] [PubMed] [Google Scholar]
- 11.Suzuki A, et al. T cell-specific loss of Pten leads to defects in central and peripheral tolerance. Immunity. 2001;14:523–534. doi: 10.1016/s1074-7613(01)00134-0. [DOI] [PubMed] [Google Scholar]
- 12.Aifantis I, Raetz E, Buonamici S. Molecular pathogenesis of T-cell leukaemia and lymphoma. Nat Rev Immunol. 2008;8:380–390. doi: 10.1038/nri2304. [DOI] [PubMed] [Google Scholar]
- 13.Guo W, et al. Multi-genetic events collaboratively contribute to Pten-null leukaemia stem-cell formation. Nature. 2008;453:529–533. doi: 10.1038/nature06933. [DOI] [PMC free article] [PubMed] [Google Scholar]
- 14.Erikson J, et al. Deregulation of c-myc by translocation of the alpha-locus of the T-cell receptor in T-cell leukemias. Science. 1986;232:884–886. doi: 10.1126/science.3486470. [DOI] [PubMed] [Google Scholar]
- 15.Zhang J, et al. The genetic basis of early T-cell precursor acute lymphoblastic leukaemia. Nature. 2012;481:157–163. doi: 10.1038/nature10725. [DOI] [PMC free article] [PubMed] [Google Scholar]
- 16.Engelman JA, et al. Effective use of PI3K and MEK inhibitors to treat mutant Kras G12D and PIK3CA H1047R murine lung cancers. Nat Med. 2008;14:1351–1356. doi: 10.1038/nm.1890. [DOI] [PMC free article] [PubMed] [Google Scholar]
- 17.Nehls M, et al. Two genetically separable steps in the differentiation of thymic epithelium. Science. 1996;272:886–889. doi: 10.1126/science.272.5263.886. [DOI] [PubMed] [Google Scholar]
- 18.Bleul CC, Boehm T. Chemokines define distinct microenvironments in the developing thymus. Eur J Immunol. 2000;30:3371–3379. doi: 10.1002/1521-4141(2000012)30:12<3371::AID-IMMU3371>3.0.CO;2-L. [DOI] [PubMed] [Google Scholar]
- 19.Nowell CS, et al. Foxn1 regulates lineage progression in cortical and medullary thymic epithelial cells but is dispensable for medullary sublineage divergence. PLoS Genet. 2011;7:e1002348. doi: 10.1371/journal.pgen.1002348. [DOI] [PMC free article] [PubMed] [Google Scholar]
- 20.Wurbel MA, et al. The chemokine TECK is expressed by thymic and intestinal epithelial cells and attracts double- and single-positive thymocytes expressing the TECK receptor CCR9. Eur J Immunol. 2000;30:262–271. doi: 10.1002/1521-4141(200001)30:1<262::AID-IMMU262>3.0.CO;2-0. [DOI] [PubMed] [Google Scholar]
- 21.Campbell DJ, Butcher EC. Intestinal attraction: CCL25 functions in effector lymphocyte recruitment to the small intestine. J Clin Invest. 2002;110:1079–1081. doi: 10.1172/JCI16946. [DOI] [PMC free article] [PubMed] [Google Scholar]
- 22.Youn BS, Kim CH, Smith FO, Broxmeyer HE. TECK, an efficacious chemoattractant for human thymocytes, uses GPR-9-6/CCR9 as a specific receptor. Blood. 1999;94:2533–2536. [PubMed] [Google Scholar]
- 23.Uehara S, Grinberg A, Farber JM, Love PE. A role for CCR9 in T lymphocyte development and migration. J Immunol. 2002;168:2811–2819. doi: 10.4049/jimmunol.168.6.2811. [DOI] [PubMed] [Google Scholar]
- 24.Buonamici S, et al. CCR7 signalling as an essential regulator of CNS infiltration in T-cell leukaemia. Nature. 2009;459:1000–1004. doi: 10.1038/nature08020. [DOI] [PMC free article] [PubMed] [Google Scholar]
- 25.Walters MJ, et al. Characterization of CCX282-B, an orally bioavailable antagonist of the CCR9 chemokine receptor, for treatment of inflammatory bowel disease. J Pharmacol Exp Ther. 2010;335:61–69. doi: 10.1124/jpet.110.169714. [DOI] [PubMed] [Google Scholar]
- 26.Eksteen B, Adams DH. GSK-1605786, a selective small-molecule antagonist of the CCR9 chemokine receptor for the treatment of Crohn’s disease. IDrugs. 2010;13:472–781. [PubMed] [Google Scholar]
- 27.Hollander MC, Blumenthal GM, Dennis PA. PTEN loss in the continuum of common cancers, rare syndromes and mouse models. Nat Rev Cancer. 2011;11:289–301. doi: 10.1038/nrc3037. [DOI] [PMC free article] [PubMed] [Google Scholar]
- 28.Jotta PY, et al. Negative prognostic impact of PTEN mutation in pediatric T-cell acute lymphoblastic leukemia. Leukemia. 2010;24:239–242. doi: 10.1038/leu.2009.209. [DOI] [PubMed] [Google Scholar]
- 29.Muellner MK, et al. A chemical-genetic screen reveals a mechanism of resistance to PI3K inhibitors in cancer. Nat Chem Biol. 2011;7:787–793. doi: 10.1038/nchembio.695. [DOI] [PMC free article] [PubMed] [Google Scholar]
- 30.Ilic N, Utermark T, Widlund HR, Roberts TM. PI3K-targeted therapy can be evaded by gene amplification along the MYC-eukaryotic translation initiation factor 4E (eIF4E) axis. Proc Natl Acad Sci U S A. 2011;108:E699–708. doi: 10.1073/pnas.1108237108. [DOI] [PMC free article] [PubMed] [Google Scholar]
- 31.Huesken D, et al. Design of a genome-wide siRNA library using an artificial neural network. Nat Biotechnol. 2005;23:995–1001. doi: 10.1038/nbt1118. [DOI] [PubMed] [Google Scholar]
- 32.Fellmann C, et al. Functional identification of optimized RNAi triggers using a massively parallel sensor assay. Mol Cell. 2011;41:733–746. doi: 10.1016/j.molcel.2011.02.008. [DOI] [PMC free article] [PubMed] [Google Scholar]
- 33.Dow LE, et al. A pipeline for the generation of shRNA transgenic mice. Nat Protoc. 2012;7:374–393. doi: 10.1038/nprot.2011.446. [DOI] [PMC free article] [PubMed] [Google Scholar]
- 34.Beard C, Hochedlinger K, Plath K, Wutz A, Jaenisch R. Efficient method to generate single-copy transgenic mice by site-specific integration in embryonic stem cells. Genesis. 2006;44:23–28. doi: 10.1002/gene.20180. [DOI] [PubMed] [Google Scholar]
- 35.Kistner A, et al. Doxycycline-mediated quantitative and tissue-specific control of gene expression in transgenic mice. Proc Natl Acad Sci U S A. 1996;93:10933–10938. doi: 10.1073/pnas.93.20.10933. [DOI] [PMC free article] [PubMed] [Google Scholar]
- 36.Suzuki A, et al. High cancer susceptibility and embryonic lethality associated with mutation of the PTEN tumor suppressor gene in mice. Curr Biol. 1998;8:1169–1178. doi: 10.1016/s0960-9822(07)00488-5. [DOI] [PubMed] [Google Scholar]
- 37.Lakshmi B, et al. Mouse genomic representational oligonucleotide microarray analysis: detection of copy number variations in normal and tumor specimens. Proc Natl Acad Sci U S A. 2006;103:11234–11239. doi: 10.1073/pnas.0602984103. [DOI] [PMC free article] [PubMed] [Google Scholar]
- 38.Zhao Z, et al. p53 loss promotes acute myeloid leukemia by enabling aberrant self-renewal. Genes Dev. 2010;24:1389–1402. doi: 10.1101/gad.1940710. [DOI] [PMC free article] [PubMed] [Google Scholar]
- 39.Scuoppo C, et al. A tumour suppressor network relying on the polyamine-hypusine axis. Nature. 2012;487:244–248. doi: 10.1038/nature11126. [DOI] [PMC free article] [PubMed] [Google Scholar]
- 40.Tubo NJ, et al. A Systemically-Administered Small Molecule Antagonist of CCR9 Acts as a Tissue-Selective Inhibitor of Lymphocyte Trafficking. PLoS One. 2012;7:e50498. doi: 10.1371/journal.pone.0050498. [DOI] [PMC free article] [PubMed] [Google Scholar]
- 41.Gartner F, et al. Immature thymocytes employ distinct signaling pathways for allelic exclusion versus differentiation and expansion. Immunity. 1999;10:537–546. doi: 10.1016/s1074-7613(00)80053-9. [DOI] [PubMed] [Google Scholar]
- 42.Trapnell C, et al. Differential analysis of gene regulation at transcript resolution with RNA-seq. Nat Biotechnol. 2013;31:46–53. doi: 10.1038/nbt.2450. [DOI] [PMC free article] [PubMed] [Google Scholar]
- 43.Smyth GK. Linear models and empirical bayes methods for assessing differential expression in microarray experiments. Stat Appl Genet Mol Biol. 2004;3:Article3. doi: 10.2202/1544-6115.1027. [DOI] [PubMed] [Google Scholar]
- 44.Hochberg Y, Benjamini Y. More powerful procedures for multiple significance testing. Stat Med. 1990;9:811–818. doi: 10.1002/sim.4780090710. [DOI] [PubMed] [Google Scholar]
- 45.Subramanian A, et al. Gene set enrichment analysis: a knowledge-based approach for interpreting genome-wide expression profiles. Proc Natl Acad Sci U S A. 2005;102:15545–15550. doi: 10.1073/pnas.0506580102. [DOI] [PMC free article] [PubMed] [Google Scholar]
- 46.Subramanian A, Kuehn H, Gould J, Tamayo P, Mesirov JP. GSEA-P: a desktop application for Gene Set Enrichment Analysis. Bioinformatics. 2007;23:3251–3253. doi: 10.1093/bioinformatics/btm369. [DOI] [PubMed] [Google Scholar]
- 47.Huang da W, Sherman BT, Lempicki RA. Systematic and integrative analysis of large gene lists using DAVID bioinformatics resources. Nat Protoc. 2009;4:44–57. doi: 10.1038/nprot.2008.211. [DOI] [PubMed] [Google Scholar]
Associated Data
This section collects any data citations, data availability statements, or supplementary materials included in this article.


