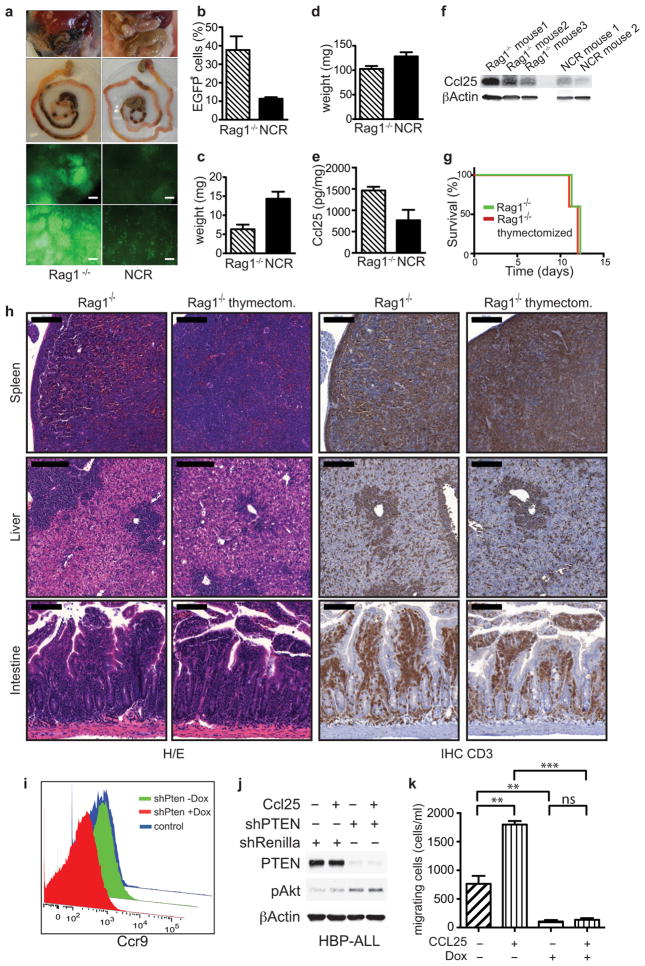
Extended Data Figure 9. NCR mice display a reduced intestinal tumor infiltration, which is not dependent on the absence of the thymus.
a, Brightfield pictures of the intestinal situs of Rag1−/− and NCR nude mice serially transplanted with shPten tumors (upper four panels) and fluorescence images (FI) of cells infiltrating the small intestine in these mice (lower four panels). Scale bars are 800 μm (upper FI panels) and 100 μm (lower FI panels). Pictures were taken on a Nikon SMZ 1000 stereomicroscope. b, Quantification of the intestinal infiltration in transplanted Rag1−/− or NCR mice by flow cytometry (P<0.03). c, Weight of lymph nodes (P<0.01) and d, spleens (P=n.s.) in transplanted Rag1−/− and NCR mice. e, CCL25 expression in the small intestine of Rag1−/− and NCR mice measured by ELISA. f, Western blot analysis of CCL25 expression in the small intestine of Rag1−/− and NCR mice. g, Overall survival of Rag1−/− and thymectomized Rag1−/− mice after transplant with shPten T-ALL cells (n=5 per group). h, H/E and immunohistochemical analysis of CD3 expression of spleen, liver and intestine from Rag1−/−and thymectomized Rag1−/− mice transplanted with shPten T-ALL cells. Scale bars represent 200 μm for spleen and liver and 100 μm for intestinal samples. i, Flow cytometric measurement of CCR9 expression on shPten leukemia cells either in the absence of Dox (Pten knocked down) or Dox treated (Pten reactivated). One representative analysis out of four analyzed on/off Dox pairs is shown. A CCR9 negative B-cell line was used as control. j, Immunoblot analysis of PTEN, phospho-AKT(S473) and ACTB expression in human HBP-ALL T-ALL cells infected with either a control shRNA (shRenilla) or a shRNA targeting PTEN, and either starved or stimulated for 15 min with 500 ng/ml CCL25. k, shPten tumor cell migration across a Boyden chamber in the presence or absence of 1 μg/ml Dox and 500 ng/ml CCL25. One representative experiment of two is shown, samples were run in triplicate; ** p<0.01, *** p<0.001 by t-test.

