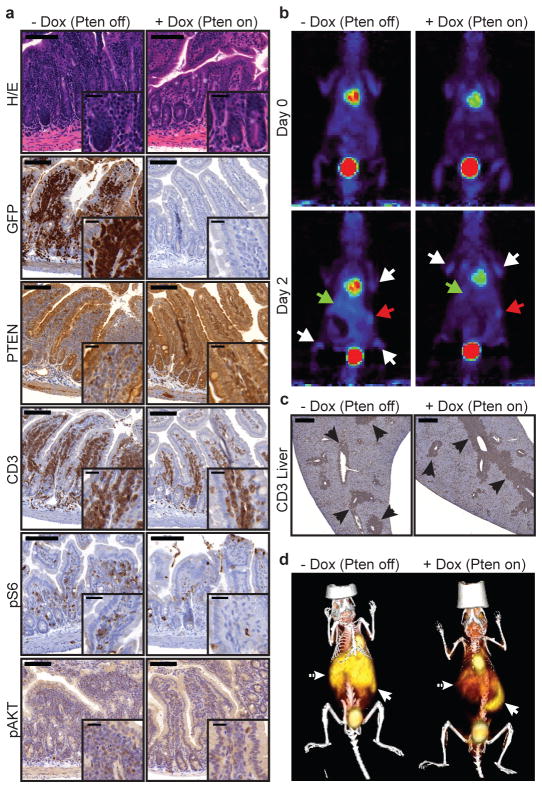
Figure 3.
Tissue-dependent effects of PTEN reactivation on PI3K signaling. (A) Small intestinal sections from shPten T-ALL transplanted mice ±Dox were stained with hematoxylin/eosin (HE) or by IHC for the indicated molecules. Representative sections from one of three mice per cohort are shown. Scale bars represent 100 μm (20 μm in insets). (B) Serial 18F-FDG PET analysis of shPten T-ALL transplanted mice before and 2d after beginning of Dox treatment. White arrows: BM, red arrow: spleen, green arrow: liver/intestine. Representative images from two out of 12 analyzed mice are shown. (C) CD3 IHC staining of shPten tumor infiltrations in the liver of mice ±Dox 4d after treatment initiation (n=3 per group). Arrows highlight CD3+ tumor infiltrates. Scale bars represent 500 μm. (D) 18F-FDG PET/CT analysis of shPten T-ALL transplanted mice ±Dox 4d after beginning of Dox treatment. Full arrow: spleen, dashed arrow: liver/intestine. Representative images from two out of six analyzed mice are shown.

