

Abstract
The objective of this study was to test a new version of the Magnetic Resonance Disease Severity Scale (MRDSS2), incorporating cerebral gray matter (GM) and spinal cord involvement from 3 T MRI, in modeling the relationship between MRI and physical disability or cognitive status in multiple sclerosis (MS). Fifty-five MS patients and 30 normal controls underwent high-resolution 3 T MRI. The patients had an Expanded Disability Status Scale score of 1.6±1.7 (mean±SD). The cerebral normalized GM fraction (GMF), the T2 lesion volume (T2LV), and the ratio of T1 hypointense LV to T2LV (T1/T2) were derived from brain images. Upper cervical spinal cord area (UCCA) was obtained from spinal cord images. A within-subject d-score (difference of MS from normal control) for each MRI component was calculated, equally weighted, and summed to form MRDSS2. With regard to the relationship between physical disability and MRDSS2 or its individual components, MRI–Expanded Disability Status Scale correlations were significant for MRDSS2 (r=0.33, P=0.013) and UCCA (r=−0.33, P=0.015), but not for GMF (P=0.198), T2LV (P=0.707), and T1/T2 (P=0.240). The inclusion of UCCA appeared to drive this MRI–disability relationship in MRDSS2. With regard to cognition, MRDSS2 showed a larger effect size (P=0.035) than its individual components [GMF (P=0.081), T2LV (P=0. 179), T1/T2 (P=0.043), and UCCA (P=0.818)] in comparing cognitively impaired with cognitively preserved patients (defined by the Minimal Assessment of Cognitive Function in MS). Both cerebral lesions (T1/T2) and atrophy (GMF) appeared to drive this relationship. We describe a new version of the MRDSS, which has been expanded to include cerebral GM and spinal cord involvement. MRDSS2 has concurrent validity with clinical status.
Keywords: brain, cognition, MRI, multiple sclerosis, physical disability, spinal cord
Introduction
Conventional MRI-based brain lesion and atrophy measures have contributed to the understanding of multiple sclerosis (MS) pathophysiology. However, these measures show weak correlations with clinical status, as measured by the Expanded Disability Status Scale (EDSS), and have an unreliable strength for predicting clinical change. Composite MRI measurements offer an emerging approach to assess the full range of MS-related structural changes 1–4.
We previously described a composite scale to define the severity of damage in MS, known as the Magnetic Resonance Disease Severity Scale (MRDSS); this original version (MRDSS1) combined three cerebral measures: (i) T2 hyperintense lesion volume (LV), (ii) the ratio of T1 (hypointense) to T2 LVs (T1/T2), and (iii) normalized whole brain volume (a surrogate of whole brain atrophy). This initial version of the MRDSS showed high effect sizes in comparing MS clinical phenotype groups, was associated with clinical severity measures, and was highly sensitive to longitudinal change when monitoring patients for 3 years 3,4.
Notable limitations are that our previous studies evaluating MRDSS used low-resolution 1.5 T MRI scanning platforms and did not consider cerebral gray matter (GM) or spinal cord damage, both of which are now recognized in numerous studies as key contributors to impairment in patients with MS 5–13. The goals of this study were (i) to further develop and refine the MRDSS using (a) a 3 T MRI platform with a high-resolution scan protocol and (b) advanced MRI measures – cerebral GM atrophy and spinal cord atrophy [new MRDSS version 2 (MRDSS2)=GM volume (GMV)+T2LV+T1/T2+upper cervical spinal cord area (UCCA)] and (ii) to compare the association of MRDSS1, MRDSS2, and individual MRI measures with neurologic and cognitive functions. This is the first study to consider GM and spinal cord damage in an MS composite scale. We have presented these data in the preliminary form at the 2014 meeting of the American Academy of Neurology, Philadelphia.
Methods
Participants
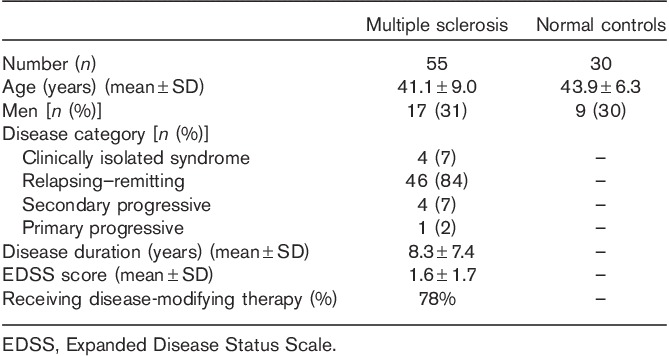
Table 1 summarizes the demographic and clinical characteristics of the participants. The sample included 55 consecutive patients with MS who met the following criteria: (i) age between 18 and 55 years; (ii) MS diagnosis of either relapsing–remitting, secondary progressive, primary progressive, or clinically isolated demyelinating syndrome 14; (iii) absence of other major medical, neurologic, or neuropsychiatric disorders; (iv) lack of any relapse or corticosteroid use in the 4 weeks before MRI or start of disease-modifying therapy 6 months before MRI (to reduce confounding effects on MRI); and (v) no history of smoking or substance abuse. Forty-three patients (78%) were receiving disease-modifying treatment at the time of MRI. Within 3 months of MRI, each patient underwent examination by an MS specialist neurologist, including EDSS scoring. All patients also underwent a formal neuropsychological evaluation by a PhD in clinical psychology (B.I.G.) and a research fellow under her supervision (A.A.). We also included normal controls (NC; n=30), recruited as previously detailed 15, with an age and sex distribution comparable to that in the MS group (Table 1). All participants gave their informed consent for this Institutional Review Board-approved study.
Table 1.
Demographic and clinical data
Cognitive evaluation
Neuropsychological performance was assessed by the Minimal Assessment of Cognitive Function in MS (MACFIMS) battery 16. The study participants had not been previously exposed to any components of this test battery. Patients also completed the Center for Epidemiologic Studies Depression scale to control for depressive symptoms in the analysis of MRI–cognition relationships. Given the small number of participants in the NC group, demographically adjusted T-scores were calculated for the patients with MS using regression-based norms, with impairment on a MACFIMS component defined as a T-score of 35 or less 17. Cognitive impairment was defined as impairment on two or more MACFIMS components 16, allowing subcategorization of the MS group as either cognitively impaired (n=20) or cognitively preserved (n=35).
MRI acquisition
Participants underwent a consistent scan acquisition protocol on the same MRI platform (3 T Signa; General Electric, Milwaukee, Wisconsin, USA), using the same head or spinal coil. The head was imaged in all participants, and the cervical spinal cord was imaged in all except seven NCs, with the following pulse sequences 18–20:
Brain: coronal three-dimensional modified driven-equilibrium Fourier transform (MDEFT): TR=7.9 ms, TE=3.14 ms, flip angle=15°, slice thickness=1.6 mm, pixel size=0.938×0.938 mm.
Brain: axial T2-weighted fast fluid-attenuated inversion-recovery (FLAIR): TR=9000 ms, TE=151 ms, TI=2250 ms, slice thickness=2 mm (no gap), pixel size=0.976×0.976 mm.
Spine: axial fast spin-echo T2-weighted images: TR=6117 ms, TE=110 ms, slice thickness=3 mm (no gap), pixel size=0.937×0.937 mm.
Image analysis
Brain and spinal cord MRI analysis was carried out in the Laboratory for Neuroimaging Research using Jim (v. 5; Xinapse Systems, Northants, UK, http://www.xinapse.com) and statistical parametric mapping (SPM8; Wellcome Department of Cognitive Neurology, London, UK, http://www.fil.ion.ucl.ac.uk/spm) operating in Matlab (version 2009a; The MathWorks Inc., Natick, Massachusetts, USA). MRI analysts were unaware of clinical information. Our techniques are semi-automated, and we have established their operational procedures and high reliability 12,18,20–23.
Compartment-specific brain volume segmentation
Our pipeline, on the basis of our earlier work 21–23, has been detailed recently 12. Briefly, an expert first performed manual removal of the skull, paranasal sinuses, and soft tissue overlying the brain to isolate the intracranial volume (ICV=brain parenchymal tissue+subarachnoid space). Images were then aligned with a common template, bias-field corrected, normalized, and segmented into GM, white matter (WM), and cerebrospinal fluid maps in SPM8. Mutually exclusive masks for each tissue were derived from probability maps. WM volume (WMV), GMV, and brain parenchymal volume (BPV=WMV+GMV) were derived after manual correction of misclassification of MS lesions and underestimation of the deep GM contour. Normalized compartment-specific global volumes were then obtained as follows: WM fraction (WMF=WMV/ICV), GM fraction (GMF=GMV/ICV), and total brain parenchymal fraction [BPF=(WMV+GMV)/ICV].
Lesion segmentation
Brain FLAIR hyperintense and MDEFT hypointense lesions were expert-segmented using a semi-automated edge-finding tool based on local thresholding in Jim5 to obtain whole brain T2 (FLAIR) hyperintense and T1 (MDEFT) hypointense LVs (T2LV, T1LV), as described previously 18,20. To assess the destructive potential of lesions, the ratio of T1LV to T2LV (T1/T2) was calculated for each participant.
Spinal cord segmentation
A rapid semi-automatic segmentation tool in Jim5 was implemented using the highly reliable and validated active surface method 10 to segment the contour of the spinal cord from the T2-images. The total UCCA, from the top of C2 to the base of C5, was derived for each participant, using consistent landmarks 10.
Creation of MRDSS2
To derive MRDSS2, a d-score (difference from NCs) for each MRI component was calculated for all MS patients, as follows:
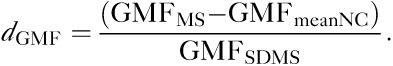 |
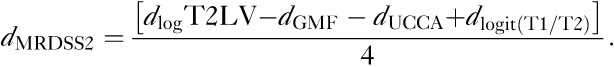
The d-scores were equally weighted and summed for each patient to form a composite of the four variables as follows:
 |
A composite score using the three original components (used in the previous original version) of MRDSS1 was also calculated for comparison with MRDSS2, as follows:
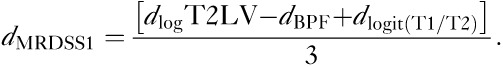 |
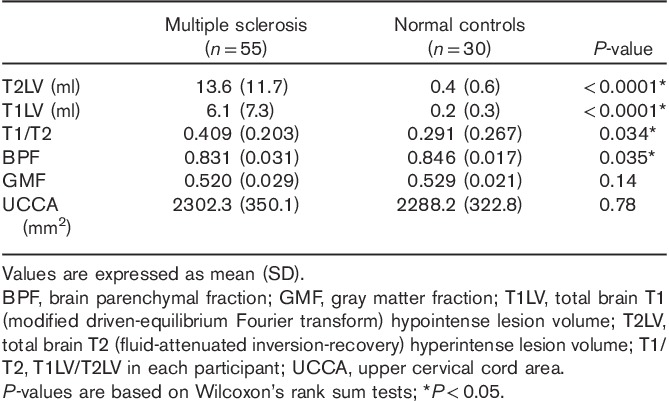
Thus, two versions of the MRDSS were tested. The second version differed from the first version in two ways: (i) substitution of GMF for BPF; (ii) the addition of spinal cord data. Further, because of the restricted range of the current MS sample, we relied on d-scores (rather than z-scores, which were used in the original version). Table 2 shows the results of all d-scores and MRDSS calculations; Table 3 shows the raw MRI data in the MS and NC groups.
Table 2.
d-Scores for MRI components in the multiple sclerosis group (n=55)
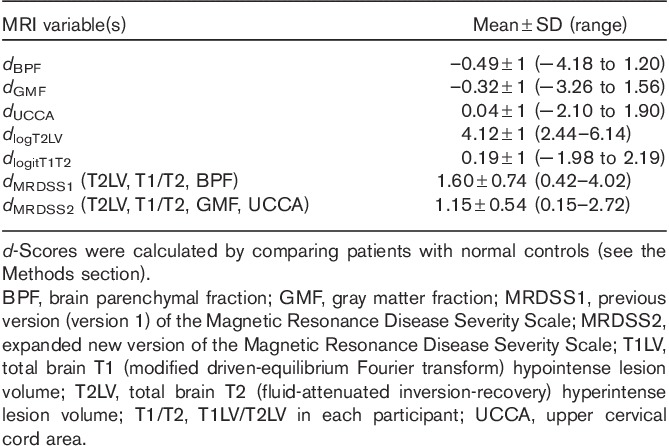
Table 3.
MRI comparisons between patients and controls
Statistical analysis
The MS and NC groups were compared on all MRI measures using Wilcoxon’s rank sum tests. Associations between MRI-derived data and measures of clinical status were assessed using Spearman’s correlation coefficient in the MS group. Cognitively impaired and cognitively preserved MS groups were compared using two-sample t-tests. In addition to the unadjusted comparison, the association between MRI measures and cognitive impairment was investigated, adjusting for depression (Center for Epidemiologic Studies Depression scale scores) using linear regression. A P-value less than 0.05 was considered significant, and a P-value less than 0.10 was considered a trend to significance in this exploratory study. Effect size (d) was also calculated for group comparisons 24.
Results
MRI–disability correlation in the MS group
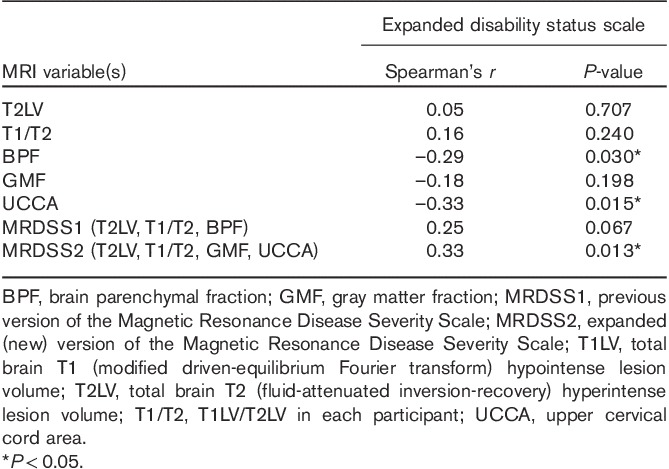
As shown in Table 4, with regard to all available MRI measures of brain and spinal cord involvement, as well as the two MRDSS versions, we tested their relationship with physical disability (EDSS score). With respect to the individual MRI components that compose the two MRDSS versions, only BPF and UCCA showed significant correlations with EDSS score (P<0.05). Considering the two MRDSS versions, MRDSS1 (T2LV, T1/T2, BPF) showed a trend toward a significant correlation with EDSS score (P<0.10). In contrast, MRDSS2 (T2LV, T1/T2, GMF, UCCA) showed a significant correlation with EDSS score (P<0.05), with the lowest P-value among all MRI measures; the correlation was only weak-to-moderate in strength. Thus, the addition of GMF and UCCA measures to MRDSS2 appears to improve the validity of the scale from the perspective of overall neurologic disability in patients with MS. Specifically, inclusion of UCCA appeared to be driving this MRI–disability relationship in MRDSS2.
Table 4.
Relationship between MRI and overall neurologic disability in the multiple sclerosis group (n=55)
MRI–cognition relationships
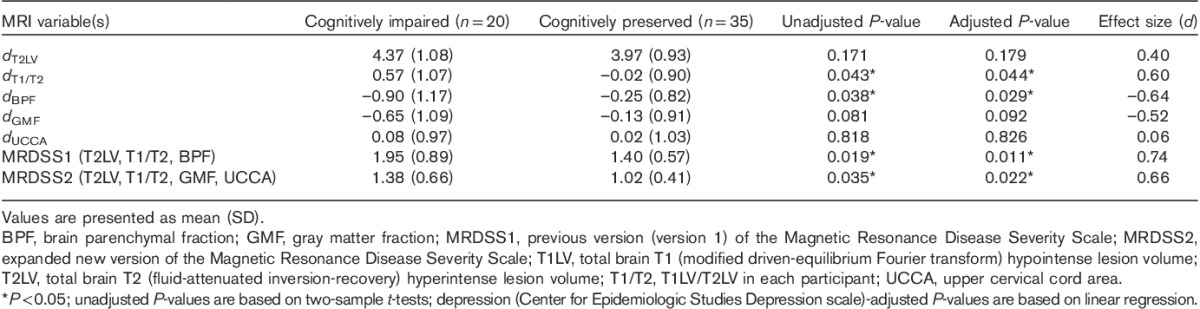
As shown in Table 5, with regard to the comparison of MRI measures between cognitively impaired and cognitively preserved patients with MS, we considered the individual components on their own, as well as the two composite scales. With respect to the individual MRI components that composed the two MRDSS versions, only T1/T2 and BPF showed significantly increased severity in the cognitively impaired group (P<0.05); GMF showed a trend toward significance (P<0.10), and the moderate effect size for this difference approached the level seen for T1/T2 and BPF. Considering the two MRDSS versions, both MRDSS1 (T2LV, T1/T2, BPF) and MRDSS2 (T2LV, T1/T2, GMF, UCCA) showed significantly higher severity in the cognitively impaired group (both P’s<0.05), with moderate-to-strong effect sizes (d 0.66–0.74). Although the effect size was higher for MRDSS1, the P-values for both were in the significant range and of similar strengths. Thus, the addition of GMF and UCCA measures to MRDSS2 did not limit the validity of the scale from the perspective of cognitive impairment in patients with MS. Moreover, one notes the value of creating a composite score in that the largest effect sizes for the comparison of the two cognition groups were achieved with the two MRDSS versions versus the individual MRI components. Finally, in considering the relevance of each core component’s contribution to MRDSS2, both cerebral lesions (T1/T2) and cerebral atrophy (GMF) parameters appeared to be driving the relationship between MRDSS2 and cognition.
Table 5.
Comparison of MRI and cognition in the multiple sclerosis group
Discussion
We describe an expanded new version of the MRDSS (MRDSS2) to assess the severity of disease in patients with MS. This version encompasses a wide range of MRI-defined measures of pathologic involvement, including brain atrophy, brain lesions, and spinal cord atrophy. The scale also considers the destructive potential of lesions by including the ratio of each patient’s total T2 lesion burden that shows corresponding hypointensity on T1-weighted images. The expanded version incorporates cerebral GM atrophy and spinal cord atrophy for the first time. In addition, the MRI was performed at 3 T to bring to bear the higher-resolution imaging offered on this emerging platform compared with lower-field (e.g. 1.5 T) platforms. The present study shows that MRDSS2 has concurrent validity with physical disability and cognitive function in patients with MS, on the basis of the fact that we showed significant MRI–clinical relationships in a cross-sectional analysis.
Given the moderate effect size of the GMF difference between cognitively impaired and cognitively preserved patients, the inclusion of cerebral GMV in MRDSS2 is warranted. Brain atrophy is common and begins to progress early in the disease course in patients with MS 6. Whole brain atrophy is dominated by GMV rather than WMV loss 6,8,11,21. Moreover, the level of global GM atrophy closely tracks MS clinical disease stage/phenotype 8 and has a high degree of relevance in predicting both physical disability 21 and cognitive impairment 22. One proposed benefit of focusing on GM rather than WM atrophy is that the GM is likely less prone than the WM to transient fluctuations in volume (e.g. fluid and cellular shifts) 6. However, univariate comparisons in the present study indicate that BPF has a higher validity than GMF for all comparisons. This might be related to the improved reliability in measuring BPF versus GMF because of the more common segmentation misclassifications and variability associated with measurement of the latter 5,18.
A major strength of this study is the inclusion of spinal cord involvement in MRDSS2. Previous MS MRI composite scale versions from our group and other groups have not included spinal cord metrics 1–4. Yet, a growing body of evidence indicates that spinal cord atrophy is common and highly relevant to disability in advanced stages of MS 9,10,12,13. Further, spinal cord involvement appears to occur somewhat independently from brain involvement 12, supporting the notion that combining brain and spinal cord MRI metrics provides complementary information on overall disease severity. The inclusion of spinal cord volume in MRDSS2 likely improved the validity of the scale, owing to the strength of its univariate relationship with physical disability (EDSS score).
MRDSS2 takes advantage of the availability and refinement of 3 T MRI, which is growing in use for MS routine clinical care and research evaluations. Our previous work has shown the higher sensitivity to brain lesions and increased relevance toward the prediction of cognitive impairment derived from 3 T versus 1.5 T MRI in MS 20. This advantage, coupled with the ability to derive higher-resolution images with tolerable scan times, drove our decision to switch the scale to a 3 T platform. However, in the present study, we did not directly compare 1.5 T-derived with 3 T-derived MRDSS scores.
Several additional aspects of our study are worthy of comment. Our MS sample was dominated by mildly affected, treated patients with relapsing forms of the disease. Given that only 9% of our patients had progressive forms of MS, further studies are required to assess the role of this scale in advanced forms of the disease. Because our sample had a restricted range of disease severity, there was limited power to detect disease involvement on each MRI parameter. For example, we did not find significant spinal cord or GM atrophy in the patients relative to controls. Our future studies will test whether methods of normalization of the spinal cord volume 7 and assessment of diffuse pathology in the normal-appearing WM 2 and cortical lesions improve the scale. We will also test nonequal weighting of the MRI measures to improve the validity of the scale. In addition, the T1 hypointense lesions in the present study were defined on gradient-echo rather than spin-echo images; the latter are a more established tool to evaluate destructive lesions 3. Finally, this cross-sectional study provides the opportunity to determine whether the MRDSS2 predicts the rate of longitudinal clinical deterioration or whether it effectively tracks the response to disease-modifying therapy 25.
Acknowledgements
This study was supported in part by a research grant to Dr Bakshi from the National Multiple Sclerosis Society (RG 4354-A-2).
Conflicts of interest
There are no conflicts of interest.
References
- 1.Wolinsky JS, Narayana PA, Noseworthy JH, Lublin FD, Whitaker JN, Linde A, et al. Linomide in relapsing and secondary progressive MS: Part II: MRI results. Neurology 2000; 54:1734–1741 [DOI] [PubMed] [Google Scholar]
- 2.Mainero C, De Stefano N, Iannucci G, Sormani MP, Guidi L, Federico A, et al. Correlates of MS disability assessed in vivo using aggregates of MR quantities. Neurology 2001; 56:1331–1334 [DOI] [PubMed] [Google Scholar]
- 3.Bakshi R, Neema M, Healy BC, Liptak Z, Betensky RA, Buckle GJ, et al. Predicting clinical progression in multiple sclerosis with the magnetic resonance disease severity scale. Arch Neurol 2008; 65:1449–1453 [DOI] [PMC free article] [PubMed] [Google Scholar]
- 4.Moodie J, Healy BC, Buckle GJ, Gauthier SA, Glanz BI, Arora A, et al. Magnetic resonance disease severity scale (MRDSS) for patients with multiple sclerosis: a longitudinal study. J Neurol Sci 2012; 315:49–54 [DOI] [PMC free article] [PubMed] [Google Scholar]
- 5.Healy BC, Valsasina P, Fillipi M, Bakshi R. Sample size requirements for treatment effects using gray matter, white matter and whole brain volume in relapsing-remitting multiple sclerosis. J Neurol Neurosurg Psychiatr 2009; 80:1218–1223 [DOI] [PMC free article] [PubMed] [Google Scholar]
- 6.Bermel RA, Bakshi R. The measurement and clinical relevance of brain atrophy in multiple sclerosis. Lancet Neurol 2006; 5:158–170 [DOI] [PubMed] [Google Scholar]
- 7.Healy BC, Arora A, Hayden D, Tauhid S, Neema M, Bakshi R. Approaches to normalization of spinal cord volume: application to multiple sclerosis. J Neuroimaging 2012; 22:e12–e19 [DOI] [PMC free article] [PubMed] [Google Scholar]
- 8.Fisher E, Lee JC, Nakamura K, Rudick RA. Gray matter atrophy in multiple sclerosis: a longitudinal study. Ann Neurol 2008; 64:255–265 [DOI] [PubMed] [Google Scholar]
- 9.Furby J, Hayton T, Anderson V, Altmann D, Brenner R, Chataway J, et al. Magnetic resonance imaging measures of brain and spinal cord atrophy correlate with clinical impairment in secondary progressive multiple sclerosis. Mult Scler 2008; 14:1068–1075 [DOI] [PubMed] [Google Scholar]
- 10.Horsfield MA, Sala S, Neema M, Absinta M, Bakshi A, Sormani MP, et al. Rapid semi-automatic segmentation of the spinal cord from magnetic resonance images: application in multiple sclerosis. Neuroimage 2010; 50:446–455 [DOI] [PMC free article] [PubMed] [Google Scholar]
- 11.Shiee N, Bazin PL, Zackowski KM, Farrell S, Harrison DM, Newsome SD, et al. Revisiting brain atrophy and its relationship to disability in multiple sclerosis. PLoS One 2012; 7:e37049. [DOI] [PMC free article] [PubMed] [Google Scholar]
- 12.Cohen AB, Neema M, Arora A, Dell’oglio E, Benedict RH, Tauhid S, et al. The relationships among MRI-defined spinal cord involvement, brain involvement, and disability in multiple sclerosis. J Neuroimaging 2012; 22:122–128 [DOI] [PMC free article] [PubMed] [Google Scholar]
- 13.Lukas C, Sombekke MH, Bellenberg B, Hahn HK, Popescu V, Bendfeldt K, et al. Relevance of spinal cord abnormalities to clinical disability in multiple sclerosis: MR imaging findings in a large cohort of patients. Radiology 2013; 269:542–552 [DOI] [PubMed] [Google Scholar]
- 14.Polman CH, Reingold SC, Edan G, Filippi M, Hartung HP, Kappos L, et al. Diagnostic criteria for multiple sclerosis: 2005 revisions to the “McDonald Criteria”. Ann Neurol 2005; 58:840–846 [DOI] [PubMed] [Google Scholar]
- 15.Neema M, Guss ZD, Stankiewicz JM, Arora A, Healy BC, Bakshi R. Normal findings on brain fluid-attenuated inversion recovery MR images at 3T. AJNR Am J Neuroradiol 2009; 30:911–916 [DOI] [PMC free article] [PubMed] [Google Scholar]
- 16.Benedict RH, Cookfair D, Gavett R, Gunther M, Munschauer F, Garg N, Weinstock-Guttman B. Validity of the minimal assessment of cognitive function in multiple sclerosis (MACFIMS). J Int Neuropsychol Soc 2006; 12:549–558 [DOI] [PubMed] [Google Scholar]
- 17.Parmenter BA, Testa SM, Schretlen DJ, Weinstock-Guttman B, Benedict RB. The utility of regression-based norms in interpreting the minimal assessment of cognitive function in multiple sclerosis (MACFIMS). J Int Neuropsychol Soc 2010; 16:6–16 [DOI] [PubMed] [Google Scholar]
- 18.Ceccarelli A, Jackson JS, Tauhid S, Arora A, Gorky J, Dell’Oglio E, et al. The impact of lesion in-painting and registration methods on voxel-based morphometry in detecting regional cerebral gray matter atrophy in multiple sclerosis. Am J Neuroradiol 2012; 33:1579–1585 [DOI] [PMC free article] [PubMed] [Google Scholar]
- 19.Stankiewicz JM, Neema M, Alsop DC, Healy BC, Arora A, Buckle GJ, et al. Spinal cord lesions and clinical status in multiple sclerosis: a 1.5T and 3T MRI study. J Neurol Sci 2009; 279:99–105 [DOI] [PMC free article] [PubMed] [Google Scholar]
- 20.Stankiewicz JM, Glanz BI, Healy BC, Arora A, Neema M, Benedict RHB, et al. Brain MRI lesion load at 1.5T and 3T versus clinical status in multiple sclerosis. J Neuroimaging 2011; 21:e50–e56 [DOI] [PMC free article] [PubMed] [Google Scholar]
- 21.Sanfilipo MP, Benedict RH, Sharma J, Weinstock-Guttman B, Bakshi R. The relationship between whole brain volume and disability in multiple sclerosis: a comparison of normalized gray vs. white matter with misclassification correction. Neuroimage 2005; 26:1068–1077 [DOI] [PubMed] [Google Scholar]
- 22.Sanfilipo MP, Benedict RH, Weinstock-Guttman B, Bakshi R. Gray and white matter brain atrophy and neuropsychological impairment in multiple sclerosis. Neurology 2006; 66:685–692 [DOI] [PubMed] [Google Scholar]
- 23.Dell’Oglio E, Ceccarelli A, Arora A, Glanz BI, Healy BC, Tauhid S, et al. A segmentation pipeline to assess global cerebral grey-matter atrophy in multiple sclerosis from 3T MRI. Mult Scler 2011; 1710 SupplS151 [Google Scholar]
- 24.Cohen J. Statistical power analysis for the behavioral sciences 1988: 2nd ed. Hillsdale, NJ: Lawrence Erlbaum Associates [Google Scholar]
- 25.Lublin FD, Cofield SS, Cutter GR, Conwit R, Narayana PA, Nelson F, et al. CombiRx Investigators. Randomized study combining interferon and glatiramer acetate in multiple sclerosis. Ann Neurol 2013; 73:327–340 [DOI] [PMC free article] [PubMed] [Google Scholar]