

Abstract
Beta frequency (13–30 Hz) oscillatory activity in the subthalamic nucleus (STN) of Parkinson's disease (PD) has been shown to influence the temporal dynamics of high-frequency oscillations (HFOs; 200–500 Hz) and single neurons, potentially compromising the functional flexibility of the motor circuit. We examined these interactions by simultaneously recording both local field potential and single-unit activity from the basal ganglia of 15 patients with PD during deep brain stimulation (DBS) surgery of the bilateral STN. Phase-amplitude coupling (PAC) in the STN was specific to beta phase and HFO amplitude, and this coupling was strongest at the dorsal STN border. We found higher beta-HFO PAC near DBS lead contacts that were clinically effective compared with the remaining non-effective contacts, indicating that PAC may be predictive of response to STN DBS. Neuronal spiking was locked to the phase of 8–30 Hz oscillations, and the spatial topography of spike-phase locking (SPL) was similar to that of PAC. Comparisons of PAC and SPL showed a lack of spatiotemporal correlations. Beta-coupled HFOs and field-locked neurons had different preferred phase angles and did not co-occur within the same cycle of the modulating oscillation. Our findings provide additional support that beta-HFO PAC may be central to the pathophysiology of PD and suggest that field-locked neurons alone are not sufficient for the emergence of beta-coupled HFOs.
Keywords: beta oscillations, cross-frequency interactions, high-frequency oscillations, Parkinson's disease, spike-field interactions, subthalamic nucleus
Introduction
Abnormal beta frequency (13–30 Hz) oscillations within the basal ganglia (BG) have been implicated in the pathophysiology of Parkinson's disease (PD). Beta oscillations in the subthalamic nucleus (STN) are reduced with voluntary movement (Levy et al., 2002), dopaminergic medications (Kühn et al., 2006), and deep brain stimulation (DBS; Eusebio et al., 2011), suggesting that these oscillations may be anti-kinetic. Conversely, gamma (60–90 Hz) and high-frequency (200–500 Hz) oscillations (HFOs), which are more prominent in the presence of exogenous dopamine (ON state; Brown et al., 2001; Foffani et al., 2003), may be pro-kinetic because movement elicits increases in spectral power in these frequency bands (Cassidy et al., 2002; Androulidakis et al., 2007; López-Azcarate et al., 2010). How aberrant activity of these oscillations leads to the hypokinetic motor symptoms of PD is not fully understood.
Recent evidence has suggested that it may not be beta oscillations per se but rather its effect on neural activity involved in motor processing that underlie the inability to select specific motor programs (Mink, 1996; Quiroga-Varela et al., 2013; Brittain and Brown, 2014). These interactions, compromising the information-coding ability or functional flexibility of the motor circuit, could be present at the level of single neurons (Levy et al., 2000, 2002) or of neuronal networks (Priori et al., 2004; Marceglia et al., 2006; López-Azcarate et al., 2010). Hence, beta oscillatory entrainment of single-unit spiking activity (Kühn et al., 2005; Weinberger et al., 2006, 2009; Moran et al., 2008) or of pro-kinetic HFOs (López-Azcarate et al., 2010) in the STN may constitute the pathologic mechanism that gives rise to the observed hypokinetic symptoms in PD.
Recordings captured during DBS surgery offer an opportunity to directly examine these interactions within the parkinsonian motor circuit. Here, we recorded local field potential (LFP) activity within and around the STN to examine the spatial extent of cross-frequency interactions between beta oscillations and HFOs. We found that these interactions were most prominent at the dorsal STN border and that the strength of these interactions were related to the clinical efficacy of DBS stimulation. We simultaneously recorded from STN units to examine the spatial extent of field-locked spiking activity and found that these interactions also peaked near the dorsal STN border. Notably, we examined the co-occurrence of cross-frequency and field-spike interactions and found no evidence of a causal relationship.
Materials and Methods
Analyses were performed using custom MATLAB scripts (MathWorks). We used a two-tailed t test to assess for statistical significance, unless otherwise noted.
Patients and surgery.
We captured intraoperative recordings in 15 patients (five males) with advanced PD undergoing DBS surgery of the bilateral STN. All patients met CAPSIT criteria for surgical treatment of PD and underwent surgery after an overnight dopaminergic medication withdrawal (12 h since the last dose). All recordings were obtained while the patients were awake, at rest, and monitored for alertness. The STN was localized anatomically on preoperative imaging and then intraoperatively by its firing pattern and background activity (Fig. 1A, right). Coordinates of the preoperative target, referenced to the midcommissural point, were x = 11.1 ± 0.2 (mean ± SEM), y = −3.5 ± 0.5, z = 4.9 ± 0.3 mm for the left hemisphere, and x = −11.6 ± 0.2, y = −3.5 ± 0.5, z = 5.0 ± 0.3 mm for the right hemisphere. All patients were implanted with Medtronic DBS lead model 3389 (1.5 mm contacts with center-to-center distances of 2 mm; Medtronic; see Fig. 3A). This study was conducted in accordance with a National Institutes of Health Institutional Review Board-approved protocol, and informed consent was obtained from all patients.
Figure 1.

Recordings of the parkinsonian BG. A, Sagittal view of an example trajectory (red) towards the STN, passing through the thalamus, zona incerta (ZI), and substantia nigra (SN). Microelectrode recordings (MERs; right) demonstrate typical cell recordings from these structures. The dorsolateral (0%) and ventromedial (100%) borders of the STN, as defined by MERs, were used to normalize recording locations across trajectories and STNs. a, Anterior; p, posterior. B, A triplet of targeting electrodes were simultaneously advanced, separated from each other in the anterior, posterior, medial, or lateral directions by 2 mm. Each targeting electrode comprises a macroelectrode (solid arrow) located 3 mm superior to the microelectrode (dotted arrow). Lat, Lateral; Cen, central; Post, posterior. C, Cumulative number of analyzed macroelectrode/microelectrode recordings at each recording depth across all trajectories demonstrating STN MERs.
Figure 3.
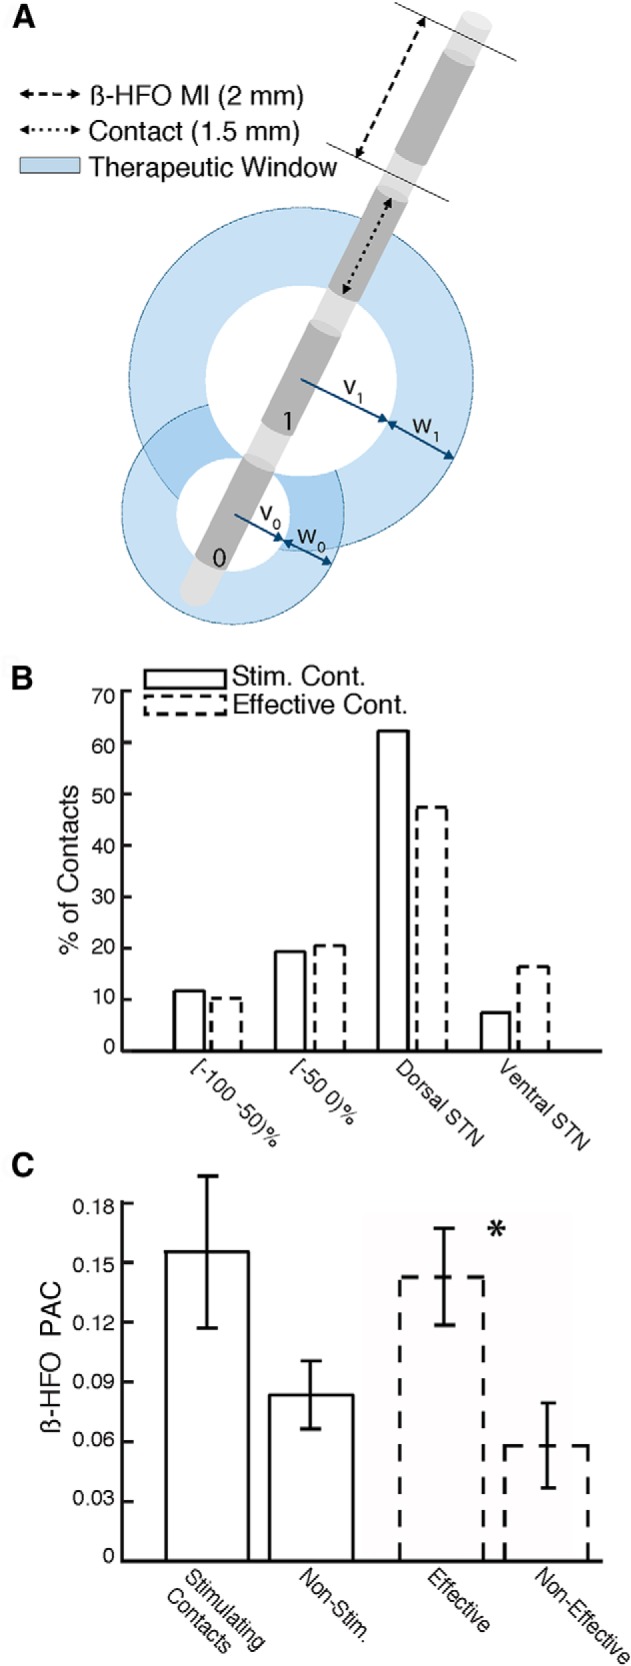
Clinical correlations of PAC. A, Schematic of DBS lead with four potential stimulating contacts. Contact 1 has a larger therapeutic window than contact 0 (w1 > w0) and a larger therapeutic window entry voltage (v1 > v0). B, For monopolar stimulation, the majority of the stimulating contacts (Stim. Cont.) and clinically effective contacts (Effective Cont.) were within 50% relative depth of the dorsal STN border. C, β-HFO PAC around stimulating contacts and nonstimulating contacts (solid) and around effective and non-effective contacts (dotted). PAC was significantly greater around effective contacts than the remaining non-effective contacts (*).
Data acquisition.
We captured intraoperative recordings using targeting electrodes comprising a pair of macroelectrode and microelectrode contacts (Alpha Omega), in which the macroelectrode contact was 3 mm superior to the microelectrode contact. Up to three targeting electrodes were simultaneously advanced to the preoperative target during each recording session (Fig. 1B). Raw signals were sampled at 1.5 and 24 kHz from macroelectrodes and microelectrodes, respectively, and stored using the MicroGuide Pro data acquisition system (Alpha Omega). Microelectrode data from the first four patients were high-pass filtered (≥300 Hz) with an acausal head-stage filter. As such, we excluded the microelectrode data from the first four patients from all of our analyses. For subsequent patients, the raw microelectrode data were acquired using a wideband (1.5 Hz to 3 kHz) acausal head-stage filter.
We extracted LFP activity by bandpass filtering macroelectrode and microelectrode signals between 1 and 500 Hz, using a 60 Hz notch filter to remove line noise. We downsampled all LFP signals to 1 kHz and referenced macroelectrode and microelectrode signals using a common average of all simultaneously-recorded macroelectrode and microelectrode signals, respectively. Jump artifacts were identified in the LFP during each recording when the z-scored broadband (25–300 Hz) power exceeded 25 SDs from baseline. For each recording, the longest segment free of jump artifacts and amplifier clipping was analyzed, excluding those recordings with artifact-free segments <6 s (Penny et al., 2008). We removed spike artifacts from microelectrode LFP signals by replacing samples between −2 and 8 ms around each spike time using a linear interpolation (Jacobs et al., 2007) and found that the results were qualitatively unchanged. The results presented here are without removal of clustered spikes.
We extracted spiking activity and multiunit activity (MUA) by bandpass filtering microelectrode recordings between 0.3 and 3 kHz and resampling at 25 kHz. Individual spike clusters were found for each recording using principal component analysis (Offline Sorter; Plexon). We classified a spike cluster as belonging to a single neuron if ≤2% of spiking events in that cluster fell within a refractory period of 1 ms. Because recordings captured dorsal to the STN could be from variable anatomic regions (e.g., thalamus, striatum, internal capsule, etc.) depending on the angle and entry point of the trajectory (Gross et al., 2006) and because spiking activity captured ventral to the STN in the substantia nigra were too limited in number to draw statistical conclusions, we restricted our spike analysis to STN neurons. We detected MUA by identifying any spiking event that exceeded an absolute amplitude threshold of 5 SDs from the mean.
Each recording could be uniquely identified by its absolute depth (in mm) with respect to the preoperative target. To aggregate data across all trajectories in each recording session and then across all sessions and patients, we normalized with respect to the recorded STN length in each trajectory by converting the absolute depth of each recording into a relative depth, with 0 and 100% representing the dorsolateral and ventromedial borders, respectively, of the STN (Fig. 1A, left). We designated relative depths <0% (dorsal to the STN) as pre-STN, 0–50% as dorsolateral STN, 50–100% as ventromedial STN, and >100% (ventral to the STN) as post-STN. Three STNs were localized using stimulation mapping, because none of the trajectories demonstrated STN activity, and the recordings captured during these sessions were excluded from analysis.
Cross-frequency interactions.
We quantified cross-frequency interactions by calculating phase-amplitude coupling (PAC), in which the amplitude of higher-frequency oscillations has a statistical dependence on the phase of lower-frequency oscillations. For each recording, we convolved LFP signals with complex-valued Morlet wavelets (wavelet number 6) to obtain amplitude and phase information for each frequency (Addison, 2002). With the phase, ϕ(t), of a lower-frequency oscillation and the amplitude, A(t), of a higher-frequency oscillation, we constructed a composite signal, z(t) = A(t)eiϕ(t). An approximate measure of PAC can be derived by calculating the mean vector length of this time series, Mraw = |z̄| (Canolty et al., 2006).
To dissociate increases in PAC from a global increase in higher-frequency power across all lower-frequency phases, we created a distribution of surrogate lengths, {Msur}, by applying a circular shift to A(t) with respect to ϕ(t) using 200 random time lags and calculating the mean vector length for each permutation. Mraw is z scored using the mean, μsur, and SD, σsur, of the surrogate distribution, {Msur}, to create a normalized PAC measure, Mnorm = (Mraw − μsur)/σsur. Assuming that {Msur} follows a normal distribution, we also calculated a corresponding p value for each Mnorm.
We calculated Mnorm for all possible combinations of modulating frequencies (4–30 Hz) incremented by 2 Hz and modulated frequencies (40–500 Hz) incremented by 15 Hz to create a co-modulogram. We divided modulating frequencies into four bands of interest: theta (4–8 Hz), alpha (8–12 Hz), low beta (13–20 Hz), and high beta (20–30 Hz). We also divided modulated frequencies into four bands of interest: (1) low gamma (40–80 Hz); (2) high gamma (80–150 Hz); (3) broadband gamma (40–150 Hz); and (4) HFOs (200–500 Hz). To correct for multiple comparisons, we used a false discovery rate (FDR) procedure with q = 0.05 applied to the p values across all frequency combinations in each recording (Genovese et al., 2002). A recording was determined to contain statistically-significant PAC between two frequency bands if at least one frequency pair within those bands had a significant Mnorm. Average PAC strength was calculated for a frequency band pair of interest by computing the mean across Mnorm values for all frequency pairs comprising those bands.
To examine the spatial topography of PAC strength across all STNs, we aggregated relative depths into bins that extended for 25% of the normalized STN length along the dorsolateral–ventromedial axis. In each bin, we included data from only those STNs with at least three recordings that were amenable for PAC calculation. We set the spatial boundaries for analysis by the most dorsal and ventral bins for which at least one-third of the recorded STNs satisfied the above condition. We also created a distribution of PAC strengths across STNs for each spatial region (pre-STN, dorsolateral STN, ventromedial STN, and post-STN).
To determine the preferred phase of beta-coupled HFOs along the modulating oscillations, we first bandpass filtered LFP signals in the beta and HFO bands and then extracted amplitude and phase information using the Hilbert transform to construct the complex time series, z(t) = Ahfo(t)eiϕβ(t). For each recording, we defined the preferred phase of beta-coupled HFOs as the phase angle of the complex mean of z(t).
Postoperative DBS programming.
One month after implantation of the DBS leads, all patients underwent an initial programming session (Volkmann et al., 2006). Monopolar screening was performed for each contact, whereby the stimulation amplitude was gradually increased, and the voltage, v, required to obtain clinical benefit (window entry) and well as side effects (window exit) were determined. A therapeutic window, w, for each contact was established by calculating the difference between the window exit and window entry voltages (see Fig. 3A), and the contact with the largest therapeutic window was chosen as the stimulating contact. In cases in which more than one contact demonstrated large therapeutic windows, one was chosen arbitrarily. In cases in which no contact demonstrated a satisfactory therapeutic window or when clinical response to monopolar stimulation diminished over time, a bipolar stimulation configuration was used.
The active programming settings were obtained from the most recent postoperative evaluation (8.4 ± 1.7 months since implantation) for our analyses. For those STNs that were stimulated using a monopolar mode, we compared beta-HFO PAC strengths between all stimulating contacts and the remaining contacts. We identified the location of each contact based on their stereotactic coordinates recorded intraoperatively. To confirm contact locations, we identified the stereotactic coordinates of each contact by coregistering the preoperative computed tomography (CT) images, in which the stereotactic head frame was in place, with the immediate postoperative CT images (StealthStation S7; Medtronic).
Mean PAC strength was calculated for each contact by averaging PAC strengths from all macroelectrode and microelectrode recordings in a 2 mm spatial window centered around that contact (see Fig. 3A). For the first four patients, we used only the macroelectrode recordings. Because the range of recorded PAC strengths varied across patients and between macroelectrode and microelectrode recordings, we normalized all recorded PAC strengths with respect to the maximum intra-STN PAC strength for the corresponding electrode type and STN, such that the mean PAC strength for each contact ranged between 0 and 1. We only included contacts with at least four recordings within the 2 mm spatial window to allow an accurate measurement of PAC.
Spike–field interactions.
We quantified the degree of correlation between spike times and LFP oscillation phases, referred to as spike-phase locking (SPL), for each recorded STN neuron. We first selected 200 spiking events at random and calculated a 3 s spike-triggered average (STA) of the LFP signal from either macroelectrode or microelectrode recordings (Fig. 4A). We bandpass filtered each STA within a frequency band of interest, [fa fb], and used the Hilbert transform to calculate the magnitude of the analytic signal, STAenv (Fig. 4B, red; Shimamoto et al., 2013). To isolate spike-related LFP changes that were consistent with a mechanistic role, we identified all local maxima in STAenv within one wavelength, λa = 1/fa, of t = 0. An approximate measure of SPL, Espike, can be derived by averaging STAenv across a window of length λ(a + b)/2 centered around its greatest local maximum (Fig. 4B, dashed).
Figure 4.

SPL in the parkinsonian STN. A, STA of a single neuron from the dorsolateral STN. B, Bandpass-filtered (8–30 Hz) version of the STA (black) and its Hilbert envelope (red). The mean amplitude of the Hilbert envelope during a 54 ms window centered at the STA peak (dotted) is normalized using the spike time-reversed STA to quantify SPL (Enorm). C, Distribution of phases of the bandpass-filtered LFP across spike times for the same unit demonstrates significant SPL (*). D, Macroelectrode recordings show a decline in SPL throughout the extent of the STN. SEM across neurons in gray. E, Microelectrode recordings demonstrate a similar pattern. F, Percentage of neurons exhibiting significant SPL in spatial bins of 20% relative depth. G, For macroelectrode recordings, the percentage of neurons with significant (Sig.) SPL (left) and the mean Enorm across all neurons (center) were significantly greater in the dorsolateral versus ventromedial STN (*). Mean Enorm across neurons with significant SPL (right) did not differ between regions. Error bars represent SEM across neurons. H, Microelectrode recordings demonstrate consistent results (*).
To dissociate peri-spike increases in LFP power from global increases throughout the entire recording, we reversed the chosen 200 spike times within each recording to generate an STA from pseudorandom LFP segments, STArev. We calculated the mean, μrev, and SD, σrev, of STArev within one wavelength, λa, of t = 0, and computed a normalized measure of SPL strength, Enorm= (Espike − μrev)/σrev. Assuming that the sample points of STArev follow a normal distribution, we also calculated a p value for each Enorm. For accurate assessment of SPL, we calculated Enorm 500 times for each neuron, using a random sample of 200 spiking events for each permutation, and averaged Enorm across all permutations. We determined a threshold for significance by similarly calculating the maximum of STArev across all neurons and finding the 95th percentile of this distribution. This threshold (1.47 for macroelectrode and 1.52 for microelectrode LFPs) corresponds to a familywise error rate of <5%. To examine the spatial topography of SPL strength, we treated single units as independent and aggregated SPL strengths within spatial bins of 20% relative depth from −10 to 110% along the dorsolateral–ventromedial axis.
To determine the preferred phase of field-locked neurons, we bandpass filtered LFP signals between 8 and 30 Hz and extracted the phase of the LFP at each spiking event using the Hilbert transform. We defined the preferred phase for each neuron as the phase angle of the complex mean of the distribution of instantaneous phases across all spiking events. We used the Rayleigh's test to determine whether the distribution of phases for individual neurons significantly deviated from uniformity.
We identified neurons with oscillatory firing patterns in the 8–30 Hz frequency band by calculating the power spectrum of individual spike trains, variable in duration, using multitapers (2 s Slepian windows with 50% overlap, producing a 0.5 Hz spectral resolution). We identified a neuron as having significant oscillatory activity if the peak power within this frequency range exceeded a threshold of 2 SDs above the mean power in the 40–70 Hz band.
Comparisons of PAC and SPL.
To assess for any temporal relation between beta-coupled HFOs and field-locked neurons, we examined recordings with both significant PAC and significant SPL. For each isolated unit, we found the peri-spike log-transformed HFO power averaged across all spike times, using a temporal window of 100 ms, which corresponds to two wavelengths of a 8–30 Hz oscillation. HFO power was z scored at each time point with respect to a distribution of surrogate HFO power values, generated by randomly permuting the interspike intervals 200 times. We performed the same analysis to examine whether spectral power in the HFO frequency band could be related to MUA, regardless of the presence of significant PAC or SPL.
For the same set of recordings exhibiting significant PAC and SPL, we further tested whether beta-coupled HFOs consistently precedes or follows field-locked neurons. We binned data in each recording using two distinct temporal epochs: upstroke-to-upstroke or downstroke-to-downstroke cycles of the 8–30 Hz bandpass-filtered LFP (see Fig. 5D, top). In each epoch, HFO power and the presence of spiking activity were found during their respective half-cycles. For each recording, we stratified HFO power across temporal epochs into quintiles and calculated the respective probabilities of finding spiking activity within the same temporal epoch. We calculated the differences in these probabilities across successive HFO quintiles and compared them for all recordings.
Figure 5.

Comparisons of PAC and SPL. A, Percentage of microelectrode recordings with both significant PAC and significant SPL, either significant PAC or significant SPL, or neither, throughout the spatial extent of the STN. B, Preferred phases of field-locked (8–30 Hz) neurons and beta-coupled HFOs calculated from macroelectrode (left) and microelectrode (right) recordings that exhibit significant SPL (top) or PAC (bottom). Spikes occur near the troughs of LFP oscillations, whereas HFOs occur near the peaks. SPL and PAC exhibited significant differences in preferred phases for both macroelectrode (*) and microelectrode (**) recordings. C, For STN microelectrode recordings exhibiting significant SPL and significant PAC, peri-spike z-scored HFO power was not significantly different from 0 within a temporal window of 100 ms centered at spike time. SEM across recordings/neurons in gray. D, For the same recordings as in C, incremental differences in the probabilities of finding spiking activity are shown across successive quintiles of HFO power, in either the preceding (dashed) or subsequent (dotted) half-cycles along the modulating oscillations (8–30 Hz). There were no significant differences from 0 in the incremental probabilities. Error bars represent SEM across recordings/neurons. E, Four non-overlapping temporal epochs of ≥6 s and ≥50 spikes from an example microelectrode recording in the dorsolateral STN shows significant PAC (significant frequency combinations in black contour) with significant SPL (*), significant PAC alone, significant SPL alone, and neither. Modulating and modulated frequency ranges as in Figure 2A.
We also examined the temporal dynamics of SPL and PAC in individual recordings by dividing each into non-overlapping time segments of ≥6 s and ≥50 spiking events. We only included recordings with at least six such epochs (total duration ≥36 s) for analysis. Because each temporal epoch did not contain a sufficient number of spikes to quantify Enorm, we calculated the complex mean of the distribution of instantaneous phases across spiking events, r̄, averaging across 500 random samples of 50 spikes in each epoch.
Results
We captured intraoperative recordings during DBS surgery of the bilateral STN in 15 PD patients (five males; 58.1 ± 2.6 years old). The disease duration was 13.8 ± 1.9 years, with a preoperative Unified Parkinson's Disease Rating Scale part III score of 18.9 ± 1.6 in the ON state and 38.5 ± 2.4 in the OFF state. As targeting electrodes were advanced toward the preoperative target (Fig. 1A,B), we identified STN spiking activity for 3.75 ± 0.19 mm in 67 of the 115 total trajectories. After removing recordings of insufficient duration following artifact rejection (see Materials and Methods), we retained 871 macroelectrode and 881 microelectrode recordings for subsequent analysis (Fig. 1C). Retained recordings had a spatial resolution of 0.60 ± 0.01 mm across trajectories demonstrating STN activity and a duration of 27.0 ± 1.0 s (median of 19.9 s) for macroelectrode and 25.4 ± 1.0 s (median of 17.9 s) for microelectrode recordings.
PAC
We calculated PAC between every modulating lower-frequency and every modulated higher-frequency oscillation for a single macroelectrode recording from the dorsolateral STN to create a co-modulogram (Fig. 2A). We found that this recording exhibited a peak in PAC between the phase of 14 Hz and amplitude of 262 Hz oscillations (Mnorm = 39.8, p < 10−300). To visualize PAC in this recording, we calculated the log-transformed power of HFOs and locked these data to the peak of the modulating beta oscillation (Fig. 2B).
Figure 2.

PAC in the parkinsonian STN. A, Mnorm for all combinations of modulating (4–30 Hz) and modulated (40–500 Hz) frequencies of the LFP signal from an example recording made in the dorsolateral STN. PAC is present between beta oscillations and HFOs. B, Visualization of PAC between beta phase and HFO amplitude for the same recording as in A. Mean time–frequency plot of the raw LFP signal time locked to peaks of beta oscillations shows increased power in the HFO frequency band. C, Macroelectrode recordings show an increase in β-HFO PAC (Mnorm) in the dorsolateral STN. SEM across STNs in gray. D, Microelectrode recordings demonstrate a similar increase in PAC at the dorsal border (0%), followed by a decline throughout the extent of the STN (0–100%). E, F, Macroelectrode and microelectrode β-HFO PAC was significantly greater (*) in the dorsolateral STN compared with the pre-STN segment. Error bars represent SEM across STNs.
We investigated the spatial topography of PAC between beta oscillations and HFOs in and around the STN. We found that macroelectrode and microelectrode LFP recordings demonstrated a significant rise in beta-HFO PAC at the dorsal border of the STN (Fig. 2C,D). Whereas the rise in PAC occurred sharply at the dorsal border in the microelectrode recordings, the rise in PAC captured using macroelectrodes was more gradual, likely because of their greater integration area. Microelectrode recordings exhibited a decrease in PAC as recording depths advanced toward the ventral STN border. For trajectories in which the recorded length of the STN was ≥2 mm, we calculated a Pearson's correlation between microelectrode beta-HFO PAC strength and relative depth and found that the distribution of correlation coefficients across STNs was significantly negative (t(17) = −2.40, p = 0.03).
We quantified the average beta-HFO PAC strengths in different spatial regions across STNs. We found significantly greater beta-HFO PAC in the dorsolateral STN relative to the pre-STN segment (t(48) = 3.00, p = 0.005, macro; t(36) = 2.23, p = 0.03, micro; Fig. 2E,F). We found that beta-HFO PAC was greater in the dorsolateral than in the ventromedial STN, but these differences were not statistically significant (t(32) = 1.81, p > 0.05, macro; t(36) = 1.14, p > 0.05, micro). The microelectrode beta-HFO PAC was greater in the dorsolateral STN than in the post-STN segment, but this difference was also not significant (t(35) = 1.63, p > 0.05).
To determine whether PAC in the parkinsonian STN was frequency specific, we tested whether PAC strength was significantly greater inside versus outside the STN between four potential modulating bands (theta, alpha, low beta, and high beta) and four potential modulated bands (low gamma, high gamma, broadband gamma, and HFO). We found significant interaction only between low and high beta with HFOs (p < 0.05; Table 1).
Table 1.
Frequency specificity of PAC and SPL
| PAC (macro/micro) |
||||
|---|---|---|---|---|
| Low gamma | High gamma | Broadband gamma | HFO | |
| Theta | t(46) = 0.99 | t(46) = 0.92 | t(46) = 0.78 | t(46) = 0.81 |
| t(36) = −0.50 | t(36) = −0.23 | t(36) = −0.62 | t(36) = −0.34 | |
| Alpha | t(46) = 1.72 | t(46) = 1.68 | t(46) = 1.17 | t(46) = 1.17 |
| t(36) = −1.15 | t(36) = −1.94 | t(36) = −0.66 | t(36) = 0.62 | |
| Low beta | t(46) = 0.64 | t(46) = 0.97 | t(46) = 0.15 | t(46) = 2.12** |
| t(36) = −0.09 | t(36) = −0.05 | t(36) = −0.12 | t(36) = 1.20 | |
| High beta | t(46) = 0.93 | t(46) = 0.85 | t(46) = 0.71 | t(46) = 2.40** |
| t(36) = 0.09 | t(36) = −0.20 | t(36) = 0.26 | t(36) = 2.00* | |
| SPL (macro/micro) |
||||
|---|---|---|---|---|
| 4–8 Hz | 8–20 Hz | 20–30 Hz | 30–40 Hz | |
| t(258) = 0.97 | t(258) = 2.59** | t(258) = 2.07** | t(258) = 0.63 | |
| t(258) = 1.24 | t(258) = 1.83* | t(258) = 2.25** | t(258) = 1.18 | |
PAC strengths were compared between inside versus outside the STN. SPL strengths were compared between the dorsolateral versus the ventromedial STN (two-tailed t test,
*p < 0.1,
**p < 0.05). Significant results are highlighted in bold.
Correlation with clinical parameters
For those STNs stimulated using a monopolar configuration (n = 26), we identified the location of stimulating contacts, chosen based on clinical considerations only (see Materials and Methods), using the relative depth of each contact. More than 80% of the stimulating contacts were within a relative depth of 50% of the dorsal border (Fig. 3B, solid). We found a significant difference between stimulating contact positions and the center of the STN (50%; t(25) = −5.38, p < 10−4) and the center of the dorsolateral STN (25%; t(25) = −2.30, p = 0.03) but found no difference from the dorsal border (0%; t(25) = 0.79, p > 0.05).
Based on this observation, we directly assessed whether PAC strength was greater around the chosen stimulating contacts compared with other remaining contacts. We found greater PAC near the stimulating contacts (n = 22; four contacts did not have a sufficient number of recordings to calculate PAC) compared with the remaining nonstimulating contacts (n = 58), although this difference only trended toward significance (t(78) = 1.97, p = 0.05; Fig. 3C, solid). Notably, we found a significant relation between PAC strength for each contact and its therapeutic window entry voltage (r(78) = −0.26, p = 0.02, Spearman's correlation; see Materials and Methods), suggesting that PAC strength may be related to the patient's sensitivity to stimulation across contacts. Given that in most cases more than one contact demonstrated large therapeutic windows, and in such cases one was chosen arbitrarily as the stimulating contact, we identified all clinically effective contacts as those with window entry voltages that were less than that of the chosen stimulating contact (43 clinically effective contacts, 35 non-effective contacts; see Materials and Methods). We found significantly greater PAC strength for effective compared with non-effective contacts (t(76) = 2.57, p = 0.01; Fig. 3C, dashed). More than 65% of the effective contacts were within 50% relative depth of the dorsal border (Fig. 3B, dashed). Similar to the stimulating contacts, there was a significant difference between effective contacts positions and the center of the STN (t(48) = −5.09, p < 10−5) and the center of the dorsolateral STN (t(48) = −2.56, p = 0.02) but no difference from the dorsal border (t(48) = −0.034, p > 0.05).
SPL
We isolated spiking activity from 357 neurons in the STN (1.5 ± 0.03 units per recording), of which 260 had a sufficient number of spikes within an artifact-free LFP segment to reliably quantify SPL. Although the macroelectrodes and microelectrodes were spatially offset by 3 mm, LFP signals of up to ∼250 Hz have been found to extend several millimeters in vivo, likely because of volume conduction (Kajikawa and Schroeder, 2011), and the low impedance and large surface areas of macroelectrodes may render them superior at measuring background extracellular potentials. Therefore, we calculated SPL across both macroelectrode and microelectrode LFP signals.
The STA for a representative dorsolateral STN neuron demonstrated large-amplitude oscillations, with a peak occurring close to the spike time, consistent with a mechanistic relation between LFP oscillations and neuronal spiking (Fig. 4A). We quantified SPL and found that spiking activity in this neuron was significantly locked to 8–30 Hz oscillations (Enorm = 14.4, p < 10−46; Fig. 4B). To confirm this result, we also extracted the instantaneous phase of LFP activity within this frequency band for each spiking event and found that the distribution of phases was significantly non-uniform (p < 10−9, Rayleigh's test; Fig. 4C).
Based on previous reports of STN neurons demonstrating coherence with LFP oscillations (Kühn et al., 2005; Weinberger et al., 2006, 2009; Moran et al., 2008), we calculated how reliably spiking activity in the STN locks to oscillations in four frequency bands: (1) 4–8 Hz; (2) 8–20 Hz; (3) 20–30 Hz; and (4) 30–40 Hz. We analyzed which frequency bands showed significantly greater SPL in the dorsolateral versus the ventromedial STN and identified the 8–20 and 20–30 Hz bands (p < 0.05; Table 1). We limited subsequent SPL analysis to the 8–30 Hz band. Neurons with significant 8–30 Hz oscillatory firing patterns localized to the dorsolateral STN (n = 108; 31.9 ± 2.5% relative depth) compared with non-oscillating neurons (n = 152; 52.9 ± 2.4%; p < 10−6, Fisher's exact test). Moreover, neurons with oscillatory firing patterns were more likely to show significant SPL (53.6%, macro; 52.9%, micro) than those that were non-oscillatory (36.2%, p = 0.01, macro; 37.5%, p = 0.03, micro).
We found that, for both macroelectrode and microelectrode LFPs, SPL decreased as recording depths progressed from the dorsolateral to ventromedial STN (Fig. 4D,E). Furthermore, there was a similar trend in the percentage of neurons with significant SPL throughout the spatial extent of the STN (Fig. 4F). Both the average SPL strength across all neurons (t(258) = 2.58, p = 0.01, macro; t(258) = 1.96, p = 0.049, micro) and the percentage of neurons exhibiting significant SPL (p < 10−3, macro; p = 0.004, micro; Fisher's exact test) were significantly greater in the dorsolateral compared with the ventromedial STN (Fig. 4G,H). However, when analyzing only the neurons that exhibited statistically significant SPL, there was no difference in average SPL strength between the dorsolateral and ventromedial STN (t(82) = 1.68, p > 0.05, macro; t(66) = 0.15, p > 0.05, micro).
Comparisons of PAC and SPL
Because beta-coupled HFOs and field-locked neurons exhibited similar spatial topographies and overlapping frequency preferences of the modulating oscillation, we investigated whether these may be related phenomena. Because HFOs are spatially constrained (Dickson et al., 2000), we restricted this analysis to microelectrode recordings to compare local HFOs and spiking activity modulated by lower-frequency oscillations.
We calculated the percentage of recordings across all STNs that exhibited significant SPL or PAC and found that, across spatial bins, each spanning 20% of the normalized STN length along the dorsolateral–ventromedial axis, the percentage of recordings exhibiting significant SPL did not correlate with the percentage exhibiting significant PAC (r(4) = 0.54, p > 0.05, Pearson's correlation; Fig. 5A). Furthermore, within each spatial bin, the percentage of recordings demonstrating significant PAC was not different between those recordings either exhibiting significant SPL or not (p > 0.05, Fisher's exact test).
Within each individual STN, we examined the spatial correlation between SPL and PAC strengths across all captured recordings (n = 12 STNs with at least six recordings, 20.3 ± 4.2 recordings per STN). None of the STNs exhibited a significant correlation between SPL and PAC (p > 0.05, FDR corrected, Spearman's correlation). The average correlation coefficient between SPL and PAC strengths across all STNs, ρ̄, was 0.11, and the distribution of correlation coefficients across STNs did not significantly differ from 0 (t(11) = 1.28, p > 0.05).
We examined the preferred phases of both beta-coupled HFOs and field-locked neurons across recordings with significant PAC or SPL, respectively, and found that beta-coupled HFOs occurred near the peaks of beta oscillations (0.44 radians, z(28) = 3.71, p = 0.02, Rayleigh's test, macro; z(35) = 1.90, p > 0.05, micro; Fig. 5B). In contrast, spiking activity occurred near the troughs of 8–30 Hz oscillations (−2.94 radians, z(33) = 3.45, p = 0.03, macro; −2.10 radians, z(37) = 6.27, p = 0.002, micro). The differences between the preferred phases were significant (F(61) = 41.19, p < 10−7, Watson–Williams test, macro; F(68) = 21.01, p < 10−4, micro). Notably, the preferred phase of field-locked neurons with the 13–30 Hz beta band were statistically indistinguishable from those found with respect to 8–30 Hz oscillations (F(63) = 0.0031, p > 0.05, macro; F(68) = 0.36, p > 0.05, micro), suggesting that the differences in preferred phase between beta-coupled HFOs and field-locked neurons were not related to the difference in the lower bounds of the modulating frequency band.
Although beta-coupled HFOs and field-locked neurons have different preferred phases, they may still be temporally related and simply offset by a phase shift along the modulating oscillation (Fig. 5D, top). However, our analysis showed that, across all STN recordings exhibiting both significant PAC and significant SPL (n = 13), the mean peri-spike z-scored HFO power did not significantly differ from 0 within a 100 ms window centered around the spike time (p > 0.05, FDR corrected; Fig. 5C). We did observe HFO power increases for up to 2 ms after spike time, but these are likely secondary to contamination of the LFP by the lower-frequency remnants of action potentials and did not survive multiple comparisons correction. To confirm that HFO power was not directly related to MUA, we performed the same analysis examining all microelectrode recordings within the STN, regardless of the presence of significant PAC or SPL, with at least 200 MUA events (n = 157). We likewise found that the mean z-scored HFO power did not significantly differ from 0 within a 100 ms window centered around each MUA event (p > 0.05, FDR corrected).
For the recordings exhibiting both significant PAC and significant SPL, we further examined whether HFO activity consistently precedes or follows spiking activity within the same cycle of the underlying 8–30 Hz oscillation, which would suggest that the two processes are related. In contrast, we found that successive quintiles of HFO power in the preceding or subsequent half-cycles, near the peak, were not associated with incrementally greater probabilities of finding spiking activity in the adjacent half-cycle, near the trough (p > 0.05, FDR corrected; Fig. 5D, bottom). We also examined the correlation between HFO power and firing rate for each of these recording across all upstroke-to-upstroke or downstroke-to-downstroke epochs to further test whether beta-coupled HFOs precede or follow field-locked neurons (see Materials and Methods). Although some individual recordings did exhibit a significant correlation across epochs (p < 0.05, FDR corrected, Spearman's correlation; 4 of 13 of upstroke-to-upstroke epochs, 1 of 13 of downstroke-to-downstroke), the distribution of correlation coefficients across all recordings did not significantly deviate from 0 (upstroke-to-upstroke, ρ̄ = 0.005, t(12) = 0.22, p > 0.05; upstroke-to-upstroke significant recordings only, ρ̄ = −0.011, t(3) = 0.13, p > 0.05; downstroke-to-downstroke, ρ̄ = 0.012, t(12) = 0.69, p > 0.05).
To directly compare the temporal dynamics of SPL and PAC within individual recordings, we identified all STN recordings of sufficient duration to examine at least six temporal epochs of ≥6 s and ≥50 spike events each (n = 24, containing 12.0 ± 0.9 epochs). We calculated beta-HFO PAC and 8–30 Hz SPL and did not find significant correlations between PAC and SPL strengths across epochs (p > 0.05, FDR corrected, Spearman's correlation). We examined the distribution of correlation coefficients across recordings and found that it did not significantly deviate from 0 (ρ̄ = 0.091, t(23) = 1.40, p > 0.05). Instead, we found some recordings containing temporal epochs with both significant PAC (Mnorm = 6.3, p < 10−9) and significant SPL (z(192) = 5.00, p = 0.007, Rayleigh's test), other epochs with either significant PAC (Mnorm = 5.6, p < 10−7) or significant SPL (z(118) = 7.48, p < 10−3) but not the other, and other epochs in which there was no significance in either SPL or PAC (Fig. 5E).
To examine whether the presence of multiple field-locked neurons was associated with significant beta-HFO PAC, we examined microelectrode recordings with at least two isolated units (n = 59; 2.1 ± 0.05 units per recording). In recordings with at least one neuron that was not locked to 8–30 Hz oscillations, there was a significantly higher probability of finding significant PAC (22 of 38 recordings) compared with those recordings with only field-locked neurons (3 of 21 recordings; p < 0.002, Fisher's exact test).
Discussion
Our data demonstrate the spatial topography of beta-HFO PAC and 8–30 Hz SPL in relation to the precise electrophysiological boundaries of the STN. Prominent beta oscillations emerge in LFP recordings of the parkinsonian STN in the OFF state (Brown et al., 2001), and these oscillations influence the temporal dynamics of HFOs (López-Azcarate et al., 2010) and single neurons (Kühn et al., 2005; Weinberger et al., 2006, 2009; Moran et al., 2008). We found that PAC strength was greatest at the dorsal STN border where stimulation was most clinically effective and that PAC strength was predictive of response to DBS therapy. This is the first study to examine PAC and SPL simultaneously, and although SPL had a similar spatial topography as PAC, we found no evidence of correlations between the two.
PD-specific PAC has been shown in the primary motor cortex (M1), in which beta phase is coupled with broadband gamma amplitude, and cross-structural PAC has been shown between STN beta phase and M1 broadband gamma amplitude (de Hemptinne et al., 2013). Because broadband gamma is thought to arise from asynchronous spiking activity of the local neuronal population (Ray et al., 2008; Manning et al., 2009; Miller et al., 2009; Ray and Maunsell, 2011), M1 PAC may represent phasic cortical input driving STN activity (Shimamoto et al., 2013), whereas cross-structural PAC may represent cortical feedback strengthening abnormal STN activity through the corticosubthalamic pathway. However, despite beta band coherence between the motor cortex and the STN (Williams et al., 2002), we found no evidence of coupling between beta phase and broadband gamma amplitude within the STN.
Instead, we found that PAC in the parkinsonian STN was frequency specific between beta oscillations and HFOs. Although originally reported between low beta and a narrow HFO sub-band (200–300 Hz; López-Azcarate et al., 2010), peak beta frequency varies among patients (Kühn et al., 2009), and narrowband beta-coupled HFOs have been observed at frequencies ≥300 Hz (de Hemptinne et al., 2013). Therefore, we calculated PAC between the entire beta band and the entire HFO band and found significantly greater PAC around clinically effective contacts than the remaining non-effective contacts. Previous studies have demonstrated that beta-HFO PAC is two orders of magnitude greater in the OFF state and that this increase is associated with an absence of movement-related changes in HFO power (López-Azcarate et al., 2010). Although disease specificity has not yet been demonstrated, these data together suggest that beta-HFO PAC is likely a pathologic feature of PD.
Our data demonstrate that PAC is maximal at the dorsal STN border, presumably the dorsal end of the sensorimotor area of the STN where M1 innervates (Nambu et al., 1996, 1997; Haynes and Haber, 2013). Previous studies have suggested that stimulation of the sensorimotor STN in addition to the afferent and efferent fibers immediately dorsal to it uniquely mediates the therapeutic effects of DBS (Hamel et al., 2003; Herzog et al., 2004; Zonenshayn et al., 2004; Godinho et al., 2006; Yokoyama et al., 2006), which is consistent with M1 being the possible origin of excessive beta oscillations (Gradinaru et al., 2009; Li et al., 2012; Shimamoto et al., 2013; de Hemptinne et al., 2013). Although the exact therapeutic mechanism of DBS remains unknown, the growing number of reports supporting the dorsal STN border as the optimal stimulation target suggests that it may partly be mediated by disruption of beta entrainment of pro-kinetic HFOs.
We found that the spatial topography of 8–30 Hz SPL exhibited greater strength in the dorsolateral compared with the ventromedial STN, similar to previous reports examining the spatial distribution of cells with oscillatory firing patterns in the beta (Weinberger et al., 2006, 2009) and 8–20 Hz (Moran et al., 2008) frequency bands. The greater proportion of significantly field-locked neurons in the dorsolateral STN may account for this spatial distribution. Indeed, there was no difference in SPL strength when comparing significantly field-locked neurons of the dorsolateral and ventromedial STN. One possibility is that SPL is a relatively binary phenomenon, although additional studies would be necessary to examine whether SPL is instead graded across neurons with a broad variance. Notably, we found that data from simultaneous LFP and unit recordings demonstrated qualitatively similar topographies for PAC and SPL. Although the frequency band modulating neuronal spiking (8–30 Hz) was slightly wider than that modulating HFOs (13–30 Hz), the peak frequency of increased beta oscillations in the OFF state varies between 8 and 35 Hz across patients and does not affect whether changes in beta power correlate with the degree of clinical response to dopaminergic medication (Kühn et al., 2009). Hence, despite the slight difference in the modulating frequency bands, the similar spatial topographies of PAC and SPL raised the question as to whether the two phenomena were associated.
It is unclear how higher-frequency (≥80 Hz) LFP oscillations arise, with one possibility being that they are electrographic artifacts arising from spectral contamination of the LFP by action potentials (Zanos et al., 2011; Belluscio et al., 2012). Recent studies have demonstrated that spectral leakage can lead to spurious hippocampal coupling between theta phase and high gamma amplitude and that this can be distinguished from true PAC (Scheffer-Teixeira et al., 2013). Although we did observe some effects of spiking activity on HFO power in our microelectrode recordings, our data suggest that the observed beta-HFO PAC is a genuine form of cross-frequency interaction because the modulating and modulated frequency bands were circumscribed, as opposed to the broadband nature of spurious coupling (Scheffer-Teixeira et al., 2013). We examined the possibility that HFO power may be related to MUA and found that the recorded HFOs in the parkinsonian STN were not tied to the many unsortable spikes that may contribute to the LFP signal. Furthermore, we found that the spatial topography of microelectrode PAC was qualitatively very similar even after removal of clustered spike artifacts, and, importantly, that beta-coupled HFOs and beta-locked neurons had significantly different preferred phases along the modulating oscillation.
Another possibility is that beta-coupled HFOs may be true oscillations that are causally related to neuronal spiking activity captured from the same microelectrode recording. Our data suggest otherwise, because we did not observe a significantly greater probability of capturing PAC during recordings that exhibited significant SPL, and there was no significant spatiotemporal correlation between the strengths of PAC and SPL. In addition, during recordings that demonstrated both significant PAC and SPL, we did not observe significant increases in HFO power locked to spike times, nor did we find that HFO power during preceding or subsequent peaks predicted the presence of spiking activity close to the trough within the same cycle of the modulating oscillation. Although our data do not reveal the cellular mechanisms that generate HFOs, they indicate that HFOs arise from a larger pool of neurons whose dynamics may not be related to that of individual neurons captured with our microelectrode recordings.
Spontaneous LFP oscillations in higher frequencies (≥200–800 Hz) have also been reported in patients with medial temporal lobe epilepsy and rodent models thereof (Bragin et al., 1999), and are referred to as fast ripples. Fast ripples have been thought to represent summed action potentials arising from clusters of hypersynchronous neurons discharging at the frequency of the fast ripple (Bragin et al., 2011). More recently, however, an in vitro model demonstrated that fast ripples can also arise from desynchronized neuronal clusters that fire out of phase from one another, leading to an emergent fast ripple of higher frequencies than the firing rates of the component neurons (Foffani et al., 2007). In fact, in vivo rodent models have shown that both activity patterns may coexist dynamically (Ibarz et al., 2010).
We found that cells with oscillatory/bursting firing patterns, whose presence is more prominent in PD (Bergman et al., 1994; Gale et al., 2009), are more likely to be phase-locked to the LFP than non-oscillating cells, consistent with previous studies (Weinberger et al., 2009). Because the intraburst firing rate is between 100 and 300 Hz (Gale et al., 2009; Sharott et al., 2014), hypersynchrony of a population of beta-locked oscillating cells could account for beta-coupled HFOs in the lower frequencies (200–300 Hz). However, higher-frequency beta-coupled HFOs (300–500 Hz) are more consistent with desynchronization into neuronal clusters that are out of phase with one other. This may explain the observed lack of spatiotemporal correlation between PAC and SPL. Indeed, for microelectrode recordings with at least two isolated units, PAC was significantly less likely to be present if all units exhibited significant SPL. Although interpreting these findings is difficult given the small number of cells captured in any one recording, these data suggest that a cluster of beta-locked neurons alone may be insufficient to give rise to beta-coupled HFOs.
We acquired our data while patients were awake, at rest, and monitored for alertness. Hence, one limitation of this study is that we did not examine changes in PAC and SPL during voluntary movement, which has been associated with dynamic changes in neuronal firing (Rodriguez-Oroz et al., 2001), beta oscillations (Levy et al., 2002), and HFOs (López-Azcarate et al., 2010). In addition, involuntary movements that may be present at rest, such as tremor, may contribute to HFOs or lead to artifacts with spectral content in the HFO frequency range. Given the coherence between STN LFPs and EMG signals in the theta and beta frequency bands (Marsden et al., 2001), whether tremor-related higher-frequency activity may also exhibit some form of cross-frequency interaction remains an open question.
In conclusion, our data demonstrate that beta oscillations in the parkinsonian STN entrain HFOs and spiking activity with a spatially precise topography but that the two electrophysiologic phenomena may not be directly related. The relatively stable beta oscillations (Bronte-Stewart et al., 2009) entrain neurons in the STN such that the observed SPL likely reflects a cluster of neurons locked to the underlying beta oscillations. Conversely, we propose that beta-coupled HFOs may emerge from a larger pool of desynchronized neuronal clusters that together give rise to nonstationary HFOs in the LFP.
Footnotes
We thank Judith R Walters for comments on this manuscript and John H. Wittig Jr, Baltazar A. Zavala, Srikanth R. Damera, Rafi Haque, and Shervin Rahimpour for many helpful discussions.
The authors declare no competing financial interests.
References
- Addison PS. The illustrated wavelet transform handbook: introductory theory and applications in science, engineering, medicine and finance. Bristol, UK: Institute of Physics Publishing; 2002. [Google Scholar]
- Androulidakis AG, Kühn AA, Chen CC, Blomstedt P, Kempf F, Kupsch A, Schneider GH, Doyle L, Dowsey-Limousin P, Hariz MI, Brown P. Dopaminergic therapy promotes lateralized motor activity in the subthalamic area in Parkinson's disease. Brain. 2007;130:457–468. doi: 10.1093/brain/awl358. [DOI] [PubMed] [Google Scholar]
- Belluscio MA, Mizuseki K, Schmidt R, Kempter R, Buzsáki G. Cross-frequency phase-phase coupling between θ and γ oscillations in the hippocampus. J Neurosci. 2012;32:423–435. doi: 10.1523/JNEUROSCI.4122-11.2012. [DOI] [PMC free article] [PubMed] [Google Scholar]
- Bergman H, Wichmann T, Karmon B, DeLong MR. The primate subthalamic nucleus. II. Neuronal activity in the MPTP model of parkinsonism. J Neurophysiol. 1994;72:507–520. doi: 10.1152/jn.1994.72.2.507. [DOI] [PubMed] [Google Scholar]
- Bragin A, Engel J, Jr, Wilson CL, Fried I, Mathern GW. Hippocampal and entorhinal cortex high-frequency oscillations (100–500 Hz) in human epileptic brain and in kainic acid-treated rats with chronic seizures. Epilepsia. 1999;40:127–137. doi: 10.1111/j.1528-1157.1999.tb02065.x. [DOI] [PubMed] [Google Scholar]
- Bragin A, Benassi SK, Kheiri F, Engel J., Jr Further evidence that pathologic high-frequency oscillations are bursts of population spikes derived from recordings of identified cells in dentate gyrus. Epilepsia. 2011;52:45–52. doi: 10.1111/j.1528-1167.2010.02896.x. [DOI] [PMC free article] [PubMed] [Google Scholar]
- Brittain JS, Brown P. Oscillations and the basal ganglia: motor control and beyond. Neuroimage. 2014;85:637–647. doi: 10.1016/j.neuroimage.2013.05.084. [DOI] [PMC free article] [PubMed] [Google Scholar]
- Bronte-Stewart H, Barberini C, Koop MM, Hill BC, Henderson JM, Wingeier B. The STN beta-band profile in Parkinson's disease is stationary and shows prolonged attenuation after deep brain stimulation. Exp Neurol. 2009;215:20–28. doi: 10.1016/j.expneurol.2008.09.008. [DOI] [PubMed] [Google Scholar]
- Brown P, Oliviero A, Mazzone P, Insola A, Tonali P, Di Lazzaro V. Dopamine dependency of oscillations between subthalamic nucleus and pallidum in Parkinson's disease. J Neurosci. 2001;21:1033–1038. doi: 10.1523/JNEUROSCI.21-03-01033.2001. [DOI] [PMC free article] [PubMed] [Google Scholar]
- Canolty RT, Edwards E, Dalal SS, Soltani M, Nagarajan SS, Kirsch HE, Berger MS, Barbaro NM, Knight RT. High gamma power is phase-locked to theta oscillations in human neocortex. Science. 2006;313:1626–1628. doi: 10.1126/science.1128115. [DOI] [PMC free article] [PubMed] [Google Scholar]
- Cassidy M, Mazzone P, Oliviero A, Insola A, Tonali P, Di Lazzaro V, Brown P. Movement-related changes in synchronization in the human basal ganglia. Brain. 2002;125:1235–1246. doi: 10.1093/brain/awf135. [DOI] [PubMed] [Google Scholar]
- de Hemptinne C, Ryapolova-Webb ES, Air EL, Garcia PA, Miller KJ, Ojemann JG, Ostrem JL, Galifianakis NB, Starr PA. Exaggerated phase-amplitude coupling in the primary motor cortex in Parkinson disease. Proc Natl Acad Sci U S A. 2013;110:4780–4785. doi: 10.1073/pnas.1214546110. [DOI] [PMC free article] [PubMed] [Google Scholar]
- Dickson CT, Biella G, de Curtis M. Evidence for spatial modules mediated by temporal synchronization of carbachol-induced gamma rhythm in medial entorhinal cortex. J Neurosci. 2000;20:7846–7854. doi: 10.1523/JNEUROSCI.20-20-07846.2000. [DOI] [PMC free article] [PubMed] [Google Scholar]
- Eusebio A, Thevathasan W, Doyle Gaynor L, Pogosyan A, Bye E, Foltynie T, Zrinzo L, Ashkan K, Aziz T, Brown P. Deep brain stimulation can suppress pathological synchronisation in parkinsonian patients. J Neurol Neurosurg Psychiatr. 2011;82:569–573. doi: 10.1136/jnnp.2010.217489. [DOI] [PMC free article] [PubMed] [Google Scholar]
- Foffani G, Priori A, Egidi M, Rampini P, Tamma F, Caputo E, Moxon KA, Cerutti S, Barbieri S. 300-Hz subthalamic oscillations in Parkinson's disease. Brain. 2003;126:2153–2163. doi: 10.1093/brain/awg229. [DOI] [PubMed] [Google Scholar]
- Foffani G, Uzcategui YG, Gal B, Menendez de la Prida L. Reduced spike-timing reliability correlates with the emergence of fast ripples in the rat epileptic hippocampus. Neuron. 2007;55:930–941. doi: 10.1016/j.neuron.2007.07.040. [DOI] [PubMed] [Google Scholar]
- Gale JT, Shields DC, Jain FA, Amirnovin R, Eskandar EN. Subthalamic nucleus discharge patterns during movement in the normal monkey and Parkinsonian patient. Brain Res. 2009;1260:15–23. doi: 10.1016/j.brainres.2008.12.062. [DOI] [PMC free article] [PubMed] [Google Scholar]
- Genovese CR, Lazar NA, Nichols T. Thresholding of statistical maps in functional neuroimaging using the false discovery rate. Neuroimage. 2002;15:870–878. doi: 10.1006/nimg.2001.1037. [DOI] [PubMed] [Google Scholar]
- Godinho F, Thobois S, Magnin M, Guenot M, Polo G, Benatru I, Xie J, Salvetti A, Garcia-Larrea L, Broussolle E, Mertens P. Subthalamic nucleus stimulation in Parkinson's disease: anatomical and electrophysiological localization of active contacts. J Neurol. 2006;253:1347–1355. doi: 10.1007/s00415-006-0222-z. [DOI] [PubMed] [Google Scholar]
- Gradinaru V, Mogri M, Thompson KR, Henderson JM, Deisseroth K. Optical deconstruction of parkinsonian neural circuitry. Science. 2009;324:354–359. doi: 10.1126/science.1167093. [DOI] [PMC free article] [PubMed] [Google Scholar]
- Gross RE, Krack P, Rodriguez-Oroz MC, Rezai AR, Benabid A-L. Electrophysiological mapping for the implantation of deep brain stimulators for Parkinson's disease and tremor. Mov Disord. 2006;21(Suppl 14):S259–S283. doi: 10.1002/mds.20960. [DOI] [PubMed] [Google Scholar]
- Hamel W, Fietzek U, Morsnowski A, Schrader B, Herzog J, Weinert D, Pfister G, Müller D, Volkmann J, Deuschl G, Mehdorn HM. Deep brain stimulation of the subthalamic nucleus in Parkinson's disease: evaluation of active electrode contacts. J Neurol Neurosurg Psychiatr. 2003;74:1036–1046. doi: 10.1136/jnnp.74.8.1036. [DOI] [PMC free article] [PubMed] [Google Scholar]
- Haynes WIA, Haber SN. The organization of prefrontal-subthalamic inputs in primates provides an anatomical substrate for both functional specificity and integration: implications for basal ganglia models and deep brain stimulation. J Neurosci. 2013;33:4804–4814. doi: 10.1523/JNEUROSCI.4674-12.2013. [DOI] [PMC free article] [PubMed] [Google Scholar]
- Herzog J, Fietzek U, Hamel W, Morsnowski A, Steigerwald F, Schrader B, Weinert D, Pfister G, Müller D, Mehdorn HM, Deuschl G, Volkmann J. Most effective stimulation site in subthalamic deep brain stimulation for Parkinson's disease. Mov Disord. 2004;19:1050–1054. doi: 10.1002/mds.20056. [DOI] [PubMed] [Google Scholar]
- Ibarz JM, Foffani G, Cid E, Inostroza M, Menendez de la Prida L. Emergent dynamics of fast ripples in the epileptic hippocampus. J Neurosci. 2010;30:16249–16261. doi: 10.1523/JNEUROSCI.3357-10.2010. [DOI] [PMC free article] [PubMed] [Google Scholar]
- Jacobs J, Kahana MJ, Ekstrom AD, Fried I. Brain oscillations control timing of single-neuron activity in humans. J Neurosci. 2007;27:3839–3844. doi: 10.1523/JNEUROSCI.4636-06.2007. [DOI] [PMC free article] [PubMed] [Google Scholar]
- Kajikawa Y, Schroeder CE. How local is the local field potential? Neuron. 2011;72:847–858. doi: 10.1016/j.neuron.2011.09.029. [DOI] [PMC free article] [PubMed] [Google Scholar]
- Kühn AA, Trottenberg T, Kivi A, Kupsch A, Schneider GH, Brown P. The relationship between local field potential and neuronal discharge in the subthalamic nucleus of patients with Parkinson's disease. Exp Neurol. 2005;194:212–220. doi: 10.1016/j.expneurol.2005.02.010. [DOI] [PubMed] [Google Scholar]
- Kühn AA, Kupsch A, Schneider GH, Brown P. Reduction in subthalamic 8–35 Hz oscillatory activity correlates with clinical improvement in Parkinson's disease. Eur J Neurosci. 2006;23:1956–1960. doi: 10.1111/j.1460-9568.2006.04717.x. [DOI] [PubMed] [Google Scholar]
- Kühn AA, Tsui A, Aziz T, Ray N, Brücke C, Kupsch A, Schneider GH, Brown P. Pathological synchronisation in the subthalamic nucleus of patients with Parkinson's disease relates to both bradykinesia and rigidity. Exp Neurol. 2009;215:380–387. doi: 10.1016/j.expneurol.2008.11.008. [DOI] [PubMed] [Google Scholar]
- Levy R, Hutchison WD, Lozano AM, Dostrovsky JO. High-frequency synchronization of neuronal activity in the subthalamic nucleus of parkinsonian patients with limb tremor. J Neurosci. 2000;20:7766–7775. doi: 10.1523/JNEUROSCI.20-20-07766.2000. [DOI] [PMC free article] [PubMed] [Google Scholar]
- Levy R, Ashby P, Hutchison WD, Lang AE, Lozano AM, Dostrovsky JO. Dependence of subthalamic nucleus oscillations on movement and dopamine in Parkinson's disease. Brain. 2002;125:1196–1209. doi: 10.1093/brain/awf128. [DOI] [PubMed] [Google Scholar]
- Li Q, Ke Y, Chan DCW, Qian ZM, Yung KKL, Ko H, Arbuthnott GW, Yung WH. Therapeutic deep brain stimulation in Parkinsonian rats directly influences motor cortex. Neuron. 2012;76:1030–1041. doi: 10.1016/j.neuron.2012.09.032. [DOI] [PubMed] [Google Scholar]
- López-Azcárate J, Tainta M, Rodríguez-Oroz MC, Valencia M, González R, Guridi J, Iriarte J, Obeso JA, Artieda J, Alegre M. Coupling between beta and high-frequency activity in the human subthalamic nucleus may be a pathophysiological mechanism in Parkinson's disease. J Neurosci. 2010;30:6667–6677. doi: 10.1523/JNEUROSCI.5459-09.2010. [DOI] [PMC free article] [PubMed] [Google Scholar]
- Manning JR, Jacobs J, Fried I, Kahana MJ. Broadband shifts in local field potential power spectra are correlated with single-neuron spiking in humans. J Neurosci. 2009;29:13613–13620. doi: 10.1523/JNEUROSCI.2041-09.2009. [DOI] [PMC free article] [PubMed] [Google Scholar]
- Marceglia S, Foffani G, Bianchi AM, Baselli G, Tamma F, Egidi M, Priori A. Dopamine-dependent non-linear correlation between subthalamic rhythms in Parkinson's disease. J Physiol. 2006;571:579–591. doi: 10.1113/jphysiol.2005.100271. [DOI] [PMC free article] [PubMed] [Google Scholar]
- Marsden JF, Limousin-Dowsey P, Ashby P, Pollak P, Brown P. Subthalamic nucleus, sensorimotor cortex and muscle interrelationships in Parkinson's disease. Brain. 2001;124:378–388. doi: 10.1093/brain/124.2.378. [DOI] [PubMed] [Google Scholar]
- Miller KJ, Sorensen LB, Ojemann JG, den Nijs M. Power-law scaling in the brain surface electric potential. PLoS Comput Biol. 2009;5:e1000609. doi: 10.1371/journal.pcbi.1000609. [DOI] [PMC free article] [PubMed] [Google Scholar]
- Mink JW. The basal ganglia: focused selection and inhibition of competing motor programs. Prog Neurobiol. 1996;50:381–425. doi: 10.1016/S0301-0082(96)00042-1. [DOI] [PubMed] [Google Scholar]
- Moran A, Bergman H, Israel Z, Bar-Gad I. Subthalamic nucleus functional organization revealed by parkinsonian neuronal oscillations and synchrony. Brain. 2008;131:3395–3409. doi: 10.1093/brain/awn270. [DOI] [PubMed] [Google Scholar]
- Nambu A, Takada M, Inase M, Tokuno H. Dual somatotopical representations in the primate subthalamic nucleus: evidence for ordered but reversed body-map transformations from the primary motor cortex and the supplementary motor area. J Neurosci. 1996;16:2671–2683. doi: 10.1523/JNEUROSCI.16-08-02671.1996. [DOI] [PMC free article] [PubMed] [Google Scholar]
- Nambu A, Tokuno H, Inase M, Takada M. Corticosubthalamic input zones from forelimb representations of the dorsal and ventral divisions of the premotor cortex in the macaque monkey: comparison with the input zones from the primary motor cortex and the supplementary motor area. Neurosci Lett. 1997;239:13–16. doi: 10.1016/S0304-3940(97)00877-X. [DOI] [PubMed] [Google Scholar]
- Penny WD, Duzel E, Miller KJ, Ojemann JG. Testing for nested oscillation. J Neurosci Methods. 2008;174:50–61. doi: 10.1016/j.jneumeth.2008.06.035. [DOI] [PMC free article] [PubMed] [Google Scholar]
- Priori A, Foffani G, Pesenti A, Tamma F, Bianchi AM, Pellegrini M, Locatelli M, Moxon KA, Villani RM. Rhythm-specific pharmacological modulation of subthalamic activity in Parkinson's disease. Exp Neurol. 2004;189:369–379. doi: 10.1016/j.expneurol.2004.06.001. [DOI] [PubMed] [Google Scholar]
- Quiroga-Varela A, Walters JR, Brazhnik E, Marin C, Obeso JA. What basal ganglia changes underlie the parkinsonian state? The significance of neuronal oscillatory activity. Neurobiol Dis. 2013;58:242–248. doi: 10.1016/j.nbd.2013.05.010. [DOI] [PMC free article] [PubMed] [Google Scholar]
- Ray S, Maunsell JH. Different origins of gamma rhythm and high-gamma activity in macaque visual cortex. PLoS Biol. 2011;9:e1000610. doi: 10.1371/journal.pbio.1000610. [DOI] [PMC free article] [PubMed] [Google Scholar]
- Ray S, Crone NE, Niebur E, Franaszczuk PJ, Hsiao SS. Neural correlates of high-gamma oscillations (60–200 Hz) in macaque local field potentials and their potential implications in electrocorticography. J Neurosci. 2008;28:11526–11536. doi: 10.1523/JNEUROSCI.2848-08.2008. [DOI] [PMC free article] [PubMed] [Google Scholar]
- Rodriguez-Oroz MC, Rodriguez M, Guridi J, Mewes K, Chockkman V, Vitek J, DeLong MR, Obeso JA. The subthalamic nucleus in Parkinson's disease: somatotopic organization and physiological characteristics. Brain. 2001;124:1777–1790. doi: 10.1093/brain/124.9.1777. [DOI] [PubMed] [Google Scholar]
- Scheffer-Teixeira R, Belchior H, Leão RN, Ribeiro S, Tort AB. On high-frequency field oscillations (>100 Hz) and the spectral leakage of spiking activity. J Neurosci. 2013;33:1535–1539. doi: 10.1523/JNEUROSCI.4217-12.2013. [DOI] [PMC free article] [PubMed] [Google Scholar]
- Sharott A, Gulberti A, Zittel S, Tudor Jones AA, Fickel U, Münchau A, Köppen JA, Gerloff C, Westphal M, Buhmann C, Hamel W, Engel AK, Moll CK. Activity parameters of subthalamic nucleus neurons selectively predict motor symptom severity in Parkinson's disease. J Neurosci. 2014;34:6273–6285. doi: 10.1523/JNEUROSCI.1803-13.2014. [DOI] [PMC free article] [PubMed] [Google Scholar]
- Shimamoto SA, Ryapolova-Webb ES, Ostrem JL, Galifianakis NB, Miller KJ, Starr PA. Subthalamic nucleus neurons are synchronized to primary motor cortex local field potentials in Parkinson's disease. J Neurosci. 2013;33:7220–7233. doi: 10.1523/JNEUROSCI.4676-12.2013. [DOI] [PMC free article] [PubMed] [Google Scholar]
- Volkmann J, Moro E, Pahwa R. Basic algorithms for the programming of deep brain stimulation in Parkinson's disease. Mov Disord. 2006;21(Suppl 14):S284–S289. doi: 10.1002/mds.20961. [DOI] [PubMed] [Google Scholar]
- Weinberger M, Mahant N, Hutchison WD, Lozano AM, Moro E, Hodaie M, Lang AE, Dostrovsky JO. Beta oscillatory activity in the subthalamic nucleus and its relation to dopaminergic response in Parkinson's disease. J Neurophysiol. 2006;96:3248–3256. doi: 10.1152/jn.00697.2006. [DOI] [PubMed] [Google Scholar]
- Weinberger M, Hutchison WD, Lozano AM, Hodaie M, Dostrovsky JO. Increased gamma oscillatory activity in the subthalamic nucleus during tremor in Parkinson's disease patients. J Neurophysiol. 2009;101:789–802. doi: 10.1152/jn.90837.2008. [DOI] [PubMed] [Google Scholar]
- Williams D, Tijssen M, Van Bruggen G, Bosch A, Insola A, Di Lazzaro V, Mazzone P, Oliviero A, Quartarone A, Speelman H, Brown P. Dopamine-dependent changes in the functional connectivity between basal ganglia and cerebral cortex in humans. Brain. 2002;125:1558–1569. doi: 10.1093/brain/awf156. [DOI] [PubMed] [Google Scholar]
- Yokoyama T, Ando N, Sugiyama K, Akamine S, Namba H. Relationship of stimulation site location within the subthalamic nucleus region to clinical effects on parkinsonian symptoms. Stereotact Funct Neurosurg. 2006;84:170–175. doi: 10.1159/000094956. [DOI] [PubMed] [Google Scholar]
- Zanos TP, Mineault PJ, Pack CC. Removal of spurious correlations between spikes and local field potentials. J Neurophysiol. 2011;105:474–486. doi: 10.1152/jn.00642.2010. [DOI] [PubMed] [Google Scholar]
- Zonenshayn M, Sterio D, Kelly PJ, Rezai AR, Beric A. Location of the active contact within the subthalamic nucleus (STN) in the treatment of idiopathic Parkinson's disease. Surg Neurol. 2004;62:216–225. doi: 10.1016/j.surneu.2003.09.039. discussion 225–226. [DOI] [PubMed] [Google Scholar]