

Abstract
A variety of neurons and synapses shows a maximal response at a preferred frequency, generally considered to be important in shaping network activity. We are interested in whether all neurons and synapses in a recurrent oscillatory network can have preferred frequencies and, if so, whether these frequencies are the same or correlated, and whether they influence the network activity. We address this question using identified neurons in the pyloric network of the crab Cancer borealis. Previous work has shown that the pyloric pacemaker neurons exhibit membrane potential resonance whose resonance frequency is correlated with the network frequency. The follower lateral pyloric (LP) neuron makes reciprocally inhibitory synapses with the pacemakers. We find that LP shows resonance at a higher frequency than the pacemakers and the network frequency falls between the two. We also find that the reciprocal synapses between the pacemakers and LP have preferred frequencies but at significantly lower values. The preferred frequency of the LP to pacemaker synapse is correlated with the presynaptic preferred frequency, which is most pronounced when the peak voltage of the LP waveform is within the dynamic range of the synaptic activation curve and a shift in the activation curve by the modulatory neuropeptide proctolin shifts the frequency preference. Proctolin also changes the power of the LP neuron resonance without significantly changing the resonance frequency. These results indicate that different neuron types and synapses in a network may have distinct preferred frequencies, which are subject to neuromodulation and may interact to shape network oscillations.
Keywords: central pattern generator, neuromodulation, resonance, stomatogastric
Introduction
Most synapses show short-term plasticity (Klug et al., 2012; Regehr, 2012; Blackman et al., 2013). In oscillatory networks, short-term plasticity allows synapses to exhibit frequency-dependent efficacy (Nadim and Manor, 2000; Fortune and Rose, 2001; Abbott and Regehr, 2004; Bao et al., 2010) by adjusting the synaptic strength in response to input frequency (Rothman et al., 2009; Regehr, 2012). The most common forms of short-term plasticity are depression and facilitation (Fioravante and Regehr, 2011), but synapses often demonstrate both, resulting in a preferred presynaptic frequency at which the synapse responds with maximal efficacy (Markram et al., 1998; Izhikevich et al., 2003; Drover et al., 2007; Oh et al., 2010).
Similarly, many neurons exhibit preferred frequencies in the form of membrane resonance, a maximum impedance in response to subthreshold input at a preferred (resonance) frequency (Hutcheon and Yarom, 2000). In a number of oscillatory networks the resonance frequency of neurons has been shown to correlate with the network frequency (Wu et al., 2001; Tohidi and Nadim, 2009; Lau and Zochowski, 2011; Ledoux and Brunel, 2011; Sciamanna and Wilson, 2011; Moca et al., 2014). However, the network frequency is usually reported as a range of values and it is unclear whether different neuron types have distinct preferred frequencies.
We examine the hypothesis that neurons and synapses in an oscillatory network have the same preferred frequency, which shapes the network frequency. We address this hypothesis using identified neurons and synapses in a reciprocally inhibitory network. The pyloric network in the crustacean stomatogastric ganglion (STG) produces a stable triphasic rhythm (∼1 Hz), driven by the synchronous bursting of a pacemaker group [anterior burster (AB) and pyloric dilator (PD)], which drives follower neurons with strong inhibitory synapses (Marder and Eisen, 1984; Rabbah and Nadim, 2007). The lateral pyloric (LP) follower neuron provides inhibitory feedback to the PD neurons (Miller and Selverston, 1982; Mamiya and Nadim, 2004). In the crab Cancer borealis, the AB and PD neurons exhibit resonance with a frequency that is correlated with the pyloric network frequency (Tohidi and Nadim, 2009). Furthermore, the PD neuron resonance is nonlinear and strongly influenced by its voltage range (Tseng and Nadim, 2010). The reciprocal synapses between the pacemaker neurons and the LP neuron are known to exhibit short-term depression (Manor et al., 1997; Mamiya and Nadim, 2004; Rabbah and Nadim, 2007). Additionally, endogenous peptide neuromodulators such as proctolin can modulate these synapses and alter synaptic dynamics (Thirumalai et al., 2006; Nadim and Sheibanie, 2010; Zhao et al., 2011).
We investigate whether the follower LP neuron also exhibits resonance and characterize how changes in its voltage range may alter its resonance properties. Additionally, we show that the reciprocal synapses between the pacemakers and LP have preferred frequencies and explore the relationship between the resonance frequency of the presynaptic neurons and the preferred frequencies of the synapses. We then focus on the LP to PD synapse and examine how its frequency preference properties depend on the synaptic activation curve and, therefore, on the presynaptic voltage amplitude. Finally, we examine how the increase in synaptic efficacy and the shift in the synaptic activation curve by the neuropeptide proctolin affect the preferred frequency of the LP to PD synapse.
Materials and Methods
Experimental protocols.
Adult male crabs (C. borealis) were purchased from local seafood markets and kept in tanks filled with artificial sea water at 10−12°C until use. Before dissection, crabs were placed on ice for 20–30 min to anesthetize them. The dissection was performed following standard protocols as described previously (Mulloney and Selverston, 1974; Tohidi and Nadim, 2009). Briefly, after dissection, the stomatogastric nervous system—including the commissural ganglia, the esophageal ganglion, the STG, the nerves connecting these ganglia and the motor nerves—was dissected and pinned down in a 100 mm Petri dish coated with clear silicon elastomer Sylgard (Dow Corning). The STG was desheathed to expose the neurons for impalement. During the experiment, the preparation was superfused with normal Cancer saline (11 mm KCl, 440 mm NaCl, 13 mMCaCl2 · 2H2O, 26 mm MgCl2 · 6H2O, 11.2 mm Trizma base, and 5.1 mm maleic acid, pH 7.4–7.5) at 10−13°C. The PD and LP neurons were identified by matching their intracellular activity with the extracellular action potentials on the corresponding motor nerves.
Intracellular recordings were done using Axoclamp 2B amplifiers (Molecular Devices). Intracellular glass electrodes were prepared using a Flaming–Brown micropipette puller (P97; Sutter Instrument) and then filled with the electrode solution (0.6 m K2SO4 and 0.02 m KCl; electrode resistance 15–30 MΩ). Extracellular recordings from identified motor nerves were obtained using stainless steel wire electrodes, inserted inside and outside of a petroleum jelly well, built to electrically isolate a small section of the nerve. Extracellular recordings were obtained using a differential AC amplifier (A-M Systems 1700).
Logarithmic ZAP function.
To examine the properties of the neurons and synapses at a range of frequencies, a ZAP (chirp) function was applied to the presynaptic neuron. This function can be described as follows:
where B is the baseline, A is the amplitude, and f(t) is a monotonically increasing function that determines the frequency range to be covered. When the ZAP function was applied in voltage clamp, B = Vlow and A = Vhigh − Vlow (see next section). To obtain a larger sample set at the lower frequency range, we used a logarithmic ZAP function by setting f(t) to be the following:
 |
where Fbeg and Fend are the initial and final frequencies in the sweep, and T is its total duration. For the voltage range experiments, we used a frequency range from Fbeg = 0.1 to Fend = 4 Hz. After obtaining preliminary results that showed the synaptic preferred frequency to be <1 Hz, we used a frequency range from Fbeg = 0.1 to Fend = 2 Hz for better resolution when measuring the synaptic output. All sweeps used were with T = 100 s. Longer sweeps did not produce a different result, presumably because we were limiting the sweep to a low range of frequencies. Also, several trials in which we ran the sweep in the opposite direction, from 4 to 0.1 Hz, produced identical results and these are not shown. In every experiment, we also added three precycles of sinusoidal waveform at the lowest frequency (Fbeg = 0.1 Hz), before transitioning smoothly into the ZAP function, to avoid transients at the beginning of the sweep. The final sweep duration in each run was therefore 130 s.
Measurement of membrane-potential resonance in the LP neuron.
After identifying the neurons, we used 10−7 m TTX (Biotium) to block action potentials, which also effectively blocks the release of endogenous neuromodulators and ongoing oscillations. We used two-electrode voltage clamp and clamped the LP neuron and applied the ZAP function voltage waveform and recorded the injected current. In each sweep, the membrane potential was clamped first at a holding value equal to the minimum value of the ZAP function (Vlow, usually −60 mV), followed by the ZAP function protocol (see above). Each data point reported is the average of three applications (sweeps) of the ZAP function. The ZAP function had a voltage range depending on the experiment design. Our control voltage range was Vlow = −60 mV to Vhigh = −30 mV. To examine the effects of shifting the oscillation voltage range, we shifted the maximum voltage Vhigh by ±4 mV (to −34, −30, and −26 mV) or, alternatively, we shifted the minimum voltage Vlow by ±10 mV (−70, −60, and −50 mV; Tseng and Nadim, 2010). The impedance profile was generated in MATLAB (MathWorks). The impedance, Z(f), was obtained by calculating the ratio of voltage to current as a function of frequency. We defined the membrane potential resonance frequency as the (nonzero) frequency at which the neuron has the maximum of the impedance power |Z(f)|. In the Results, we refer to the impedance power as impedance.
Measurement of synaptic preferred frequency and phase.
The synapses between pyloric neurons have both spike-mediated and graded-release components (Graubard et al., 1980; Zhao et al., 2011). In this study we focused on the graded component of release, which is believed to be the dominant component in the pyloric network (Graubard et al., 1983; Hartline et al., 1988; Manor et al., 1997). The 10−7 m TTX treatment blocked the production of action potentials, leaving only graded release of neurotransmitter. We used two electrodes each to voltage clamp both the presynaptic and postsynaptic neurons. The presynaptic neurons were voltage clamped with the ZAP function at different voltage ranges, as in the measurements of the membrane potential resonance described above, and each data point reported is the average of three sweeps of the ZAP function. The postsynaptic neuron was voltage clamped at a holding potential of −40 mV, away from the synaptic reversal potential of approximately −80 mV (Goaillard et al., 2009), to record the synaptic current.
The pyloric pacemaker neurons AB and PD both inhibit the follower pyloric neurons (Fig. 1A) and, as previously described, release different neurotransmitters and have distinct synaptic output dynamics (Rabbah and Nadim, 2007). However, despite the differences between these two synapses, the follower pyloric neurons receive a combined synaptic input from these pacemaker group neurons because AB and PD are always coactive. In this study, we do not measure the AB and PD neuron synaptic outputs separately, but as a combined synaptic current in the postsynaptic LP neuron. This current is measured in response to stimulations of the presynaptic PD neuron which, as we have shown previously (Rabbah and Nadim, 2007), produces synaptic release from both the PD and the AB neurons. However, the major component of this synaptic current in the crab is from the AB neuron (D. Martinez and F. Nadim, unpublished observations). We will henceforth refer to this combined synapse as the PD to LP synapse (Fig. 1B).
Figure 1.
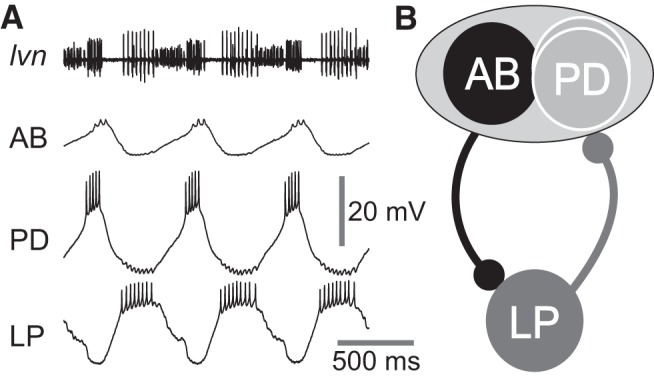
The crab pyloric network produces bursting oscillations in which the pacemaker ensemble (AB and PD neurons) oscillate in synchrony and out of phase with the follower LP neuron. A, Intracellular recordings of the pacemaker AB and PD neurons and the follower LP neuron and extracellular recording of the lateral ventricular nerve (lvn), which contains the axons of the PD and LP neurons. The lvn and PD and LP neurons were recorded simultaneously, the AB neuron was recorded separately in the same preparation together with lvn, and the traces in the figure were aligned by aligning the lvn traces in the two recordings. B, Schematic diagram of the pyloric subnetwork consisting of pacemaker AB and PD neurons, which produce reciprocally inhibitory synapses with the follower LP neuron. The synapses from the AB and PD neurons to the LP neuron are shown and treated as an ensemble synaptic connection and denoted as the PD to LP synapse. The LP to PD synapse is the sole chemical synaptic feedback from pyloric follower neurons to the pacemaker ensemble.
The frequency-dependence profiles of the synaptic current were generated in MATLAB. We discarded the precycles to avoid possible transient effects. For each oscillation cycle, the amplitude and time to peak (in reference to the peak of the presynaptic voltage) of the synaptic current and the frequency of the cycle were measured. These measurements provided plots of synaptic amplitude and synaptic peak phase versus the presynaptic oscillation frequency. Synaptic peak phase was defined as the time to peak normalized by the cycle period. The data points for the synaptic amplitude versus frequency plots were fit with a seventh degree polynomial equation and the synaptic preferred frequency was defined as the peak frequency of the fit curve.
The power of the synaptic frequency preference.
To measure how strong the synaptic current was at the preferred frequency compared with its strength at other frequencies, we used an empirical measure of the power (or kurtosis) of the synaptic profile (IPSC vs input frequency curve). This empirical measure (R) was calculated as the absolute value of the product of the chord slopes S1 and S2 of the synaptic profile, measured from the peak to both ends (at 0.1 Hz or 2 Hz; Fig. 7B, inset). Thus, if the synaptic current was larger at the peak compared with the two ends, the value of R would be higher. In contrast, when the frequency-dependent profile decreased or increased monotonically, the peak would occur at the end of the profile and either S1 or S2 (and therefore R) would be 0.
Figure 7.
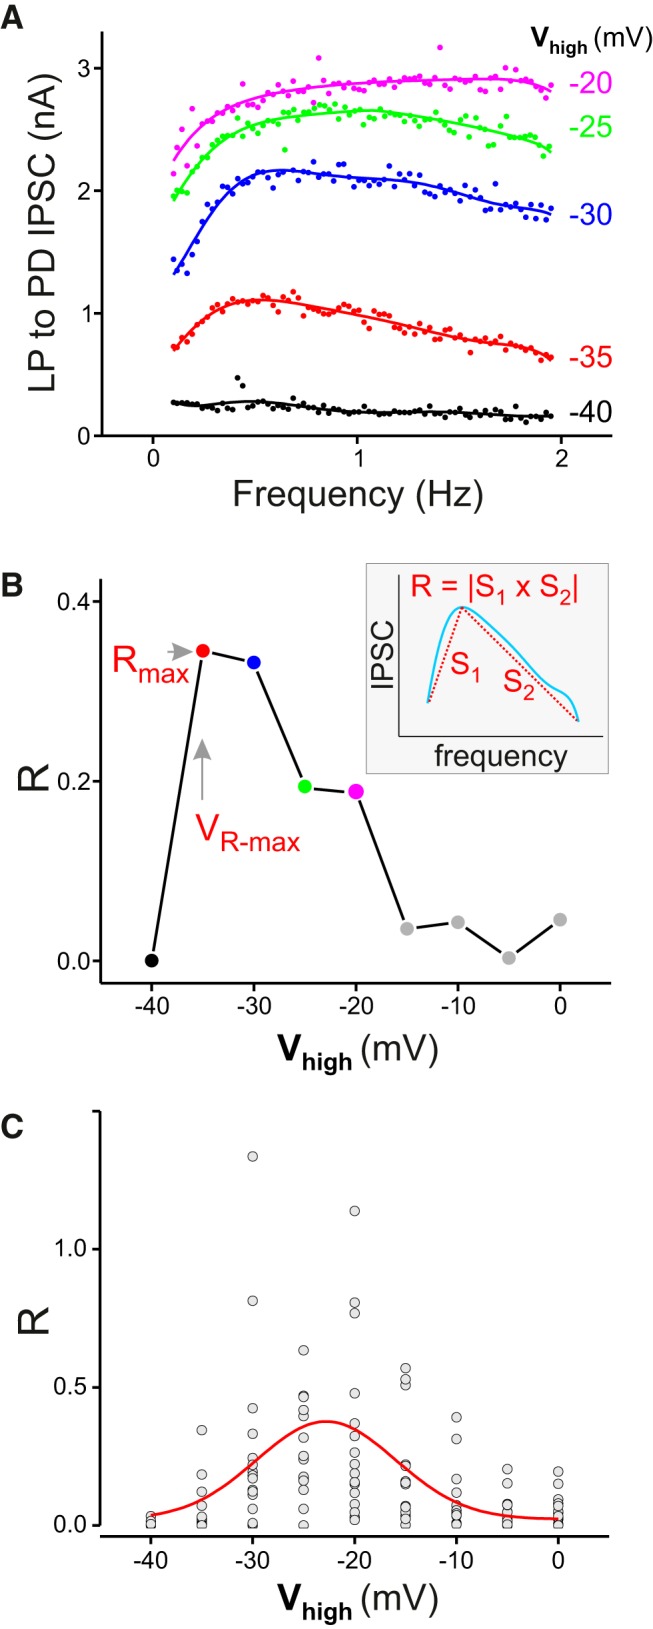
The frequency preference of the LP to PD synapse depends on the presynaptic voltage range of oscillations. A, Changing the maximum of the voltage range (Vhigh) shifted the preferred frequency and changed the amplitude of the IPSC at all frequencies. B, The kurtosis (R) of the synaptic profile depends on the value of Vhigh, with a maximum R value (Rmax) at Vhigh = VR-max. Inset, R is measured as the absolute value of the product of the chord slopes S1 and S2 of the synaptic profile, measured from the peak to both ends. C, The value of R plotted as a function of Vhigh indicates an average peak response at Vhigh ≈ −22.8 mV. Curve shows fit with a Gaussian function A/(w)exp(− 2(v − vC)/w)2); A = 6.06, w = 13.65, VC = −22.8).
Activation curve of the LP to PD synapse.
After TTX application, the presynaptic neuron was voltage clamped at −60 mV and then depolarized with a train of five pulses (duration: 500 ms; interpulse interval: 500 ms) of the same amplitude. This train was then repeated with different pulse amplitudes ranging from 10 to 50 mV, in 5 mV intervals. The postsynaptic neuron was voltage clamped at −40 mV to record the synaptic current in response to the presynaptic pulses. The peak amplitude of synaptic current during the fifth pulse (steady state) was plotted as a function of the peak voltage of the presynaptic voltage pulse. To obtain the synaptic activation curve, we measured the values of steady-state synaptic current. The resulting synaptic currents were then fit with the Boltzmann equation:
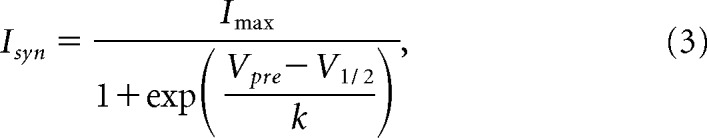 |
where Vpre is the presynaptic potential, V1/2 is the half-activation voltage. and k determines the slope of the sigmoidal fit.
Neuromodulation by proctolin.
We examined the effects of the modulatory peptide proctolin on the on V1/2 and maximum IPSC amplitude of the LP to PD synapse. Proctolin (American Peptide) was dissolved as a stock solution in distilled water and stored in aliquots of a concentration 10−3 m and frozen at −20°C. The final concentration of 10−7 m was prepared by dissolving the stock solution in Cancer saline. This concentration was specifically chosen, as proctolin at higher concentrations sometimes results in membrane voltage fluctuations even in TTX and makes voltage-clamp control of the neuron problematic. Proctolin was superfused for 30 min before clamping the neuron with the ZAP function.
Voltage range of the LP neuron and the activation curve of the LP to PD synapse during the ongoing activity.
To measure the voltage range of the LP neuron oscillation, we recorded the LP membrane potential during the ongoing pyloric rhythm activity and then applied a low-pass filter at 10 Hz cut-off frequency to remove the action potentials (Tseng and Nadim, 2010). The maximum and minimum voltages of the slow-oscillation waveforms were measured from the filtered recording.
Recording, analysis, and statistics.
Data were acquired using pClamp 9.2 (Molecular Devices) and the Scope 7.75 software developed in our laboratory, sampled at 4–5 kHz, and saved on a PC using a Digidata 1332A (Molecular Devices) and a PCI-6070-E data acquisition board (National Instruments). Statistical and graphical analyses were done using SigmaPlot 11 (Systat Software) and Origin 8.0 (OriginLab). Reported statistical significance indicated that the achieved significance level p was below the critical significance level α = 0.05. Repeated statistics on the same datasets were corrected using the Bonferroni method. Error bars shown and error values reported denote SD. All graphs in which asterisks are used for significance levels follow *p < 0.05, **p < 0.01, and ***p < 0.001.
Results
The neurons and synapses in many oscillatory networks exhibit frequency-dependent properties that potentially play important roles in shaping network activity (Markram et al., 1998; Schreiber et al., 2004; Rabbah and Nadim, 2007). Previous work has shown that the pacemaker AB and PD neurons in the pyloric network exhibit preferred frequencies and that these preferred frequencies are correlated with the frequency of network activity (Tohidi and Nadim, 2009; Tseng and Nadim, 2010). Our goal in the current study was to explore whether the follower pyloric neurons as well as the synaptic currents between pacemaker and follower neurons also exhibited preferred frequencies and, if so, whether the frequencies were similar to the preferred frequency of the pacemaker neurons and the network frequency (fnetwork). We focused on the follower neuron LP and the reciprocal synapses between the AB/PD pacemaker group and the LP neuron (Fig. 1).
The LP neuron shows membrane potential resonance
The resonance frequency of the PD neuron has been shown to be the same whether it is measured in current clamp or voltage clamp (Tseng and Nadim, 2010). However, voltage-clamp measurements allow a more precise control of the membrane potential range of the neuron, which may influence the resonance frequency. We measured the LP neuron impedance profile by voltage clamping the neuron with a ZAP function sweeping a frequency range of 0.1–4 Hz and a voltage range from −60 to −30 mV (Fig. 2A). A calculation of the impedance profile showed that the follower LP neuron exhibits a resonance frequency fmax-LP = 1.42 ± 0.42 Hz (N = 27).
Figure 2.

The follower LP neuron shows membrane potential resonance. A, The LP neuron was voltage clamped with a ZAP waveform spanning a voltage range of −60 to −30 mV and a frequency of 0.1–4 Hz. Vertical arrow shows the minimum current indicating a peak in the membrane impedance (resonance). Horizontal arrows mark −60 mV or 0 nA. B, A shift in the maximum value of the voltage range (B1) causes a shift in the peak of the impedance profile, i.e., a shift in the LP neuron resonance frequency (fmax-LP). In contrast, a shift in the minimum of the voltage range (B2) does not influence fmax-LP. C, Average data showing that fmax-LP shifts with the maximum (C1) but not the minimum (C2) voltage value (N = 12 experiments).
The voltage range of the bursting oscillations of the LP neuron depends on the modulatory state of the network as well as the strength of the synaptic input it receives from the pacemaker neurons (Rabbah and Nadim, 2007; Taylor et al., 2009). Our previous work had shown that the membrane potential resonance frequency in the PD neuron depends on the maximum and minimum voltage range (Tseng and Nadim, 2010). To see if fmax-LP is also sensitive to the LP waveform voltage range, we shifted the maximum or minimum of this voltage range (Vhigh and Vlow) and measured the impedance profile. From the initial value, we shifted Vhigh by ±4 mV (to −34, −30, and −26 mV; Fig. 2B1) or, alternatively, we shifted Vlow by ±10 mV (−70, −60, and −50 mV; Fig. 2B2). We found that, similar to our previous findings for the PD neuron (Tseng and Nadim, 2010), changing the maximum voltage range significantly shifted fmax-LP in the same direction (N = 12; one-way ANOVA; p < 0.001; Fig. 2C1). However, in contrast to the findings for the PD neuron, shifting the minimum of the voltage range had no effect on fmax-LP (N = 15; one-way ANOVA, p = 0.44; Fig. 2C2).
The synapses between the pacemaker AB/PD neurons and the follower LP neuron have preferred frequencies for amplitude and phase
We examined the frequency dependence of the combined synapse from the pacemaker neurons to the LP neuron (the PD to LP synapse; Rabbah and Nadim, 2007) as well as the feedback synapse from the LP to the PD neuron. The presynaptic neuron was voltage clamped with a ZAP function and the postsynaptic neuron was voltage clamped at a holding potential of −40 mV to measure the IPSC (Fig. 3A). By measuring the amplitude of synaptic current in each cycle as a function of the cycle frequency, a frequency-dependent profile of the IPSC was generated (Fig. 3B1,B2). The profiles showed that, as the frequency of presynaptic oscillation was increased, the synaptic current first increased and then decreased both in the PD to LP synapse (Fig. 3B1) and in the LP to PD synapse (Fig. 3B2). As a result, there was a unique preferred frequency (fmax) at which the synaptic current reached its peak value (vertical arrows in Fig. 3A1,A2, bottom traces, B1,B2). These results, together with our previously published data (Tohidi and Nadim, 2009), show that both PD and LP neurons show membrane potential resonance, and the reciprocal synapses between the two also exhibit preferred frequencies. The PD to LP synapse had an fmax of 0.49 ± 0.11 Hz and the LP to PD synapse had an fmax of 0.70 ± 0.13 Hz (N = 16 each; statistical comparisons for frequencies are provided in the following section). Additionally, the peak amplitude of the LP to PD IPSC was significantly larger at the preferred frequency than that of the PD to LP synapse (Fig. 3B2, inset; N = 16, Bonferroni-corrected paired Student's t test, p = 0.003).
Figure 3.

Both the PD to LP and the LP to PD synapse have preferred frequencies at which the synaptic efficacy is maximal. A, Measurement of the postsynaptic current while the presynaptic neuron was voltage clamped with a ZAP waveform as in Figure 2A shows that the postsynaptic neuron (LP in A1, PD in A2) had an IPSC that is maximal at one frequency (vertical arrow in bottom trace). This frequency was always at a lower frequency than the presynaptic resonance frequency (vertical arrow in middle trace). Horizontal arrows mark −60 mV or 0 nA. B, The peak amplitude of the IPSC (PD to LP in B1, LP to PD in B2) is shown as a function of the presynaptic waveform frequency in each cycle. A polynomial fit of this graph was used to determine the synaptic preferred frequency. The peak IPSC amplitude was significantly higher for the LP to PD synapse compared with the PD to LP synapse (B2 inset; N = 16). C, Sample trace showing that the IPSC peaked at a different phase (Δt/period) depending on the presynaptic period. Two cycles from A1 are superimposed to show the change in the relative peak of the IPSC. D, The peak phase of both synapses shows a significant increase as a function of the presynaptic frequency. Additionally, the PD to LP synapse has a later peak phase compared with the LP to PD synapse at all frequencies above 0.5 Hz (N = 16; two-way ANOVA with post hoc Tukey analysis). The vertical arrows mark the frequencies shown in C with the corresponding color.
Another frequency-dependent attribute of synapses is the peak phase of the synaptic current (Fig. 3C; also see Materials and Methods). For both synapses, the peak phase was negative at low frequencies and positive at high frequencies, indicating that the synapse peaked before (after) the presynaptic voltage at low (high) frequencies (Fig. 3D). We also found that the PD to LP synapse had a significantly higher peak phase than the LP to PD synapse at all frequencies >0.5 Hz (N = 16; two-way ANOVA with post hoc Tukey analysis).
The relationship between membrane potential resonance frequencies and the synaptic preferred frequencies
The pyloric network is normally active with a regular oscillation cycle frequency of ∼1 Hz (as seen in the out-of-phase activities between the AB/PD and LP neurons; Fig. 1A). Our previous results have shown a close relationship between the PD resonance frequency and the pyloric cycle frequency (Tohidi and Nadim, 2009). We were interested in determining whether the membrane potential resonance frequency of the pacemaker PD neuron is similar to that of the follower LP neuron, and also whether either of these frequencies is close to the preferred frequencies of their reciprocal pyloric synapses. To address this point, we measured all five frequencies simultaneously in the same preparation (Fig. 4A). We found that the preferred frequencies of the synapses were not significantly different, but were significantly lower than the network cycle frequency and also lower than the resonance frequency of the respective presynaptic neuron (Figs. 3A1, A2, arrows, 4A; N = 16, one-way RM-ANOVA with post hoc Tukey analysis). Although the membrane potential resonance frequency of the LP neuron was significantly higher than that of the PD neuron, neither was significantly different from the network cycle frequency.
Figure 4.
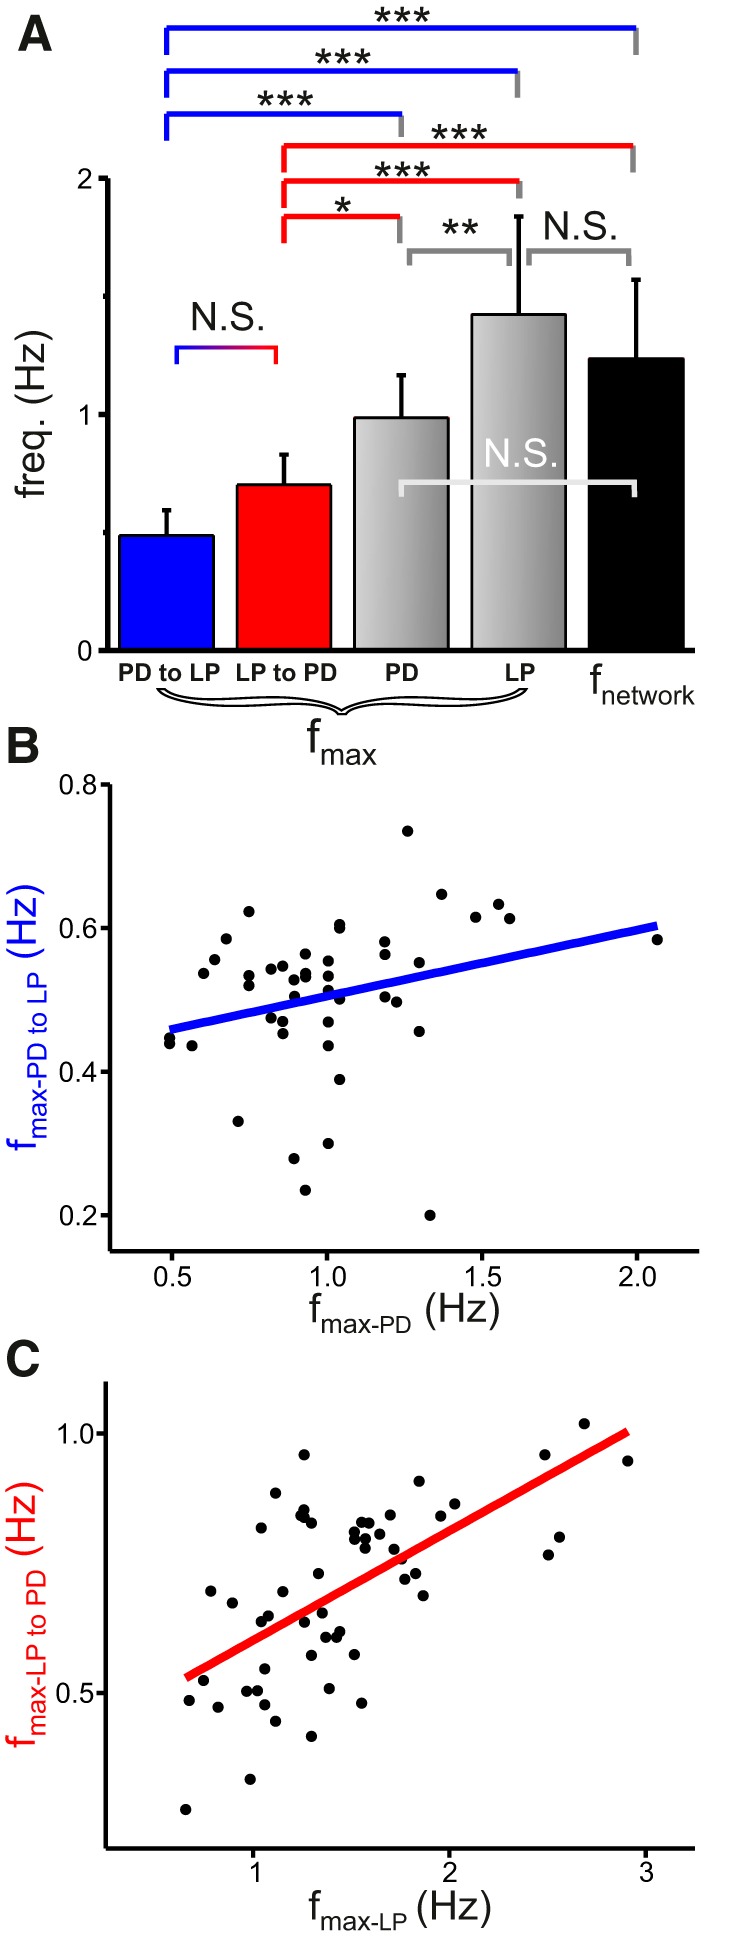
The preferred frequencies of the synapses between the LP and PD neurons are different from the membrane potential resonance frequencies of these neurons. A, Both the LP to PD and the PD to LP synapses showed a lower preferred frequency (fmax) than the resonance frequency of LP or PD and the network oscillation frequency. Additionally, the membrane potential resonance frequency was significantly higher in LP than in PD (N = 16, one-way RM-ANOVA with post hoc Tukey analysis). B, C, The fmax of the PD to LP synapse was not significantly correlated with the fmax of the PD neuron (B; Pearson Product Moment, r = 0.26, p = 0.08). In contrast, the fmax of the LP to PD synapse was positively correlated with the fmax of the presynaptic LP neuron (C; N = 54; Pearson Product Moment, r = 0.63, p < 0.001).
So far, we have shown that the LP and PD neurons and the synapses between them have preferred frequencies and the preferred frequencies of the synapses are lower than those of the presynaptic neurons. Both the resonance frequency and the synaptic IPSCs were measured by enforcing an oscillatory activity (ZAP) on the presynaptic neuron, while the postsynaptic neuron was voltage clamped at a fixed holding potential of −40 mV. It is therefore possible that the frequency preference (resonance) of the presynaptic neuron directly or indirectly influences the synaptic preferred frequency. To examine this possibility, we tested for correlations between the preferred frequencies of the presynaptic neurons and those of the synapses. The PD to LP synaptic fmax showed no significant correlation with the fmax of the presynaptic PD neuron (Fig. 4B; N = 45; Pearson Product Moment, r = 0.26, p = 0.08). In contrast, the fmax of the LP to PD synapse was positively correlated with the fmax of the presynaptic LP neuron (Fig. 4C; N = 54; Pearson Product Moment, r = 0.63, p < 0.001).
We also examined whether there were other correlations present between the fmax values of the PD and LP neurons and the fmax values of the synapses and fnetwork. These data involved 29 experiments and examined other paired combinations of the fmax and fnetwork values. Although in some cases, positive or negative trends were present, in none of the comparisons (other than fmax-LP vs fmax-LP to PD, reported above) there were any correlations that were statistically significant. These data are not shown.
The dependence of synaptic preferred frequencies on the voltage range of the presynaptic neuron
The strength of the synapses in the pyloric network is dependent on the presynaptic membrane potential (Rabbah and Nadim, 2007; Zhao et al., 2011). We were therefore interested to know how different voltage ranges of presynaptic oscillations affect the preferred frequencies of the synaptic currents. To address this question, we shifted the Vhigh of the ZAP function in the voltage clamped presynaptic neuron to different levels while keeping the Vlow at a fixed initial value or vice versa. For the PD to LP synapse, the frequency profiles of the synaptic current peaked at a similar frequency in all voltage ranges imposed on the PD neuron (Fig. 5A1,B1). Shifting the maximum values of the presynaptic oscillation had no significant effect on the synaptic fmax (Fig. 5A2; N = 11; one-way ANOVA, p = 0.700). Similarly, shifting the minimum did not affect the synaptic fmax either (Fig. 5B2; N = 10; one-way ANOVA, p = 0.191). In these experiments, we imposed the ZAP function in the voltage clamped PD neurons; however, the major component of the PD to LP synaptic current in crab is from the AB neuron (Martinez and Nadim, unpublished observations). It was therefore possible that the difference of ±4 mV in the Vhigh of the PD oscillation resulted in a smaller voltage shift in the AB neuron and hence did not affect the fmax. To test this possibility, we shifted the Vhigh of the PD oscillation to −30, −25, −20, and −15 mV. Even with the larger voltage shifts, we found that the fmax of the PD to LP synapse was not significantly different even when the maximum was varied in this larger range (data not shown; N = 5; one-way ANOVA, p = 0.68). We also examined the effects of shifting Vhigh and Vlow on the peak phase of the PD to LP synapse and found no significant dependence of the peak phase on either (Fig. 5A3,B3; two-way ANOVA, no significant effect of voltage range).
Figure 5.

The preferred frequency and peak phase of the PD to LP synapse are insensitive to the limits of the presynaptic voltage range. A1, Changing the maximum of the voltage range (Vhigh) had no influence on the preferred frequency of the PD to LP synapse. Curves are polynomial fits. A2, Aggregate data (N = 11; one-way ANOVA, p = 0.700). A3, The peak phase (Fig. 3C) of the PD to LP synapse is insensitive to changes in Vhigh (two-way ANOVA, no significant effect of voltage range). B1, Changing the minimum of the voltage range (Vlow) had no influence on the preferred frequency of the PD to LP synapse. Curves are polynomial fits. B2, Aggregate data (N = 10; one-way ANOVA, p = 0.191). B3, The peak phase of the PD to LP synapse is insensitive to changes in Vlow (two-way ANOVA, no significant effect of voltage range).
In contrast to the PD to LP synapse, the fmax of the LP to PD synapse responded differently to changes in the voltage range of the presynaptic LP neuron. When the Vhigh of the ZAP voltage range in the voltage clamped LP neuron was moved to a more depolarized level, the profile of the synaptic current peaked at a higher frequency (Fig. 6A1). Therefore, shifting the Vhigh higher increased fmax (Fig. 6A2; N = 9, one-way ANOVA, p < 0.001). However, changing the Vlow of the LP oscillation did not have any effect on the peak of the frequency profile (Fig. 6B1) and different Vlow values had no significant effect on fmax (Fig. 6B2; n = 10, one-way ANOVA, p = 0.75). Shifting Vhigh of the LP oscillation did have an effect on the peak phase of the LP to PD synapse at frequencies between 0.1 and 2 Hz but not at higher frequencies (Fig. 6A3; two-way ANOVA with post hoc Tukey analysis, p < 0.05 for the effect of voltage range for f < 2 Hz). There was no significant shift in the peak phase of this synapse when Vlow of the LP oscillations was changed (Fig. 6B3; two-way ANOVA, no significant effect of voltage range).
Figure 6.

The preferred frequency and peak phase of the LP to PD synapse are sensitive to the maximum limit, but not the minimum of the presynaptic voltage range. A1, Increasing the maximum of the voltage range (Vhigh) increased the preferred frequency of the LP to PD synapse. Curves are polynomial fits. A2, Aggregate data (N = 9; one-way ANOVA, p < 0.001). A3, The peak phase (Fig. 3C) of the LP to PD synapse is delayed for frequencies < 2 Hz, when Vhigh is increased (two-way ANOVA with post hoc Tukey analysis, p < 0.05 for the effect of voltage range for f < 2 Hz). B1, Changing the minimum of the voltage range (Vlow) had no influence on the preferred frequency of the LP to PD synapse. Curves are polynomial fits. B2, Aggregate data (N = 10; one-way ANOVA, p = 0.75). B3, The peak phase of the LP to PD synapse is insensitive to changes in Vlow (two-way ANOVA, no significant effect of voltage range).
Frequency preference of the LP to PD synapse depends on the dynamic voltage range of the presynaptic neuron
We have shown that the LP to PD synapse fmax is sensitive to the presynaptic voltage range and only to changes in the upper limit of this voltage range. In contrast, the PD to LP synapse shows little sensitivity to the presynaptic voltage range. To further explore the voltage dependence of the LP to PD synapse, we examined its frequency dependence by changing the Vhigh of the presynaptic ZAP function in a larger range, from −40 to 0 mV, in 5 mV intervals. In these experiments, to provide a better frequency resolution, we narrowed the frequency range to between 0.1 and 2 Hz. The examples of the IPSC versus frequency profiles are shown in Figure 7A. When Vhigh was at −40 mV, there was usually little synaptic current and the synaptic profile was flat (Fig. 7A, black). When Vhigh was increased to −35 mV, the synaptic current profile showed a preferred frequency (Fig. 7A, red), which persisted as Vhigh was increased to −30 mV (Fig. 7A, blue). However, as Vhigh was increased to even higher values, the peak in the synaptic profile was gradually lost (Fig. 7A; −25 mV, green; −20 mV, magenta). Because the frequency-dependent profiles of the synaptic current changed drastically as Vhigh was shifted from −40 to 0 mV, we used a simple empirical measure to quantify the power (or kurtosis: R) of the synaptic profile. We found that the value of R is dependent on the presynaptic Vhigh (Fig. 7B): when Vhigh was increased, R first increased and then decreased and, in each experiment, there existed a value of Vhigh (referred to as VR-max) for which the synaptic profile showed the highest kurtosis (VR-max = −35 mV for the example shown in Fig. 7B, arrow). Overall, the R values showed a normal distribution as a function of Vhigh with a peak of ∼0.35 at −22.8 mV, indicating the average value of VR-max (Fig. 7C).
Neuromodulation of the LP to PD synapse preferred frequency by the neuropeptide proctolin
Our analysis of the LP to PD synapse showed that the value of VR-max was different across different preparations. This raised the possibility that these differences are due to the differences in the voltage dependence of the synapse across preparations (Zhao et al., 2011). Both the LP to PD and the PD to LP synapse measured in this study are graded synapses and therefore their voltage dependence can be represented by the (sigmoidal) activation curve of the synaptic current (Zhao et al., 2011). We hypothesized that the value of R would be highest when the synapse was in its dynamic range, i.e., around the midpoint (V½) of the sigmoidal activation curve. In a previous study, we have also shown that the V½ of the LP to PD synapse is shifted by ∼10 mV to the left by the neuromodulatory peptide proctolin (Zhao et al., 2011; Oh et al., 2012). Our hypothesis therefore led to two predictions: first, that the value of VR-max is correlated with V½ and, second, that by shifting the value of V½, proctolin would also shift VR-max to the left and preserve this correlation. To test these predictions, we compared the relationship of VR-max with the synaptic activation curve by measuring both attributes in each preparation. We did this by applying presynaptic ZAP functions with different Vhigh values as well as trains of voltage pulses with different amplitudes (see Materials and Methods).
We found that the neuromodulator proctolin increases the value of R for the LP to PD synapse. The maximal R value increased drastically with proctolin treatment (Fig. 8A), on average by 565% (N = 13; paired Student's t test, p = 0.002; control: 0.38 ± 0.36, proctolin: 2.14 ± 2.14; Fig. 8B, inset). As predicted by our hypothesis, the mean value of VR-max also shifted to lower voltages (from −22.8 ± 1.0 mV in control to −30.3 ± 1.0 mV in proctolin; Fig. 8B).
Figure 8.

Neuromodulation of the LP to PD synapse by proctolin affects its frequency preference. A, The neuromodulator proctolin increased Rmax and shifted VR-max (Fig. 7B) to more negative values. B, Aggregate data as in A shows that the mean value of VR-max shifted from −22.8 ± 1.0 mV in control to −30.3 ± 1.0 mV in proctolin. Curves show Gaussian function fits. Inset shows a significant increase in Rmax values in proctolin (paired Student's t test, p = 0.002). C, Proctolin shifted the half-activation voltage (V½) of the LP to PD synaptic current to more hyperpolarized values. Curves show sigmoidal fits to maximum IPSC values obtained at different presynaptic voltage pulses. D, There was a positive correlation between V½ and VR-max (N = 13; Pearson Product Moment, r = 0.50, p = 0.009). E, The aggregate values of the IPSC amplitudes show that the V½ of the synaptic activation falls within the range of LP slow wave oscillations. The green bar shows the natural range of the slow-wave oscillations of the LP neuron during the ongoing rhythm (N = 13). Inset, Slow waves obtained by low-pass filtering the LP ongoing voltage waveform at 10 Hz.
Proctolin treatment also enhanced the level of membrane potential resonance in the LP neuron: there was a 57% larger impedance value at the resonance frequency compared with control (voltage range: −60 to −30 mV; N = 13; paired Student's t test, p = 0.002; control: 9.88 ± 3.34 MΩ, proctolin: 15.50 ± 4.64 MΩ) but the resonance frequency was, on average, unchanged (paired Student's t test, p > 0.5).
Consistent with published results (Zhao et al., 2011), proctolin enhanced the synaptic strength and shifted the half-activation voltage (V½) of the LP to PD synaptic current to more hyperpolarized values (Fig. 8C). Furthermore, in the aggregate data from control and proctolin experiments, there was a correlation between V½ and VR-max (N = 13; Pearson Product Moment, r = 0.50, p = 0.009; Fig. 8D). In N = 3 experiments, proctolin had no effect on the half-activation voltage, and the voltage of maximum producing the strongest effect was the same as control, which was consistent with our hypothesis (data not shown).
These results indicated that the LP to PD synaptic current exhibited a preferred frequency only when the Vhigh of the presynaptic neuron was near the value of V½, i.e., in the dynamic range of the synaptic activation curve (Fig. 8A). We therefore examined whether, during the ongoing pyloric activity, the Vhigh of the LP neuron oscillation fell within this range. To determine this, we recorded the LP membrane potential during the ongoing pyloric activity (Fig. 8E, inset, gray trace) and low-pass filtered the recording to generate the slow waveform of the LP neuron (Fig. 8E, inset, green trace). The voltage ranges of the slow waveform were measured and the Vhigh values of the slow waveforms were compared with the V½ of the LP to PD synaptic current. These results showed that the voltage range of the LP slow waveform was indeed within the dynamic range of the synaptic current, indicating the synaptic preferred frequency likely exists in the pyloric network under the naturally ongoing rhythm (Fig. 8E).
Discussion
Oscillatory networks are composed of a variety of neuron types that interact through recurrent synaptic connections. In many oscillatory systems, individual neuron types have preferred frequencies at which they respond maximally to oscillatory inputs, a property known as membrane potential resonance (Hutcheon and Yarom, 2000). Additionally, most synapses show frequency-dependent dynamics due to short-term plasticity (Nadim and Bucher, 2014) and, in some cases, respond with maximal efficacy to presynaptic activity at a preferred frequency (Izhikevich et al., 2003). A large number of studies have shown that the resonance frequency of network neurons is correlated or associated with the network oscillation frequency (Lampl and Yarom, 1997; Leung and Yu, 1998; D'Angelo et al., 2001; Tohidi and Nadim, 2009; Lau and Zochowski, 2011). In some cases, membrane resonance in the same system can arise from distinct mechanisms (Hu et al., 2009) and, in the hippocampus, different neuron types have been shown to have different resonance properties (Pike et al., 2000), presumably allowing for their participation in different frequency bands. However, in almost all cases, the network frequency is reported as a range of values and it is not known whether the neurons and synapses that are directly involved in oscillatory activity at a given frequency also have a matching or similar preferred frequency. We examined this hypothesis in the crab pyloric network, which produces stable oscillations and where the identified neurons allow for measuring the preferred frequency values in the same cells and synapses across preparations.
Membrane potential resonance of a follower neuron
We have previously shown that the pyloric pacemaker neurons AB and PD show membrane potential resonance whose frequency (fmax) is correlated with the pyloric network frequency (fnetwork; Tohidi and Nadim, 2009). Here we found that the LP neuron, which is not an endogenous oscillator, also shows membrane potential resonance. However, contrary to our hypothesis, fmax-LP was significantly higher than fmax-PD, showing that different neuron types in this network have distinct membrane potential resonance. The value of fnetwork fell between these two fmax values, possibly due to the combined influence of resonance properties of both neuron types. Consistent with this finding, the high fmax-LP can promote network stability: if fnetwork increases, LP can show a stronger response which, in turn, increases its feedback inhibition to the pacemakers and slows down the rhythm, as suggested in previous studies (Mamiya and Nadim, 2004; Thirumalai et al., 2006; Nadim et al., 2011). We also found that the neuromodulator proctolin enhances the impedance of the LP neuron at fmax-LP without altering fmax-LP. As a result, the effect of the LP to PD feedback inhibition is enhanced by proctolin, both because of the effect of proctolin on the LP neuron resonance and because proctolin directly enhances the synaptic strength (Zhao et al., 2011).
In a previous study we showed that fmax-PD is sensitive to its voltage range (Vlow to Vhigh): inputs that increase either Vlow or Vhigh of the oscillation also increase fmax-PD (Tseng and Nadim, 2010). Unlike the PD neurons, however, fmax-LP is only sensitive to changes in Vhigh (Fig. 2). This difference in sensitivity to voltage range in the two neuron types has two implications. First, it suggests that the mechanism underlying resonance may be different in the PD and LP neurons. Although in this study we do not attempt to explore the underlying mechanism for membrane potential resonance, we have previously shown that resonance in PD neurons depends on the hyperpolarization-activated inward current Ih (Tohidi and Nadim, 2009), which is known to produce resonance (Schreiber et al., 2004; Haas et al., 2007). The insensitivity of fmax-LP to Vlow may, for example, indicate a weaker dependence on Ih. The second implication is functional: the LP neuron oscillates because of a strong, periodic synaptic inhibition it receives from the pacemakers. The insensitivity of fmax-LP to Vlow suggests that the response of the LP neuron to this synaptic input is mostly independent of the strength of this synaptic input.
Synaptic preferred frequencies and frequency-phase relationships
In most synapses, repeated presynaptic activity facilitates or depresses the amplitude of the postsynaptic current and the size of this change depends on the presynaptic frequency (Zucker and Regehr, 2002; Mamiya and Nadim, 2005). Synaptic preferred frequencies can arise as a combination of depression and facilitation (Markram et al., 1998; Izhikevich et al., 2003), although the significance of having a synaptic preferred frequency in the context of network operation is unclear (for review, see Oh et al., 2010). Our results show that both the LP to PD and the PD to LP synapses have preferred frequencies that are at the lower limits of the typical pyloric fnetwork of 0.5–2.5 Hz. Consequently, in an ongoing pyloric rhythm, these synapses act in their dynamic range of frequencies and exhibit depression, consistent with previous studies (Mamiya and Nadim, 2005; Rabbah and Nadim, 2007; Zhao et al., 2011). The PD to LP synapse primarily acts to produce bursting oscillations in the LP neuron, which is not an endogenous oscillator. Furthermore, pyloric follower neurons such as LP maintain a constant activity phase, despite variations in frequency, both in individual animals and across different animals (Hooper, 1997; Bucher et al., 2005; Goaillard et al., 2009). Synaptic depression implies that the amplitude of the synapses decreases as a function of frequency, which is consistent with the role of the PD to LP synapse in phase maintenance (Manor et al., 2003; Bose et al., 2004; Mouser et al., 2008). Also, consistent with our findings here, in a recent theoretical study we found that phase constancy in a two-cell inhibitory network requires the network frequency to be different from the synaptic preferred frequency (Akcay et al., 2014).
The peak phase of both synapses also showed significant frequency dependence, which was distinct for the PD to LP and the LP to PD synapses (Fig. 3). Periodic inhibitory synaptic input to an oscillatory neuron can slow down or speed up the oscillation depending on the oscillator phase-resetting curve and the amplitude and phase of the synaptic input (Nadim et al., 2011). The LP to PD synapse is the sole inhibitory feedback to the pyloric pacemaker group and is known to stabilize the pyloric period (Nadim et al., 2011). The phase of the LP to PD synapse can be more effective than its strength in influencing fnetwork (Prinz et al., 2003) and, if the synapse has a later peak phase, it is more effective at slowing down the rhythm (Mamiya and Nadim, 2004), again consistent with our findings here (Fig. 3D).
In contrast, as mentioned above, the PD to LP synapse plays an important role in maintaining the proper activity phase of the LP neuron and the higher peak phase of this synapse may be important in acting synergistically with the intrinsic voltage-gated ionic currents of the LP neuron, such as Ih and the transient potassium current IA, to promote phase maintenance (Bose et al., 2004). Such a synergistic relationship requires a balance in the strength and kinetics of these voltage-gated ionic currents with the strength and phase of the synaptic input at different frequencies, which can be precisely described using computational models of the LP neuron (Taylor et al., 2009).
Correlation between the activation curve of a graded synapse and its preferred frequency
Only in the LP to PD synapse, but not the PD to LP synapse, did the frequency preference have a dynamic dependence on the presynaptic voltage amplitude (Figs. 5, 6). It is possible that the differences in the dynamics of these two synapses are due to distinct calcium current kinetics and voltage dependence in the presynaptic neurons. Such a difference is also consistent with the presence of a spike-mediated component in the LP to PD synapse (Zhao et al., 2011), which contrasts with the purely graded nature of the PD to LP synapse (Rabbah and Nadim, 2007), indicating that the former synapse also depends on high voltage-activated calcium currents (Ivanov and Calabrese, 2006). Interestingly, the Vhigh value of the LP waveform strongly influences the power R of the LP to PD synapse frequency preference. The maximum R occurs at Vhigh values (VR-max), which are correlated with the activation curve midpoint (V½) of the synapse and both VR-max and V½ shift to lower voltages in the presence of the modulator proctolin. Such a shift could be a way for proctolin to modulate the network activity by changing the dynamic properties of this synapse.
Conclusions
We used identified neurons of the crab pyloric network to show that the neurons and synapses in an oscillatory network can have distinct preferred frequencies. Our findings demonstrate that, even when network oscillations occur at a stable frequency, this frequency is not necessarily the consequence of coincident preferred frequencies of the network components, but may arise from a dynamic interaction between the frequency-dependent properties of these components. Furthermore, the frequency preferences of the components may be distinct targets of neuromodulation, thus resulting in a flexible range of network outputs.
Footnotes
This study was supported by National Institutes of Health Grant MH060605 and National Science Foundation Grant DMS1122291.
The authors declare no competing financial interests.
References
- Abbott LF, Regehr WG. Synaptic computation. Nature. 2004;431:796–803. doi: 10.1038/nature03010. [DOI] [PubMed] [Google Scholar]
- Akcay Z, Bose A, Nadim F. Effects of synaptic plasticity on phase and period locking in a network of two oscillatory neurons. J Math Neurosci. 2014;4:8. doi: 10.1186/2190-8567-4-8. [DOI] [PMC free article] [PubMed] [Google Scholar]
- Bao J, Reim K, Sakaba T. Target-dependent feedforward inhibition mediated by short-term synaptic plasticity in the cerebellum. J Neurosci. 2010;30:8171–8179. doi: 10.1523/JNEUROSCI.0276-10.2010. [DOI] [PMC free article] [PubMed] [Google Scholar]
- Blackman AV, Abrahamsson T, Costa RP, Lalanne T, Sjöström PJ. Target-cell-specific short-term plasticity in local circuits. Front Synaptic Neurosci. 2013;5:11. doi: 10.3389/fnsyn.2013.00011. [DOI] [PMC free article] [PubMed] [Google Scholar]
- Bose A, Manor Y, Nadim F. The activity phase of postsynaptic neurons in a simplified rhythmic network. J Comput Neurosci. 2004;17:245–261. doi: 10.1023/B:JCNS.0000037685.71759.1a. [DOI] [PubMed] [Google Scholar]
- Bucher D, Prinz AA, Marder E. Animal-to-animal variability in motor pattern production in adults and during growth. J Neurosci. 2005;25:1611–1619. doi: 10.1523/JNEUROSCI.3679-04.2005. [DOI] [PMC free article] [PubMed] [Google Scholar]
- D'Angelo E, Nieus T, Maffei A, Armano S, Rossi P, Taglietti V, Fontana A, Naldi G. Theta-frequency bursting and resonance in cerebellar granule cells: experimental evidence and modeling of a slow k+-dependent mechanism. J Neurosci. 2001;21:759–770. doi: 10.1523/JNEUROSCI.21-03-00759.2001. [DOI] [PMC free article] [PubMed] [Google Scholar]
- Drover JD, Tohidi V, Bose A, Nadim F. Combining synaptic and cellular resonance in a feed-forward neuronal network. Neurocomputing. 2007;70:2041–2045. doi: 10.1016/j.neucom.2006.10.135. [DOI] [PMC free article] [PubMed] [Google Scholar]
- Fioravante D, Regehr WG. Short-term forms of presynaptic plasticity. Curr Opin Neurobiol. 2011;21:269–274. doi: 10.1016/j.conb.2011.02.003. [DOI] [PMC free article] [PubMed] [Google Scholar]
- Fortune ES, Rose GJ. Short-term synaptic plasticity as a temporal filter. Trends Neurosci. 2001;24:381–385. doi: 10.1016/S0166-2236(00)01835-X. [DOI] [PubMed] [Google Scholar]
- Goaillard JM, Taylor AL, Schulz DJ, Marder E. Functional consequences of animal-to-animal variation in circuit parameters. Nat Neurosci. 2009;12:1424–1430. doi: 10.1038/nn.2404. [DOI] [PMC free article] [PubMed] [Google Scholar]
- Graubard K, Raper JA, Hartline DK. Graded synaptic transmission between spiking neurons. Proc Natl Acad Sci U S A. 1980;77:3733–3735. doi: 10.1073/pnas.77.6.3733. [DOI] [PMC free article] [PubMed] [Google Scholar]
- Graubard K, Raper JA, Hartline DK. Graded synaptic transmission between identified spiking neurons. J Neurophysiol. 1983;50:508–521. doi: 10.1152/jn.1983.50.2.508. [DOI] [PubMed] [Google Scholar]
- Haas JS, Dorval AD, 2nd, White JA. Contributions of Ih to feature selectivity in layer II stellate cells of the entorhinal cortex. J Comput Neurosci. 2007;22:161–171. doi: 10.1007/s10827-006-0005-7. [DOI] [PubMed] [Google Scholar]
- Hartline DK, Russell DF, Raper JA, Graubard K. Special cellular and synaptic mechanisms in motor pattern generation. Comp Biochem Physiol C. 1988;91:115–131. doi: 10.1016/0742-8413(88)90177-6. [DOI] [PubMed] [Google Scholar]
- Hooper SL. Phase maintenance in the pyloric pattern of the lobster (Panulirus interruptus) stomatogastric ganglion. J Comput Neurosci. 1997;4:191–205. doi: 10.1023/A:1008822218061. [DOI] [PubMed] [Google Scholar]
- Hu H, Vervaeke K, Graham LJ, Storm JF. Complementary theta resonance filtering by two spatially segregated mechanisms in CA1 hippocampal pyramidal neurons. J Neurosci. 2009;29:14472–14483. doi: 10.1523/JNEUROSCI.0187-09.2009. [DOI] [PMC free article] [PubMed] [Google Scholar]
- Hutcheon B, Yarom Y. Resonance, oscillation and the intrinsic frequency preferences of neurons. Trends Neurosci. 2000;23:216–222. doi: 10.1016/S0166-2236(00)01547-2. [DOI] [PubMed] [Google Scholar]
- Ivanov AI, Calabrese RL. Spike-mediated and graded inhibitory synaptic transmission between leech interneurons: evidence for shared release sites. J Neurophysiol. 2006;96:235–251. doi: 10.1152/jn.01094.2005. [DOI] [PubMed] [Google Scholar]
- Izhikevich EM, Desai NS, Walcott EC, Hoppensteadt FC. Bursts as a unit of neural information: selective communication via resonance. Trends Neurosci. 2003;26:161–167. doi: 10.1016/S0166-2236(03)00034-1. [DOI] [PubMed] [Google Scholar]
- Klug A, Borst JG, Carlson BA, Kopp-Scheinpflug C, Klyachko VA, Xu-Friedman MA. How do short-term changes at synapses fine-tune information processing? J Neurosci. 2012;32:14058–14063. doi: 10.1523/JNEUROSCI.3348-12.2012. [DOI] [PMC free article] [PubMed] [Google Scholar]
- Lampl I, Yarom Y. Subthreshold oscillations and resonant behavior: two manifestations of the same mechanism. Neuroscience. 1997;78:325–341. doi: 10.1016/S0306-4522(96)00588-X. [DOI] [PubMed] [Google Scholar]
- Lau T, Zochowski M. The resonance frequency shift, pattern formation, and dynamical network reorganization via sub-threshold input. PLoS One. 2011;6:e18983. doi: 10.1371/journal.pone.0018983. [DOI] [PMC free article] [PubMed] [Google Scholar]
- Ledoux E, Brunel N. Dynamics of networks of excitatory and inhibitory neurons in response to time-dependent inputs. Front Comput Neurosci. 2011;5:25. doi: 10.3389/fncom.2011.00025. [DOI] [PMC free article] [PubMed] [Google Scholar]
- Leung LS, Yu HW. Theta-frequency resonance in hippocampal CA1 neurons in vitro demonstrated by sinusoidal current injection. J Neurophysiol. 1998;79:1592–1596. doi: 10.1152/jn.1998.79.3.1592. [DOI] [PubMed] [Google Scholar]
- Mamiya A, Nadim F. Dynamic interaction of oscillatory neurons coupled with reciprocally inhibitory synapses acts to stabilize the rhythm period. J Neurosci. 2004;24:5140–5150. doi: 10.1523/JNEUROSCI.0482-04.2004. [DOI] [PMC free article] [PubMed] [Google Scholar]
- Mamiya A, Nadim F. Target-specific short-term dynamics are important for the function of synapses in an oscillatory neural network. J Neurophysiol. 2005;94:2590–2602. doi: 10.1152/jn.00110.2005. [DOI] [PubMed] [Google Scholar]
- Manor Y, Nadim F, Abbott LF, Marder E. Temporal dynamics of graded synaptic transmission in the lobster stomatogastric ganglion. J Neurosci. 1997;17:5610–5621. doi: 10.1523/JNEUROSCI.17-14-05610.1997. [DOI] [PMC free article] [PubMed] [Google Scholar]
- Manor Y, Bose A, Booth V, Nadim F. Contribution of synaptic depression to phase maintenance in a model rhythmic network. J Neurophysiol. 2003;90:3513–3528. doi: 10.1152/jn.00411.2003. [DOI] [PubMed] [Google Scholar]
- Marder E, Eisen JS. Transmitter identification of pyloric neurons: electrically coupled neurons use different transmitters. J Neurophysiol. 1984;51:1345–1361. doi: 10.1152/jn.1984.51.6.1345. [DOI] [PubMed] [Google Scholar]
- Markram H, Wang Y, Tsodyks M. Differential signaling via the same axon of neocortical pyramidal neurons. Proc Natl Acad Sci U S A. 1998;95:5323–5328. doi: 10.1073/pnas.95.9.5323. [DOI] [PMC free article] [PubMed] [Google Scholar]
- Miller JP, Selverston AI. Mechanisms underlying pattern generation in lobster stomatogastric ganglion as determined by selective inactivation of identified neurons. IV. Network properties of pyloric system. J Neurophysiol. 1982;48:1416–1432. doi: 10.1152/jn.1982.48.6.1416. [DOI] [PubMed] [Google Scholar]
- Moca VV, Nikolic D, Singer W, Mureşan RC. Membrane resonance enables stable and robust gamma oscillations. Cereb Cortex. 2014;24:119–142. doi: 10.1093/cercor/bhs293. [DOI] [PMC free article] [PubMed] [Google Scholar]
- Mouser C, Nadim F, Bose A. Maintaining phase of the crustacean tri-phasic pyloric rhythm. J Math Biol. 2008;57:161–181. doi: 10.1007/s00285-007-0150-2. [DOI] [PMC free article] [PubMed] [Google Scholar]
- Mulloney B, Selverston AI. Organization of the stomatogastric ganglion of the spiny lobster. I. Neurons driving the lateral teeth. J Comp Neurol. 1974;91:1–32. [Google Scholar]
- Nadim F, Bucher D. Neuromodulation of neurons and synapses. Curr Opin Neurobiol. 2014;29C:48–56. doi: 10.1016/j.conb.2014.05.003. [DOI] [PMC free article] [PubMed] [Google Scholar]
- Nadim F, Manor Y. The role of short-term synaptic dynamics in motor control. Curr Opin Neurobiol. 2000;10:683–690. doi: 10.1016/S0959-4388(00)00159-8. [DOI] [PubMed] [Google Scholar]
- Nadim F, Sheibanie AF. Different neuromodulators co-released from a projection neuron affect the synaptic strength in the target network depending on their temporal order. Soc Neurosci Abstr. 2010;36:287.286. [Google Scholar]
- Nadim F, Zhao S, Zhou L, Bose A. Inhibitory feedback promotes stability in an oscillatory network. J Neural Eng. 2011;8 doi: 10.1088/1741-2560/8/6/065001. 065001. [DOI] [PMC free article] [PubMed] [Google Scholar]
- Oh M, Tseng H, Nadim F. Synapses showing a preferred frequency in a reciprocally inhibitory neuronal network. BMC Neurosci. 2010;11(Suppl 1):P194. doi: 10.1186/1471-2202-11-S1-P194. [DOI] [Google Scholar]
- Oh M, Zhao S, Matveev V, Nadim F. Neuromodulatory changes in short-term synaptic dynamics may be mediated by two distinct mechanisms of presynaptic calcium entry. J Comput Neurosci. 2012;33:573–585. doi: 10.1007/s10827-012-0402-z. [DOI] [PMC free article] [PubMed] [Google Scholar]
- Pike FG, Goddard RS, Suckling JM, Ganter P, Kasthuri N, Paulsen O. Distinct frequency preferences of different types of rat hippocampal neurones in response to oscillatory input currents. J Physiol. 2000;529:205–213. doi: 10.1111/j.1469-7793.2000.00205.x. [DOI] [PMC free article] [PubMed] [Google Scholar]
- Prinz AA, Thirumalai V, Marder E. The functional consequences of changes in the strength and duration of synaptic inputs to oscillatory neurons. J Neurosci. 2003;23:943–954. doi: 10.1523/JNEUROSCI.23-03-00943.2003. [DOI] [PMC free article] [PubMed] [Google Scholar]
- Rabbah P, Nadim F. Distinct synaptic dynamics of heterogeneous pacemaker neurons in an oscillatory network. J Neurophysiol. 2007;97:2239–2253. doi: 10.1152/jn.01161.2006. [DOI] [PMC free article] [PubMed] [Google Scholar]
- Regehr WG. Short-term presynaptic plasticity. Cold Spring Harb Perspect Biol. 2012;4:a005702. doi: 10.1101/cshperspect.a005702. [DOI] [PMC free article] [PubMed] [Google Scholar]
- Rothman JS, Cathala L, Steuber V, Silver RA. Synaptic depression enables neuronal gain control. Nature. 2009;457:1015–1018. doi: 10.1038/nature07604. [DOI] [PMC free article] [PubMed] [Google Scholar]
- Schreiber S, Erchova I, Heinemann U, Herz AV. Subthreshold resonance explains the frequency-dependent integration of periodic as well as random stimuli in the entorhinal cortex. J Neurophysiol. 2004;92:408–415. doi: 10.1152/jn.01116.2003. [DOI] [PubMed] [Google Scholar]
- Sciamanna G, Wilson CJ. The ionic mechanism of gamma resonance in rat striatal fast-spiking neurons. J Neurophysiol. 2011;106:2936–2949. doi: 10.1152/jn.00280.2011. [DOI] [PMC free article] [PubMed] [Google Scholar]
- Taylor AL, Goaillard JM, Marder E. How multiple conductances determine electrophysiological properties in a multicompartment model. J Neurosci. 2009;29:5573–5586. doi: 10.1523/JNEUROSCI.4438-08.2009. [DOI] [PMC free article] [PubMed] [Google Scholar]
- Thirumalai V, Prinz AA, Johnson CD, Marder E. Red pigment concentrating hormone strongly enhances the strength of the feedback to the pyloric rhythm oscillator but has little effect on pyloric rhythm period. J Neurophysiol. 2006;95:1762–1770. doi: 10.1152/jn.00764.2005. [DOI] [PubMed] [Google Scholar]
- Tohidi V, Nadim F. Membrane resonance in bursting pacemaker neurons of an oscillatory network is correlated with network frequency. J Neurosci. 2009;29:6427–6435. doi: 10.1523/JNEUROSCI.0545-09.2009. [DOI] [PMC free article] [PubMed] [Google Scholar]
- Tseng HA, Nadim F. The membrane potential waveform of bursting pacemaker neurons is a predictor of their preferred frequency and the network cycle frequency. J Neurosci. 2010;30:10809–10819. doi: 10.1523/JNEUROSCI.1818-10.2010. [DOI] [PMC free article] [PubMed] [Google Scholar]
- Wu N, Hsiao CF, Chandler SH. Membrane resonance and subthreshold membrane oscillations in mesencephalic V neurons: participants in burst generation. J Neurosci. 2001;21:3729–3739. doi: 10.1523/JNEUROSCI.21-11-03729.2001. [DOI] [PMC free article] [PubMed] [Google Scholar]
- Zhao S, Sheibanie AF, Oh M, Rabbah P, Nadim F. Peptide neuromodulation of synaptic dynamics in an oscillatory network. J Neurosci. 2011;31:13991–14004. doi: 10.1523/JNEUROSCI.3624-11.2011. [DOI] [PMC free article] [PubMed] [Google Scholar]
- Zucker RS, Regehr WG. Short-term synaptic plasticity. Annu Rev Physiol. 2002;64:355–405. doi: 10.1146/annurev.physiol.64.092501.114547. [DOI] [PubMed] [Google Scholar]