Abstract
Context/Objective
Paired associative stimulation (PAS) involves paired-stimulation pulses at both the head (via transcranial magnetic stimulation) and the periphery (via peripheral nerve stimulation). The purpose of PAS, when applied to the spinal cord, is to induce neuroplasticity and upregulate the corticospinal tract leading to effector muscles. While limited research has suggested that it is possible to produce neuroplasticity through spinal PAS, all such studies have provided stimulation at a fixed frequency of 0.1 or 0.2 Hz.
Design/Interventions
The present study therefore sought to compare the effectiveness of a typical 0.1 Hz paradigm with a 1 Hz paradigm, and a paradigm which provided stimulation in 5 Hz “bursts”. Two inter-stimulus intervals were tested: one which was expected to produce synchronous pre- and post-synaptic activation at the spinal synapse, and one which was not. The peripheral stimulation was applied at the wrist, to induce thumb adduction.
Results
None of the paradigms were able to successfully induce neuroplasticity in a consistent manner.
Conclusion
The high between-subject variability in this study suggests that responses to the spinal PAS treatment may have been highly individual. This serves to highlight a potential limitation of the spinal PAS treatment, which is that its effectiveness may not be universal, but rather dependent on each specific recipient. This may be a challenge faced by spinal PAS should it continue to be tested as a potential novel therapy.
Keywords: Electric stimulation therapy, Neuroplasticity, Spinal cord, Transcranial magnetic stimulation
Introduction
Long-term potentiation (LTP) describes a specific cellular-level mechanism for the induction of neuroplasticity at synapses. It occurs when both the pre-synaptic axon and post-synaptic dendrite or soma are simultaneously active.1 In nature, these conditions are primarily achieved either through high-frequency action potential firing or through simultaneously active axons synapsing onto the same area of the post-synaptic cell. Regardless of the mechanism, the end result is an influx of Ca2+ through N-methyl-d-aspartate (NMDA) channels in the post-synaptic cell, which set off a down-stream cascade that eventually results in an increase in synaptic efficiency or sensitivity (i.e. the post-synaptic cell will produce a greater response to a given level of activation from the pre-synaptic cell). This process is thought to underlie associative learning and memory, and may be essential in the formation of functional networks within the nervous system.2,3 Furthermore, it has regularly been suggested as a possible way of retraining the nervous system following injury or disease, to improve the individual's function.4
Since the discovery of the mechanisms of LTP, it has been suggested that artificial stimulation techniques can also establish the necessary conditions for LTP induction. One example is a technique developed with the intention of treating individuals who have suffered strokes, called “paired associative stimulation” (PAS).5 In PAS, signals generated via peripheral nerve stimulation (PNS) ascend through normal sensory pathways until they reach the primary somatosensory cortex, which in turn connects to the primary motor cortex (M1) through various networks. At the moment that these signals are expected to reach M1, the brain is non-invasively stimulated through transcranial magnetic stimulation (TMS). If the timing is correctly predicted, then the motor cortex becomes transiently upregulated. This upregulation has been shown to be dependent on NMDA channels and Ca2+ influx,6 and is therefore proposed to act through LTP. That PAS is highly dependent upon the delay between the two stimuli (termed the inter-stimulus interval, or ISI),7 further suggests that it is acting through LTP.
More recently, it has been suggested that the spinal synapse, rather than the cortex, could be a potential target for this kind of paired stimulation,8–11 particularly for assisting individuals with incomplete spinal cord injury (SCI). In this case, the PNS is intended not to stimulate sensory fibers, but rather, to send antidromic firing through the α motor neurons. Meanwhile, the TMS, rather than being intended to stimulate the cortex directly, is intended to send a descending signal down through the corticospinal tract. If properly timed, the two signals should meet at the spinal synapse and induce LTP there.
A number of studies have built up evidence suggesting the potential of spinal PAS to induce neuroplasticity in the corticospinal tract.8–11 In one study,11 these results have even been extended from able-bodied participants to individuals with SCI, and effects have been shown not only on neurophysiological measures, but also on functional measures as well. However, a major limitation of the current literature is that all of the aforementioned studies employ a single stimulation frequency (0.2 Hz in Leukel et al.,10 0.1 Hz in all others8,9,11). It therefore remains unknown whether higher-frequency spinal PAS may be able to induce even greater neuroplasticity. The purpose of this study was therefore to investigate multiple high-frequency spinal PAS protocols and compare them to the conventional 0.1 Hz stimulation. Two ISIs were also tested. One of these intervals was calculated so as to allow the TMS and PNS pulses to synchronously meet at the spinal synapse, while the other was intended to provide asynchronous activation. The purpose of this was to ensure that any observed effects of the intervention were in fact due to a timing-dependent mechanism, consistent with the hypothesis of LTP induction.
Methods
Participants
Two groups of able-bodied participants were recruited, one for experiments using the “synchronous” ISI and one using the “asynchronous” ISI (the details of these conditions are described below in the “Interventions” section). In the “synchronous ISI” group, nine participants (five females, from 20 to 45 years of age, mean ± standard deviation: 29.1 ± 6.7 years) completed the study. Two participants in this group declined to complete one session in the “5 Hz” condition due to excessive discomfort from the TMS coil during the spinal PAS intervention, and were excluded from the analysis. In the “asynchronous ISI” group, 12 participants (5 females, from 25 to 45 years of age, mean ± standard deviation: 30.0 ± 5.3 years) completed the study. One participant in this group declined to complete one session in the “5 Hz” condition, again due to excessive discomfort from the TMS coil during the spinal PAS intervention. Note that seven participants (four female) participated in both the “synchronous ISI” and “asynchronous ISI” groups. All procedures were approved by the research ethics boards of the University of Toronto and the Toronto Rehabilitation Institute – University Health Network. All subjects gave their written informed consent to participate in the study after having received a detailed explanation about the purposes, benefits, and risks associated with the execution of the study. All participants were right-handed.
Spinal PAS interventions
The experimental setup is illustrated in Fig. 1, while the overall timeline for each participant's involvement in the study is illustrated in Fig. 2. Each of the three interventions consisted of 15 minutes of paired TMS and PNS. The TMS was delivered using a transcranial magnetic stimulator (MagPro R30 + M, Medtronic, Inc., Minneapolis, MN, USA) with a figure-eight coil (MCF-B65, Medtronic). The TMS coil was positioned over the location that provided the optimal motor evoked potential (MEP) in the abductor pollicis brevis (APB) muscle of the non-dominant hand (i.e. left hand). The intensity of TMS stimulation was set to 1.2 times the threshold intensity for visible APB MEP. The PNS was delivered using an electrical stimulator (Master8, A.M.P.I., Jerusalem, Israel) through a custom-built bipolar probe placed on the ventral side of the wrist, over the approximate location of the median nerve. The exact location varied slightly for each participant, and was determined as the location, which provided the maximum visible M-wave. The intensity of the PNS stimulation was set to 1.2 times the threshold intensity for visible APB M-waves. The pulse width of the PNS stimulation was kept constant at 1 ms. Both the TMS and PNS were controlled by a custom-made code (Labview version 8.5, National Instruments Corp., Austin, TX, USA). Participants were asked to remain relaxed for the duration of the stimulation.
Figure 1 .
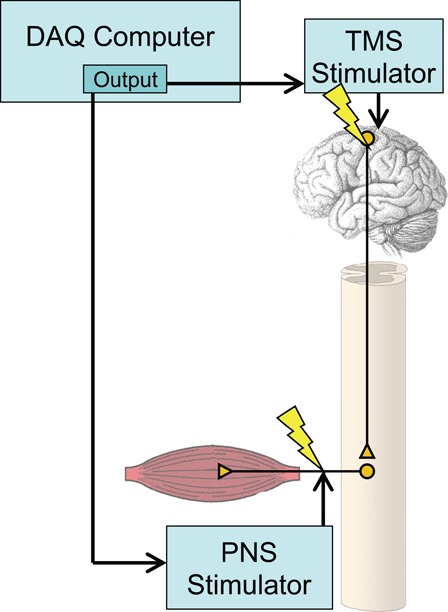
The experimental setup employed. The setup includes a data acquisition (DAQ) computer, which controls both the TMS unit (for stimulating the brain) and the PNS unit.
Figure 2 .
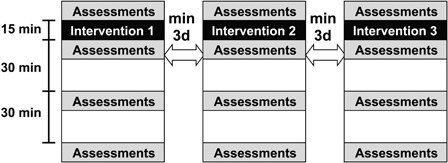
Overall study design for each participant. Three interventions were applied, each for 15 minutes, with assessments pre-intervention, immediately post-intervention, 30 minutes post-intervention, and 60 minutes post-intervention. Each session was separated from the others by a minimum of 3 days.
Three stimulation conditions were compared:
-
1.
Continuous paired stimulation at 0.1 Hz.
-
2.
Continuous paired stimulation at 1 Hz.
-
3.
Pulsed paired stimulation at 5 Hz, consisting of a 2-second train of pulses followed by 8 seconds without stimulation.
These conditions are graphically outlined in Fig. 3.
Figure 3 .
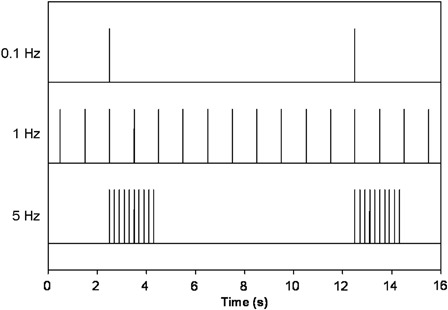
The three stimulation protocols employed. Spikes represent both TMS and PNS pulses, since the delays between the two stimulation types are too small to be seen at this timescale. While the 0.1 and 1 Hz conditions provide continuous stimulation, the 5 Hz condition provides stimulation in 2 seconds bursts, with 8 seconds of rest in between.
The “synchronous” ISI (that in which the stimulation pulses were intended to reach the spinal synapse at the same time) was determined prior to the start of the first session as the interval between the delivery of the TMS and PNS pulses intended to result in synchronous pre-synaptic and post-synaptic activation at the spinal synapse. The “synchronous” ISI was described as the F-wave latency (LF) minus the MEP latency (LMEP):
When this ISI was a positive value, PNS needed to precede TMS with the value for both stimulations reached the spinal synapse at the same time. F-wave latency was determined by stimulating through the electrode used for the spinal PAS intervention itself, albeit at higher intensities (up to 60 mA), and a shorter pulse width (100 µs).12 In all participants, the resultant ISI was within the range of 4–7 ms (with F-wave latencies ranging from 22 to 29 ms, and MEP latencies ranging from 18 to 23 ms).
A second, “asynchronous” ISI was also tested in order to determine the effect of desynchronizing the pre-synaptic and post-synaptic activation of the spinal synapse. The asynchronous ISI was determined for each session as a random value between 15 and 20 ms greater than the participant's synchronous ISI. This range was considered appropriate since PAS studies have shown similar differences in ISI to negate neuroplastic effects. The purpose of testing this ISI was to determine whether or not any observed effects were dependent on having the two signals induced by TMS and PNS meet each other at the spinal synapse.
Assessments
All assessments were conducted immediately prior to the intervention (Pre), immediately post-intervention (Post-0), 30 minutes post-intervention (Post-30), and 60-minutes post-intervention (Post-60).
Motor evoked potential
Peak-to-peak MEPs were evoked at a range of TMS intensities, each separated by 10% of the maximum stimulator output (MSO), with 10 magnetic stimulations being applied at each intensity, ranging from below the threshold intensity to 100% MSO. MEPs were recorded using an electromyography (EMG) system (AMT-8, Bortec Biomedical, Calgary, AB, Canada) from the APB muscle. The recorded MEPs were later analyzed offline, in order to determine the following values13,14: the maximum MEP amplitude, the TMS intensity which produced a half-maximal response (intended to detect a leftward shift in the response curve, indicating increased sensitivity), the approximated MEP amplitude at the TMS intensity which produced a half-maximal MEP prior to intervention, the MEP amplitude at the lowest TMS intensity to produce a mean response of at least 1 mV prior to intervention, and the MEP amplitude at the TMS intensity which most closely approximates 120% of the resting motor threshold.
Grip force and maximum voluntary contraction
Grip force was assessed by asking the participant to grip a hand dynamometer (Jamar Plus+, Patterson Medical Holdings, Inc., Bolingbrook, IL, USA) as strongly as they could, for 3 seconds. Participants were asked to complete three repeats for each hand in each round of assessment. EMG activity was being recorded from the APB muscle. Maximum voluntary contraction (MVC) was determined by recording the mean rectified EMG signal for each repeat. The means of these three repeats were derived for each hand, and the ratio between the non-dominant (i.e. left) (treated) and dominant (i.e. right) (untreated) sides was taken as the outcome measure of these assessments.
Matched forces
This assessment was based on the method presented by Taylor and Martin.8 Its purpose was to measure changes in the input–output relationship of the spinal synapses on both sides of the body. Participants were asked to perform weak, ballistic, bilateral contractions of their APB muscle, by adducting their thumb across their palm. Visual feedback was presented to the participants in the form of a virtual dial. This dial represented the mean rectified APB EMG activity in their unstimulated side, with an upward position indicating 10% of the pre-intervention MVC. Participants were not informed that this feedback was only coming from their untested side. The purpose of this was to require participants to generate the same amount of descending voluntary drive from both sides of the body, both before and after the intervention. Any changes in the resulting EMG could therefore be taken as indicative of sub-cortical mechanisms, such as plasticity at the spinal synapse, which could help to elucidate the exact location of any observed plasticity in the MEP results. Since the participants were asked not to correct their movements after the initial contraction, but rather, to return immediately to a resting position, the involvement of sensory feedback was expected to be minimal. Following a brief practice, they were asked to complete 20 repetitions of the movement. From each of these 40 EMG traces (20 repetitions, with recordings being taken from both hands), the maximum rectified value was taken, and for each of the 20 repetitions, the ratio between the maximum values of the two sides (non-dominant/dominant, i.e. left/right) was derived. The mean of these 20 ratios was taken as the outcome measure.
Statistics
An initial repeated-measures analysis of variance (ANOVA) was applied to test for overall differences between treatment conditions, taking timepoints (Pre, Post-0, Post-30, and Post-60) and treatment conditions (0.1, 1, and 5 Hz) as factors. The repeated-measures ANOVA was chosen in order to properly account for the fact that each participant was tested with every treatment condition, and to better account for baseline variability across participants. Following this, additional repeated-measures ANOVAs, again taking timepoint and treatment condition as factors, were conducted on data from pairs of treatment conditions, to provide specific comparisons between each of the conditions. For example, one round of these later analyses would include only data from the 0.1 and 1 Hz conditions, in order to discern differences between those two. In all cases, the P-values reported in the Results section are those from the time × treatment condition interaction term. The time × treatment condition interaction term was taken as the primary statistical measure because, as suggested above, it best addressed the question of whether the time-course of each outcome measure was being altered differently by the various treatments. Single-factor P-values (that is, P-values from either the “time” or “treatment condition” factor independent of each other) are not reported since their interpretation is not meaningful in the context of the research questions being asked. For example, if only “time” was considered, the different treatment groups would be lumped together, and we could only conclude whether or not they collectively affected the time-course of the outcome measures. Similarly, if only “treatment condition” was considered, the pre- and post-intervention measures would be lumped together, and the baseline variability in the data would not be distinguishable from treatment effects. These analyses were conducted separately for the “synchronous ISI” and “asynchronous ISI” groups.
In all cases, results were considered significant if they provided P-values of ≤0.05.
Results
MEP-based results are displayed in Figs. 4 and 5. Non-MEP results are displayed in Fig. 6. In all cases, asterisks represent a significant difference in the timepoint × treatment condition interaction term.
Figure 4 .
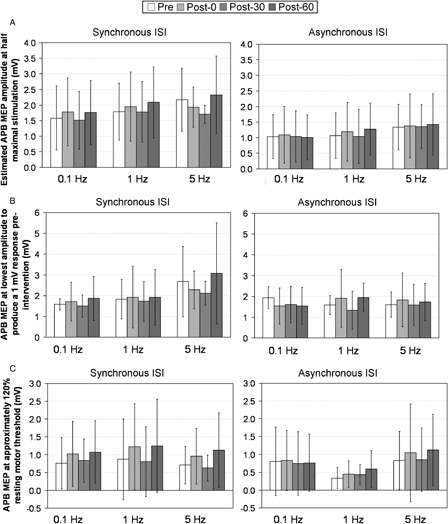
Summary of the MEP results in which the MEP amplitude was investigated at a given stimulation intensity: (A) estimated MEP amplitude in response to a stimuli that produced a half-maximal response pre-intervention, (B) MEP amplitude at the lowest TMS intensity to produce a mean response of at least 1 mV prior to intervention, and (C) MEP amplitude at and the MEP amplitude at the TMS intensity which most closely approximates 120% of the resting motor threshold. No significant comparisons were observed.
Figure 5 .
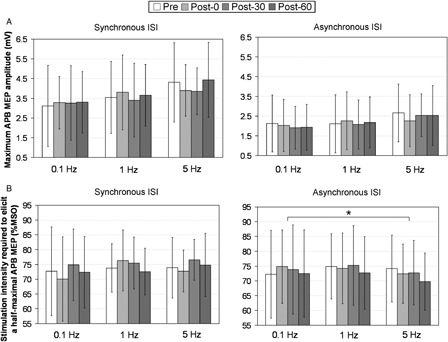
Summary of the additional MEP results: (A) maximum MEP amplitude, and (B) stimulation intensity which elicited a half-maximal contraction. *A significant difference (P ≤ 0.05) in the timepoint × treatment condition interaction term when only isolated pairs of treatment conditions are examined.
Figure 6 .
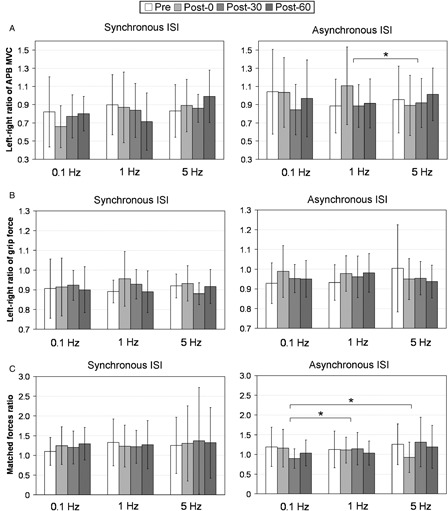
Summary of results for the non-MEP-based assessments: (A) ratio between left and right APB MVCs, (B) the ratio between left and right grip forces, and (C) ratio between left and right muscle activity during the matched forces task. *A significant difference (P ≤ 0.05) in the timepoint × treatment condition interaction term when only isolated pairs of treatment conditions are examined.
No measures showed significant timepoint × treatment condition interaction in the initial ANOVA tests in the “synchronous ISI” group (P ≥ 0.1199), but significant timepoint × treatment condition interaction was found in the “asynchronous ISI” group in the intensity required for a half-maximal MEP (P = 0.0255) (Fig. 4A) and the matched forces ratio (P = 0.0040) (Fig. 6C).
Comparisons between the two ISI groups generally did not find significant differences (Figs. 4–6). When only participants common to both of the ISI groups were considered, only two comparisons were significant: the pre–post ratio of the left–right MVC ratio was greater in the “asynchronous ISI” group, both when comparing the rate of change from pre-intervention to 30 minutes post-intervention (P = 0.0111) (Fig. 6A), and when comparing the rate of change from pre-intervention to 60 minutes post-intervention (P = 0.0083) (Fig. 6A). When all participants were included, only three comparisons were significant: the pre–post ratio of the left–right matched forces ratio was greater in the “synchronous ISI” group, both when comparing the rate of change from pre-intervention to 30 minutes post-intervention (P = 0.0287) (Fig. 6C), and the rate of change from pre-intervention to 60 minutes post-intervention (P = 0.0089) (Fig. 6C), and the pre–post ratio of the left–right MVC ratio was greater in the “synchronous ISI” group, when comparing the rate of change from immediately post-intervention to 60 minutes post-intervention (P = 0.0081) (Fig. 6A).
Discussion
Negative results
The majority of statistical comparisons conducted in this study did not find difference between the various interventions being tested. While some exceptions are visible within the results (i.e. statistically significant comparisons observed in the asynchronous group), these are irregular, and do not follow a pattern from which meaningful inferences can be made. We consider that there were stochastically observed statistical significance.
The negative results in this study are not readily explained by comparisons to the stimulation protocols employed in other spinal PAS studies (as previously outlined in the Introduction section). In particular, the 0.1 Hz condition is in line with existing protocols, and the outcome measures and stimulation parameters used in our study are very similar to those used in the Bunday and Perez study11 (with the key difference being the lower TMS amplitude in our study). A possible explanation as to why increased stimulation amplitude may provide better neuroplasticity will be outlined in the “Mismatch Between Targeted Muscle Fibers” section, but, this possibility cannot be verified or disproven with the current data. Spinal PAS studies other than the Bunday and Perez study11 did not use consistent outcome measures, and targeted different muscles, which make comparisons to these studies difficult. The duration of treatment is roughly consistent with that employed in other spinal PAS studies, although the 1 and 5 Hz groups, by virtue of the higher stimulation frequencies, involved a greater overall quantity of stimulation. In all previous spinal PAS studies, able-bodied participants were employed (although the Bunday and Perez study11 also employed individuals with SCI as a separate group), consistent with our design.
High between-subject variability
The authors note that even when the baseline variability is taken into consideration, the variability in this study is exceptionally high, as compared to other studies conducted in our group with nearly identical assessment methodology. This is despite the many measures employed in the experimental design in order to control for variability. This variability may be one of the key factors that prevented statistical significance from being observed in the majority of statistical comparisons.
The high variability itself may point to a potential limitation of the spinal PAS method, in that individuals may have widely different responses to the same treatment. In the literature pertaining to similar protocols, and to TMS in general, there is strong evidence to show such variability across participants. Fratello et al.15 showed that while mean group effects in response to PAS were consistent across repeated sessions, large variability existed across participants. Florian et al.16 showed similar variability across participants, going so far as to classify 14 of their 27 participants as “responders” (who showed LTP), and the rest as “non-responders” (who showed LTD), somewhat analogous to the way in which individuals can often be termed as “responders” or “non-responders” with respect to many different medications. However, they suggested that this variability was largely explainable by correlations with participant age (with younger participants more likely to be responders), and by baseline MEP threshold (with lower thresholds correlating with greater responsiveness). This was not observed in the present study (correlation analysis was conducted, but has not been presented). Note that while these two studies pertain to PAS, it is reasonable based on the underlying neurophysiological theory to apply the same principles to spinal PAS, in which the limited scope of the literature prevents us from more fully understanding inter-individual variability. Wassermann17 provided evidence which, in light of Florian et al.16 and Fratello et al.'s15 studies, suggests that variable response to PAS may result from varying response to TMS in general. Both single and paired TMS pulses showed a wide range of responses, and it was highlighted that among the paired-pulse stimulation, both facilitation and inhibition of the second response were seen in at least some proportion of participants. No correlation was found between these measures and age or sex. This literature supports the finding in the present study that paired-stimulation protocols can have widely different responses in different individuals. It would not be surprising to find that this variability is further increased across individuals with SCI, owing to the heterogeneity of the population (that is, in addition to the regular inter-individual variability, there would also be variability based on the wide range of different injuries). This finding suggests a potential limitation of the clinical utility of PAS and spinal PAS.
Mismatch between targeted muscle fibers
One possible reason why this treatment may not have been effective may have come from a mismatch between the muscle fibers targeted by the TMS and the PNS. It has long been suspected that PNS and FES tend to recruit muscle fibers in the opposite order that volitional signals from the brain do. While natural stimulation from the brain first recruits smaller-diameter fibers, external stimulation tends to first recruit larger-diameter fibers.18,19 By contrast, TMS activates muscle fibers in the same order that voluntary muscle activation does.20 With increasing stimulation amplitudes, more fibers get recruited until the majority of the muscle is contracting, in both TMS and PNS. Thus, at low stimulation amplitudes (such as those employed in the spinal PAS protocol), TMS and PNS may recruit different muscle fibers. This may prevent the signals from the TMS and the PNS from meeting, since they are both directed towards different synapses. Higher stimulation amplitudes, if they are tolerated by participants, may provide a better pairing of the two induced signals. This suggestion, however, cannot be validated within the current data, and has not been raised elsewhere in the existing spinal PAS literature. It must therefore remain speculation at the present time.
Effects of attention and participant engagement
Another potential reason for the negative results in the present study may be the effects of attention and participant engagement. While these factors have not been investigated specifically in spinal PAS, they have been investigated in similar stimulation protocols, such as PAS21 and repetitive TMS.22 In both cases, it was found that the neuroplastic effects of the stimulation protocols, as assessed through MEP, were decreased or lost entirely when the participant did not attend to the hand being stimulated. The suggestion of these studies is that focusing attention on the hand being stimulated increases the excitability of the relevant section of M1, facilitating activation, and thereby, LTP. In the present study, participants were not specifically asked to attend to their hand. None of the other spinal PAS papers discussed in the Introduction section8–11 explicitly state whether or not they require participants to attend to the site of their stimulation. It therefore cannot be concluded whether or not this factor is primarily responsible for the discrepancies between the current findings and the existing literature, but it is reasonable to suggest that it may have been a confounding factor.
Conclusions
Contrary to the existing literature, the spinal PAS treatments tested herein have not been effective consistently, modulating the nervous system. However, the root cause of this seems to primarily have been excessive variability in the outcome measures, which may be a genuine response to the treatment itself. That response to spinal PAS treatment can be so highly individual, and in such unpredictable ways, suggests that spinal PAS may be of limited utility as a therapeutic intervention. Even if some individuals were able to derive benefit from the treatment, some may also have detrimental responses, with more still having no response. Furthermore, there may not be a clear method by which to determine which will be the case prior to applying the treatment itself. The original question being investigated (the effect of different stimulation frequencies upon the therapeutic effects of spinal PAS) cannot properly be addressed with the current data, and therefore remains open for further research to elucidate. The spinal PAS treatment can be a potential method that could induce improvement of motor function in individuals with SCI. However, this study raises a question about the general use of this method. It is still possible that our methods, including the choice of peripheral stimulation site and the selected measures, were not ideal and therefore caused negative results in this study. Future detail studies are highly required.
Disclaimer statements
Contributors Dr SCM conducted background research, designed and conducted the experiments, and wrote and submitted the document. Dr KM conducted some experimental sessions, provided design consulting, and edited the document. Dr MRP helped to procure finances for the study, provided some design consulting, and edited the document.
Funding None.
Conflicts of interest None.
Ethics approval All procedures were approved by the research ethics boards of the University of Toronto and the Toronto Rehabilitation Institute – University Health Network.
Acknowledgments
This study was supported by the Natural Sciences and Engineering Research Council (grant #249669), Dana Consortium, Toronto Rehabilitation Institute, and Ontario Ministry of Health and Long-Term Care. The authors declare that there are no conflicts of interest.
References
- 1.Hebb D The organization of behavior: a neuropsychological theory. Florence: Psychology Press; 1949 [Google Scholar]
- 2.Cain DP LTP, NMDA, genes and learning. Curr Opin Neurobiol 1997;7(2):235–42 [DOI] [PubMed] [Google Scholar]
- 3.Rison RA, Stanton PK. Long-term potentiation and N-methyl-D-aspartate receptors: foundations of memory and neurologic disease? Neurosci Biobehav Rev 1995;19(4):533–52 [DOI] [PubMed] [Google Scholar]
- 4.Rushton DN Functional electrical stimulation and rehabilitation – an hypothesis. Med Eng Phys 2003;25(1):75–8 [DOI] [PubMed] [Google Scholar]
- 5.Stefan K, Kunesch E, Cohen LG, Benecke R, Classen J. Induction of plasticity in the human motor cortex by paired associative stimulation. Brain 2000;123(Pt 3):572–84 [DOI] [PubMed] [Google Scholar]
- 6.Wolters A, Sandbrink F, Schlottmann A, Kunesch E, Stefan K, Cohen LG, et al. A temporally asymmetric Hebbian rule governing plasticity in the human motor cortex. J Neurophysiol 2003;89(5):2339–45 [DOI] [PubMed] [Google Scholar]
- 7.Mrachacz-Kersting N, Fong M, Murphy BA, Skinjaer T. Changes in excitability of the cortical projections to the human tibialis anterior after paired associative stimulation. J Neurophysiol 2007;97(3):1951–8 [DOI] [PubMed] [Google Scholar]
- 8.Taylor JL, Martin PG. Voluntary motor output is altered by spike-timing-dependent changes in the human corticospinal pathway. J Neurosci 2009;29(37):11708–16 [DOI] [PMC free article] [PubMed] [Google Scholar]
- 9.Cortes M, Thickbroom GW, Valls-Sole J, Pascual-Leone A, Edwards DJ. Spinal associative stimulation: a non-invasive stimulation paradigm to modulate spinal excitability. Clin Neurophysiol 2011;122(11):2254–9 [DOI] [PMC free article] [PubMed] [Google Scholar]
- 10.Leukel C, Taube W, Beck S, Schubert M. Pathway-specific plasticity in the human spinal cord. Eur J Neurosci 2012;35(10):1622–9 [DOI] [PubMed] [Google Scholar]
- 11.Bunday KL, Perez MA. Motor recovery after spinal cord injury enhanced by strengthening corticospinal synaptic transmission. Curr Biol 2012;22(24):1–7 [DOI] [PMC free article] [PubMed] [Google Scholar]
- 12.Renshaw B Influence of discharge of motoneurons upon excitation of neighbouring motoneurons. J Neurophysiol 1941;4:167–83 [Google Scholar]
- 13.Devanne H, Lavoie BA, Capaday C. Input-output properties and gain changes in the human corticospinal pathway. Exp Brain Res 1997;114(2):329–38 [DOI] [PubMed] [Google Scholar]
- 14.Knash ME, Kido A, Gorassini MA, Chan KM, Stein RB. Electrical stimulation of the human common peroneal nerve elicits lasting facilitation of cortical motor evoked potentials. Exp Brain Res 2003;153(3):366–77 [DOI] [PubMed] [Google Scholar]
- 15.Fratello F, Veniero D, Curcio G, Ferrara M, Marzano C, Moroni F, et al. Modulation of corticospinal excitability by paired associative stimulation: reproducibility of effects and intraindividual reliability. Clin Neurophysiol 2006;117(12):2667–74 [DOI] [PubMed] [Google Scholar]
- 16.Florian J, Müller-Dahlhaus M, Liu Y, Ziemann U. Inhibitory circuits and the nature of their interactions in the human motor cortex a pharmacological TMS study. J Physiol 2008;586(2):495–514 [DOI] [PMC free article] [PubMed] [Google Scholar]
- 17.Wassermann EM Variation in the response to transcranial magnetic brain stimulation in the general population. Clin Neurophysiol 2002;113(7):1165–71 [DOI] [PubMed] [Google Scholar]
- 18.Knaflitz M, Merletti R, de Luca CJ. Inference of motor unit recruitment order in voluntary and electrically elicited contractions. J Appl Physiol 1990;68(4):1657–67 [DOI] [PubMed] [Google Scholar]
- 19.Mesin L, Merlo E, Merletti R, Orizio C. Investigation of motor unit recruitment during stimulated contractions of tibialis anterior muscle. J Electromyogr Kinesiol 2010;20(4):580–9 [DOI] [PubMed] [Google Scholar]
- 20.Bawa P, Lemon RN. Recruitment of motor units in response to transcranial magnetic stimulation in man. J Physiol 1993;471:445–64 [DOI] [PMC free article] [PubMed] [Google Scholar]
- 21.Stefan K, Wycislo M, Classen J. Modulation of associative human motor cortical plasticity by attention. J Neurophysiol 2004;92(1):66–72 [DOI] [PubMed] [Google Scholar]
- 22.Conte A, Gilio F, Iezzi E, Frasca V, Inghilleri M, Berardelli A. Attention influences the excitability of cortical motor areas in healthy humans. Exp Brain Res 2007;182(1):109–17 [DOI] [PubMed] [Google Scholar]


