SUMMARY
We compare two approaches to numerical estimation of mechanical hemolysis in a simplified blood pump model. The stress-based model relies on the instantaneous shear stress in the blood flow, whereas the strain-based model uses an additional tensor equation to relate distortion of red blood cells to a shear stress measure. We use the newly proposed least-squares finite element method (LSFEM) to prevent negative concentration fields and show a stable and volume preserving LSFEM for the tensor equation. Application of both models to a simplified centrifugal blood pump at three different operating conditions show that the stress-based model overestimates the rate of hemolysis. The strain-based model is found to deliver lower hemolysis rates since it incorporates a more detailed description of biophysical phenomena into the simulation process.
Keywords: Computational hemodynamics, Hemolysis modeling, Ventricular assist device, Residence time, Finite element method
1. INTRODUCTION
Computational fluid dynamics (CFD) has proved to be a useful tool to shorten the development phase of new blood contacting medical devices. One example application is virtual prototyping of blood pumps, like ventricular assist devices (VADs). In the past, most of the studies focused on the numerical prediction of hydraulic performance of a VAD [1, 2]. Another important design criterion is the hematologic compatibility of such a device, since blood may be subject to hemolysis (hemoglobin release from red blood cells or RBCs) and thrombosis (clotting of blood). However, blood-damage models for numerical predictions have yet to demonstrate their reliability.
In this study, we compare two approaches to estimate hemolysis in a simple 3D blood pump configuration. In both cases, hemolysis is related to shear rate and exposure time by a power law:
| (1) |
where f̃Hb is the ratio of plasma-free (PF) hemoglobin, σs is the steady shear stress, and t the exposure time. The parameters C, α and β are correlated with experiments. In this study, we use the parameter set proposed by Giersiepen et al. [3] with C = 3.62 × 10⁻⁷, α = 2.416 and β = 0.785. In applications including complex transient 3D flows, σs is replaced by a scalar representation of the instantaneous stress tensor σ, i.e.,
| (2) |
Hereafter, this method is called “stress-based” approach.
In 2004, Arora et al. introduced a morphology tensor to estimate distortion of RBCs [4]. A tensorial evolution equation was proposed, similar to the evolution equation of a droplet. Distortion of each RBC is converted to the equivalent scalar shear stress σs to estimate hemolysis. This method is called “strain-based” approach.
Stress- and strain-based models have been already compared for the GYRO centrifugal blood pump [5]. In that paper, Arora et al. [5] computed hemolysis using tracer particles along their pathlines. This Lagrangian approach, however, can cause a biased estimation when the number of tracers is not sufficient to cover the whole volume inside the pump. Furthermore, some tracers can get “lost” in the pump due to stagnation points or vortices in complex flow fields. To overcome these issues, we use a method that treats the blood damage as a field variable, like velocity or pressure in general CFD analyses; in other words, we use an Eulerian approach. The Eulerian approach using a stress-based model was previously introduced by Garon and Farinas [6] and Farinas [7]. PF hemoglobin is computed using a convection-reaction system where the rate equation for the hemoglobin release (1) is linearized to eliminate time dependency. Nam et al. [8] showed that the direct use of the convection-reaction system can lead to non-physical negative concentration values. They introduced a least-squares finite element formulation (LSFEM) with a transformed variable to overcome this issue.
In the present study, we show a method to apply the strain-based model in an Eulerian framework. The method is based on LSFEM that can handle unsteady hemolysis estimation for large-scale problems, i.e., a centrifugal blood pump. In Sec. 2, we introduce the numerical methods for predicting blood flow, RBC deformation and PF hemoglobin concentration, respectively. Also, the stress- and strain-based models are presented in more detail. In Sec. 3, we use a simplified blood pump for the numerical experiments. The comparison of results from both models (Sec. 4) is used to draw the conclusion that the stress-based model may overpredict blood damage (Sec. 5).
2. NUMERICAL METHODS
2.1. Mass and momentum balance for blood flow
In order to model blood flow we consider a fluid occupying a time varying domain Ωt ⊂ ℝnsd with boundary Γt, where nsd is the number of space dimensions. Velocity u and pressure p are governed by the incompressible Navier-Stokes equations:
| (3) |
| (4) |
where f is the body force (e.g., gravity) and ρ the density. We assume that blood is a Newtonian fluid with the stress tensor σ:
| (5) |
where μb is the dynamic viscosity of blood. The Dirichlet- and Neumann-type boundary conditions are:
| (6) |
| (7) |
(Γt)g and (Γt)h are complementary subsets of the boundary Γt.
To solve Eqs. (3) and (4), the deformable-spatial-domain/stabilized space-time (DSD/SST) finite element approach [9, 10] is used.
2.2. Space-time least-squares finite element method (LSFEM) for a tensorial variable
Arora et al. [4] proposed a red blood cell (RBC) deformation model based on Ref. [11]. In this model, the governing equation is a tensorial hyperbolic partial differential equation for the positive-definite shape tensor S. This tensor represents a general ellipsoid that mimics the deformed red blood cells within the flow.
Here, we introduce the space-time formulation together with the least-squares finite element method for the transient computation of shape tensor evolution. Even though the governing equation is hyperbolic, i.e., no diffusion term exists, the proposed method does not have any restriction on the choice of basis functions in terms of numerical stability, in contrast to the Galerkin method. Here, piecewise linear basis functions are used which are continuous in space and discontinuous in time. Furthermore, the proposed method can be easily reduced to the steady-state computation. The LSFEM method for the shape tensor equation is a subject of a separate manuscript (in preparation); only essential aspects are mentioned here.
The method is designed to minimize the raw residual tensor R:
| (8) |
where E and W are the rate of strain and vorticity tensors respectively. The function g (S) is introduced to preserve the shape volume [11],
| (9) |
and IIS and IIIS are second and third invariants of S, respectively, defined as:
| (10) |
In Ref. [4] parameters f1 = 5.0 sec−1 and f2 = f3 = 4.2998 × 10⁻⁴ were established based on the properties of the RBC. Note that R(S) = 0 is the governing equation for the RBC shape.
In the space-time formulation, we partition the time interval (0, T) into subintervals In = (tn, tn+1). Let the space domain at time tn be Ωn = Ωtn and its boundary Γn = Γtn. Then, one can define the space-time slab Qn as the domain enclosed by the surfaces Ωn and Ωn+1, and Pn, where Pn is the surface described by the boundary Γn as t traverses In. Here, we will specify a shape tensor at the inlet boundary of space-time domain (Pn)g. For each space-time slab, we define finite element basis functions for the shape tensor:
| (11) |
In order to minimize the residual (8), we minimize the least-squares functional for the space-time slab Qn which can be written as follows:
| (12) |
where R = [Rkl], S = [Skl], and . Moreover, ϕi is a piecewise linear polynomial in time and space and N is the number of nodes in the space-time slab. In the above equation, the following standard notation is applied:
Although the governing equation preserves the volume under deformations, as shown in [11], the solution that minimizes Eq. (12) may allow for solutions with a volume that significantly deviates from the initial value. This can be a serious problem, especially in transient computations. For example, if the size of RBCs becomes significantly reduced, the numerical errors may dominate when predicting the cell deformation. To overcome this, we developed two augmentation methods for LSFEM: a Lagrangian-multiplier method and a penalty method. Here, we use the pentalty-based LSFEM to enhance the volume conservation. The original functional becomes:
| (13) |
where εp is the penalty parameter and the augmented term (A) enforces the volume conservation of computed solutions. Here, we set εp = 10−3 for the shape tensor computations. Note that the volume occupied by the shape tensor S is . Here, we set the volume to one initially.
The solution that minimizes Eq. (13) can be obtained by solving the following equation:
| (14) |
In order to solve this equation, Newton’s method is used:
| (15) |
where the Jacobian entries are:
| (16) |
We iterate this method until the
 -norm of the residual vector
or the solution update vector
falls below a certain threshold, e.g., εt ≤ 10−7. The index notation of the above equations is taken from [12].
2.3. Material balance for plasma-free hemoglobin
Nam et al. [8] introduced a field variable approach based on Refs. [6, 7] to compute the concentration of PF hemoglobin in blood flow. Here, we only repeat briefly the most important equations that are needed to compute the concentration field and refer the reader for details to Ref. [8].
We define fHb to be the ratio between the PF hemoglobin and the total hemoglobin in blood. Assuming the total hemoglobin to be constant over time, the governing convection-reaction equation reads:
| (17) |
The hemoglobin generation rate rΔHb can be defined as in [6, 7] by:
| (18) |
where mHb = 2.416/0.785 = 3.078, AHb = (3.62 × 10⁻⁷)1/0.785 (parameters taken from Ref. [3]), and σs is a scalar shear stress.
The unmodified use of Eq. (17) can lead to non-physical negative hemoglobin concentrations. To overcome this issue, Nam et. al introduced a variable transformation. The PF hemoglobin fraction is expressed by , where c is a real number and a base value. For transient flow problems, can be used as an initial value with at the inlet boundary. When defining C = κc, where κ is a scaling factor, Eq. (17) can be rewritten in the following form:
| (19) |
| (20) |
In this study, we use Eq. (20) instead of Eq (17) to compute fHb. Eq. (20) is discretized and solved with LSFEM as introduced in Sec. 2.2; for details refer to [8].
2.4. Comparison between stress- and strain-based models
In the following, we treat the amount of hemoglobin fHb as a field variable, like velocity and pressure in general CFD analyses. The value of fHb can be estimated from two different models. Both stress- and strain-based models depend on the flow field inside the device that is computed from Eqs. (3) and (4). However, the way to estimate the scalar shear stress σs in Eq. (18) is different for both models.
In the stress-based model, the scalar shear rate is a direct function of the rate of strain tensor E, i.e., , where IIE is the second invariant of E. Then the scalar shear stress becomes:
| (21) |
In the strain-based model, we use the shape tensor S, which represents the shape of a RBC. When the RBC is distorting under a given flow field, S is used to estimate an equivalent shear rate. In steady shear flow with shear rate Gf, the distortion D of the shape tensor S can be defined as: (cf. [4])
| (22) |
where L and B are the largest and smallest semi-axial lengths of S that can be computed from the maximum and minimum eigenvalues of the tensor S, respectively. Note that f1 and f2 are the parameters used in the tensorial evolution equation (8). Based on Eq. (22), the effective shear rate Geff can be derived by:
| (23) |
This effective shear rate can be used in any situation including transient flows. However, Geff becomes equivalent to Gf only if the flow becomes steady state. Using Eq. (23), the scalar shear stress of the strain-based model can be expressed as:
| (24) |
As is clear from the preceding discussion, the strain-based model is equivalent to the stress-based model under homogeneous steady shear flow conditions, i.e., a constant shear rate everywhere. However, the estimations from both models become different when the flow field is transient, or even in steady but inhomogeneous cases, i.e., when the shear rate varies spatially. This difference comes from the fact that the strain-based model considers the shape distortion and relaxation of the viscoelastic membrane of the RBC, whereas the stress-based model assumes that the shape of the RBC conforms to a given flow field immediately; the latter assumption can be unrealistic under physiological conditions.
3. SIMULATION SET-UP
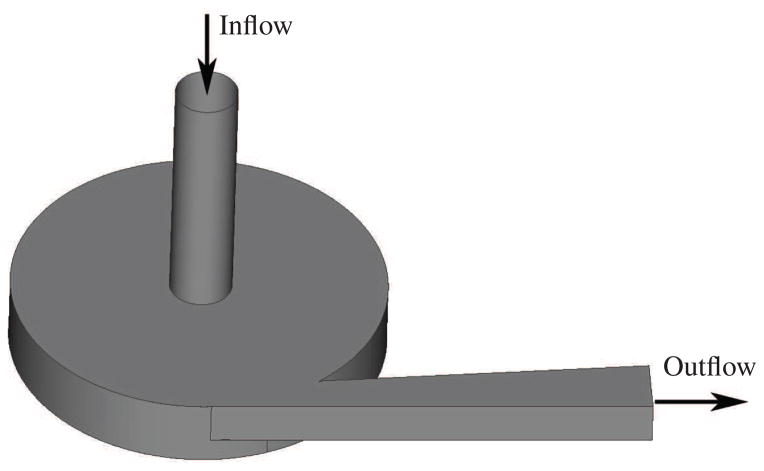
For the comparison of the stress- and strain-based models, we choose a simplified blood pump geometry, shown in Fig. 1. The geometry of the pump is designed to be simple but to still contain most of the flow characteristics of a real VAD. The flow chamber is assumed to be completely levitated without any bearings connected to the impeller. The pump’s inflow is a circular tube with 10 mm in diameter and 40 mm in length. The outflow is a rectangular channel and has an initial surface area of 6.2 mm × 7 mm and a maximum surface area of 9.9 mm × 7 mm. Inflow and outflow are connected to the circular outer housing which has a radius of 30 mm and a height of 11 mm. The impeller is a cylindrical plate with four straight blades attached to it. The outer radius of the impeller measures 28.5 mm, leading to a gap of 1.5 mm between impeller and housing. The dimensions of the four blades can be taken from Fig. 2. All the radii used to round edges are 1 mm. The blades are designed similar to a test geometry under development by the U.S. Food & Drug Administration (FDA) for the next stage of the computational interlaboratory study [13].
Figure 1.
Geometry of the simplified blood pump.
Figure 2.
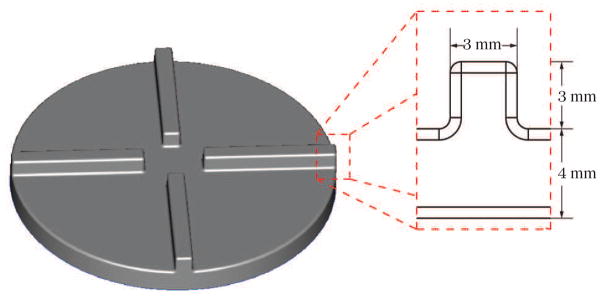
Impeller and blade dimensions of the simplified blood pump.
We operate the blood pump at three different hydraulic parameter sets which are listed in Table I. A useful measure for the flow properties in a blood pump are the maximum Reynolds number at the inflow and the maximum Reynolds number for the impeller region [2]. The inflow Reynolds number and impeller Reynolds number are defined here by Rein = ρv̄indin/μb and , respectively. Blood density and dynamic viscosity are chosen as ρ = 1058 kg/m3 and μb = 3.5 × 10⁻³ Pa s, while v̄in is the mean velocity at the inflow, din is the diameter of the inflow pipe, ω is the rotational speed of the impeller, and rimp is the radius of the impeller. According to [2], the Reynolds numbers predict laminar flow for the 0.5 L and 2 L cases and also for the impeller region in the 5 L case, we do not apply a turbulence model within this study, even though turbulence might affect the flow field in the inflow tube and the outflow channel of the 5 L case.
Table I.
Hydraulic operating conditions of the blood pump.
| Flow rate | Rotational speed | Rein | Reimp |
|---|---|---|---|
| 0.5 L/min | 1000 rpm | 320 | 51395 |
| 2 L/min | 2000 rpm | 1282 | 102790 |
| 5 L/min | 3000 rpm | 3203 | 154185 |
As mentioned in Sec. 2.1, the blood flow is computed by the DSD/SST finite element approach. For the impeller rotation we use the shear-slip mesh update method (SSMUM) [14, 15]. Both methods were used successfully in several large-scale applications, e.g., in hydraulic performance analyses of the GYRO centrifugal blood pump [16]. The discretization is using 1, 054, 431 mainly unstructured, tetrahedral elements and 385, 368 space-time nodes. Only on top of the impeller, a thin layer with structured elements is generated to treat the rotation of the impeller with the SSMUM (cf. Fig. 3). For the inflow boundary of the pump, we apply a constant parabolic velocity profile. The velocity magnitude is determined by the given flow rate. At the outflow boundary, an open boundary condition is chosen [17], because the flow field may not be fully developed. The time step sizes Δt differ in all three cases, because the simulations are set up in such a way that one revolution of the impeller is performed within 300 time-steps. Thus, the time-step sizes result in Δt1 = 2 × 10⁻⁴ s, Δt2 = 1 × 10⁻⁴ s, and Δt3 = 6.67 × 10⁻⁵ s for 1000 rpm, 2000 rpm, and 3000 rpm, respectively.
Figure 3.
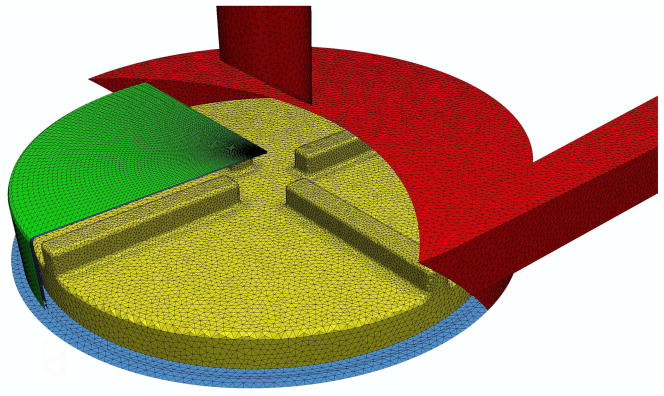
Finite element mesh showing a portion of the shear-slip mesh along with the surface mesh of the blood pump.
To let the flow field inside the pump develop, the flow solution is computed for six revolutions of the impeller. Then, the solution of the last revolution is used for the computation of fHb and S. These field variables have to develop inside the pump as well, which again requires several revolutions of the pump, until a periodic solution is reached. We assume steady-state deformation of S and fHb = 0 at the inlet of the pump.
We analyze the blood damage generated by the pump with the widely used normalized index of hemolysis (NIH). The value is directly converted from fHb according to [5]:
| (25) |
where Hct is the blood hematocrit (45% for a healthy person) and κc is the hemoglobin content of blood (150 g/L for a healthy person). Note that is used for the evaluation of the NIH since Eq. (1) is linearized in time [6, 7].
4. RESULTS
4.1. Flow prediction
We compute three different flow rates through the pump: 0.5 L/min, 2 L/min, and 5 L/min. The predicted mean pressure heads for these three cases are summarized in Table II. Due to the four impeller blades, the pressure heads oscillate with approximately four peaks per single revolution. The resulting maximum amplitudes of these oscillations are indicated in Table II as well.
Table II.
Computed pressure heads of the blood pump.
| Flow rate | Rotational speed | Mean pressure head |
|---|---|---|
| 0.5 L/min | 1000 rpm | 28 ± 8 mmHg |
| 2 L/min | 2000 rpm | 102 ± 18 mmHg |
| 5 L/min | 3000 rpm | 199 ± 41 mmHg |
4.2. Stress-based model
The stress-based model uses the instantaneous fluid shear rate Gf according to Eq. (21). Since the blood damage, i.e. fHb, is directly correlated to the flow field, faster impeller rotations lead to higher shear rates and thus, more blood damage.
For visualization purposes, we have chosen a cut plane which is located 1.5 mm above the impeller blades. Figures 4(a), 5(a) and 6(a) show the Gf values for such a cut plane. As expected, the highest shear rates appear close to the outer housing due to the high velocity gradients in this region. Additional regions with high shear rates are visible close to the blades and in the outflow channel. Although the shear rate peaks are quite localized, the overall NIH concentration is homogeneously distributed in all three cases, cf. Figures 4(b), 5(b) and 6(b). Only small effects of the blades are visible around the center of the pump. This smoothing can be attributed to the intensive mixing in the pump. The strength of the estimated hemolysis generation, however, differs significantly between the cases. This difference is due to the increasing shear rate.
Figure 4.
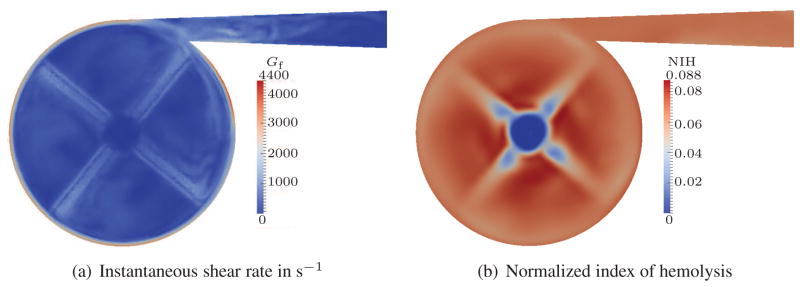
Quasi-steady results for 0.5 L/min flow rate; stress-based.
Figure 5.
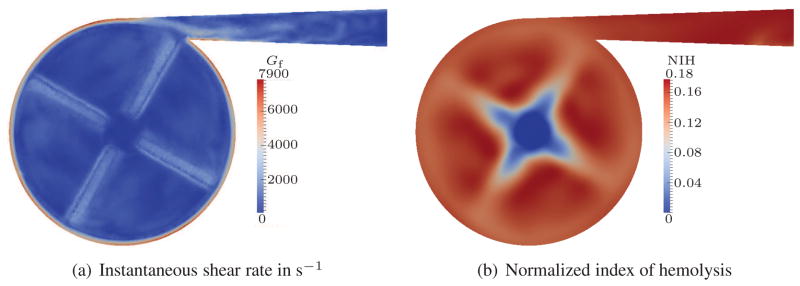
Quasi-steady results for 2 L/min flow rate; stress-based.
Figure 6.
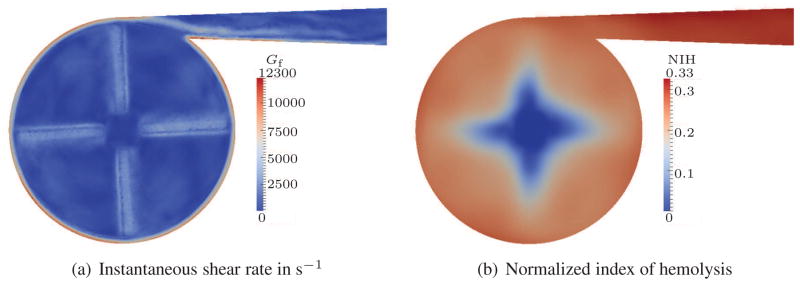
Quasi-steady results for 5 L/min flow rate; stress-based.
To simplify the comparison of the overall NIH concentration, we integrate the NIH over the outflow surface and take the time average for one revolution of the pump. With the aid of such an averaging, we can summarize that the stress-based model predicts average NIH values of approx. 0.064, 0.17 and 0.31 for the 0.5 L, 2 L and 5 L cases, respectively. This is a dramatic increase of NIH between these three cases and an overestimation is expected in all of the results.
In a recent work, Taskin et al. [18] studied the stress-based model for different parameter correlations, including the one from Giersiepen et al., for a centrifugal blood pump. Qualitatively, their results seem to be in good agreement to our simulations. In their predictions, the index of hemolysis is growing for faster rotational speeds as well and has a comparable order of magnitude.
4.3. Strain-based model
For the strain-based model, the scalar shear stress is computed based on the effective shear rate Geff that is a function of the RBC shape. Since the residence time of RBCs is of the same order of magnitude as the relaxation time of a RBC, the relaxation of the RBC membrane could dramatically influence the shape distortion of RBCs and hence the blood damage. In this section, we analyze each of the three cases individually using the same cut plane as described in Sec. 4.2.
For the 0.5 L case, the computed results of the effective shear rate Geff and the NIH are presented in Fig. 7. The distribution of Geff is not as localized as Gf seen earlier in Fig. 4(a). In particular, the large gradients in fluid shear rate in the gap between impeller and housing are flattened when the RBC shape is considered, i.e., Geff does not change dramatically. In this case, the highest Geff values appear in the outflow channel, but the values are small when compared to Gf. Therefore, the predicted blood damage based on NIH is reduced significantly.
Figure 7.

Quasi-steady results for 0.5 L/min flow rate; strain-based.
The results of the 2 L case are presented in Fig. 8. Compared to the 0.5 L case, the behavior changes. The highest Geff values still appear in the outflow, but also in the interior of the pump high effective shear stresses are predicted. Overall, the Geff values are still low and therefore, the highest hemolysis appears close to the high shear region of the inflow tube. This is a consequence of the steady-state boundary condition of S (cf. Sec. 3) at the inflow.
Figure 8.

Quasi-steady results for 2 L/min flow rate; strain-based.
Interestingly, for the 5 L case the strain-based model predicts lower effective shear stresses than the 2 L case. Here, Geff is dominated by the inflow tube and also high at the outflow, but in the interior of the pump low values are predicted. Therefore, the overall hemolysis which is generated in the pump becomes lower compared to the 2 L case, although the instantaneous shear stress is higher due to the increased rotation speed of the impeller.
The averaged NIH values predicted by the strain-based model are approx. 1.9 × 10⁻⁵, 1.5 × 10⁻⁴ and 7.2 × 10⁻⁶ for the 0.5 L, 2 L and 5 L cases, respectively.
4.4. Residence Time
One drawback of the Eulerian approach compared to the Lagrangian approach is the more difficult computation of the residence time. The residence time, however, helps to understand the behavior of the strain-based model. More precisely, it helps to understand why the strain-based model shows decreasing rates of hemolysis from the 2 L/min to the 5 L/min case, whereas the stress-based approach shows increasing rates.
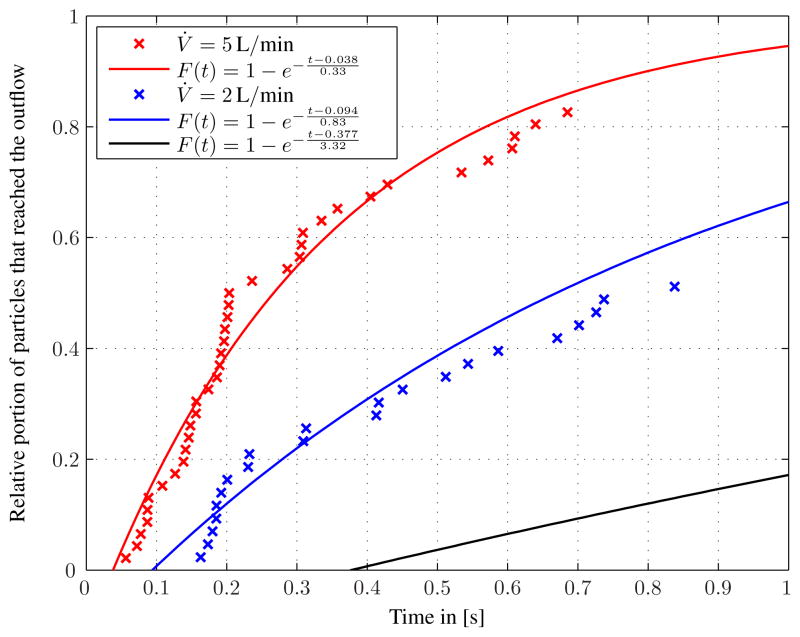
As a post-processing step, we estimate the residence times of RBCs in the blood pump for 5 L/min and compare the data with the 2 L/min case. The residence times can be predicted numerically by tracing the position of several particles in the blood pump. We compute the trace of the particles from inflow to outflow and evaluate the residence time. However, such a particle tracing is computationally very expensive, and some traces can fail to terminate during the computation due to, e.g., stagnation points. For our case, an analytical model by means of the theory of idealized chemical reactors [19] turned out to be a useful alternative to particle tracing. The mean residence time can be given by t̄= V/V̇, where V is the volume of the pump and V̇ the flow rate. The relative portion of particles that leave the pump is then computed by the following relation:
| (26) |
where tin is the residence time in the inflow pipe (see Tab. III).
Table III.
Computed residence times.
| Flow rate | Mean residence time | Residence time in the inflow |
|---|---|---|
| 0.5 L/min | t̄ = 3.31 s | tin = 0.377 s |
| 2 L/min | t̄= 0.83 s | tin = 0.094 s |
| 5 L/min | t̄= 0.33 s | tin = 0.038 s |
The numerical and the analytical approaches are compared in Fig. 10. The analytical model matches the traced particles with acceptable accuracy. It seems to be a reasonable scheme to estimate residence time, especially when particle tracing requires a large amount of computing time.
Figure 10.
Estimated residence times from analytic equation and particle tracing.
From the estimation, the residence times for the 5 L case are considerably lower than for the 2 L case. Almost 40 % of the particles leave the pump after 0.2 s, which is approximately the relaxation time of the RBC membrane. Therefore, one can conclude that the exposure time is not long enough to significantly stretch or otherwise distort the RBCs in the blood pump for the largest flow rate case.
5. CONCLUSION AND OUTLOOK
Computational predictions of blood damage were performed for three operating conditions of a centrifugal blood pump. The computed transient flow fields were used to estimate blood damage from two different models over several revolutions of the pump. Average NIH values, an indicator for the blood damage, were evaluated over time for the last revolution of each simulation. The stress-based model predicted monotonically increasing NIH values with respect to increasing impeller rotation speed. An overestimation of the rate of hemolysis can be expected in all three cases for this model. When the strain-based model is used, however, the predicted hemolysis generation reduces significantly. Interestingly, the case with medium flow rate and rotation speed (2 L/min and 2000 rpm) led to the highest NIH values, whereas for the highest flow rate and rotation speed (5 L/min and 3000 rpm) NIH decreased. Further analyses revealed that for the 5 L case the average residence time of an RBC in the pump is of the order of the characteristic deformation time of the RBC. In the strain-based model, the RBC shape takes a time to conform to a given flow field and the scalar shear stress is a direct function of the RBC distortion. Therefore, the NIH values are reduced significantly when the exposure time is not long enough. In estimating residence time, the theory of idealized chemical reactors turned out to provide a useful measure.
The strain-based model considers biophysical aspects of an RBC, i.e., shape deformation and relaxation, in blood damage estimation. The viscoelastic deformation of an RBC can affect the amount of hemoglobin release. The stress-based model, which implicitly assumes that RBCs deform immediately, can potentially overpredict the blood damage. According to our results for the blood pump, the residence time is a critical factor for the blood damage prediction, since residence time can significantly affect the shape distortion of an RBC. Considering the fact that most blood pumping devices aim towards high flow rates, the residence time will be small and the stress-based model is likely to overpredict damage. Therefore, the strain-based model is a useful tool for the design of hemo-compatible devices. Nevertheless, it needs further calibration.
There is room for other improvements. Mesh convergence has not been shown within this study, since fully unsteady simulations are costly and the focus of this paper is the direct comparison of the stress- and strain-based models. We expect that the mesh is fine enough to solve for the shape tensor and hemoglobin concentration, but the flow solution may change slightly if the mesh is refined, therefore, influencing the results for the NIH.
A comparison with experimental data would be very helpful to further calibrate our model. Recently, Zhang et al. [20] published a new parameter set for the power law model which would be interesting to apply to our method.
Figure 9.

Quasi-steady results for 5 L/min flow rate; strain-based.
Acknowledgments
We would like to thank Hanna Thaeren and Lukas Hewing for performing some of the simulations within this study. This work was partially supported by Grant N. R01HL085054 awarded to Texas Heart Institute (THI) by the National Heart, Lung, and Blood Institute (NHLBI) and by the National Science Foundation of the USA under grant DMS-0811160. Computing resources were provided by the RWTH Aachen University Center for Computing and Communication and by the Forschungszentrum Jülich John von Neumann Institute for Computing.
References
- 1.Behbahani M, Behr M, Hormes M, Steinseifer U, Arora D, Coronado O, Pasquali M. A review of computational fluid dynamics analysis of blood pumps. European Journal of Applied Mathematics. 2009;20(4):363–397. [Google Scholar]
- 2.Fraser K, Taskin M, Griffith B, Wu Z. The use of computational fluid dynamics in the developement of ventricular assist devices. Medical Engineering & Physics. 2011;33:263–280. doi: 10.1016/j.medengphy.2010.10.014. [DOI] [PMC free article] [PubMed] [Google Scholar]
- 3.Giersiepen M, Wurzinger L, Opitz R, Reul H. Estimation of shear stress-related blood damage in heart valve prostheses - in vitro comparison of 25 aortic valves. The International Journal of Artificial Organs. 1990;13(5):300–306. [PubMed] [Google Scholar]
- 4.Arora D, Behr M, Pasquali M. A tensor-based measure for estimating blood damage. Artificial Organs. 2004;28:1002–1015. doi: 10.1111/j.1525-1594.2004.00072.x. Errata in Artificial Organs 2012, 36(5):500. [DOI] [PubMed] [Google Scholar]
- 5.Arora D, Behr M, Pasquali M. Hemolysis estimation in a centrifugal blood pump using a tensor–based measure. Artificial Organs. 2006;30(7):539–547. doi: 10.1111/j.1525-1594.2006.00256.x. [DOI] [PubMed] [Google Scholar]
- 6.Farinas M, Garon A. Fast three-dimensional numerical hemolysis approximation. Artificial Organs. 2004;28 (11):1016–1025. doi: 10.1111/j.1525-1594.2004.00026.x. [DOI] [PubMed] [Google Scholar]
- 7.Farinas MI, Garon A, Lacasse D, N’dri D. Asymptotically consistent numerical approximation of hemolysis. Journal of Biomedical Engineering. 2006;128 doi: 10.1115/1.2241663. [DOI] [PubMed] [Google Scholar]
- 8.Nam J, Behr M, Pasquali M. Space-time least-squares finite element method for convection-reaction system with transformed variables. Computer Methods in Applied Mechanics and Engineering. 2011 Jan;200:14. doi: 10.1016/j.cma.2011.04.015. [DOI] [PMC free article] [PubMed] [Google Scholar]
- 9.Tezduyar T, Behr M, Liou J. A new strategy for finite element computations involving moving boundaries and interfaces – the deforming-spatial-domain/space-time procedure: I. The concept and the preliminary tests. Computer Methods in Applied Mechanics and Engineering. 1992;94(3):339–351. [Google Scholar]
- 10.Tezduyar T, Behr M, Mittal S, Liou J. A new strategy for finite element computations involving moving boundaries and interfaces – the deforming-spatial-domain/space-time procedure: II. Computation of free-surface flows, two-liquid flows, and flows with drifting cylinders. Computer Methods in Applied Mechanics and Engineering. 1992;94 (3):353–371. [Google Scholar]
- 11.Maffettone P, Minale M. Equation of change for ellipsoidal drops in viscous flow. Journal of Non-Newtonian Fluid Mechanics. 1998;78:227–241. [Google Scholar]
- 12.Pasquali M, Scriven L. Free surface flows of polymer solutions with models based on the conformation tensor. Journal of Non-Newtonian Fluid Mechanics. 2002;108:363–409. [Google Scholar]
- 13.Steward S, Paterson E, Burgreen G, Hariharan P, Giarra M, Reddy V, Day S, Manning K, Deutsch S, Bergman M. Assessment of CFD performance in simulations of an idealized medical device: Results of FDA’s first computational interlaboratory study. Cardiovascular Engineering and Technology. 2012:1–22. [Google Scholar]
- 14.Behr M, Tezduyar T. Shear-slip mesh update in 3D computation of complex flow problems with rotating mechanical components. Computer Methods in Applied Mechanics and Engineering. 2001;190:3189–3200. [Google Scholar]
- 15.Behr M, Arora D. Shear-slip mesh update method: Implementation and applications. Computer Methods in Applied Mechanics and Engineering. 2003;6:113–123. doi: 10.1080/1025584031000091650. [DOI] [PubMed] [Google Scholar]
- 16.Behr M, Arora D, Nosé Y, Motomura T. Performance analysis of ventricular assist devices using finite element flow simulation. International Journal for Numerical Methods in Fluids. 2004;46(12):1201–1210. [Google Scholar]
- 17.Papanastasiou T, Malamataris N, Ellwood K. A new outflow boundary condition. International Journal for Numerical Methods in Fluids. 1992;14:587–608. [Google Scholar]
- 18.Taskin M, Fraser K, Zhang T, Wu C, Griffith B, Bartley P, Wu Z. Evaluation of Eulerian and Lagrangian models for hemolysis estimation. ASAIO Journal. 2012;58(4):363–372. doi: 10.1097/MAT.0b013e318254833b. [DOI] [PubMed] [Google Scholar]
- 19.Froment G, Bischoff K, Wilde JD. Chemical reactor analysis and design. Vol. 3. Wiley; New York: 2010. [Google Scholar]
- 20.Zhang T, Taskin M, Fang H, Pampori A, Jarvik R, Griffith B, Wu Z. Study of flow-induced hemolysis using Novel Couette-type blood-shearing devices. Artificial Organs. 2011;35(12):1180–1186. doi: 10.1111/j.1525-1594.2011.01243.x. [DOI] [PubMed] [Google Scholar]


