

Abstract
Rationale and Objectives
Breast dynamic contrast enhanced (DCE) MRI scanning protocols vary widely. The purpose of this study was to determine the effects of post-contrast timing on delayed-phase lesion kinetics assessment and ability to discriminate malignant from benign lesions.
Materials and Methods
Following IRB approval, we retrospectively reviewed all lesions assessed on MR examinations from 4/2005 to 6/2006. DCE-MRI was performed with 90 seconds temporal resolution. Delayed-phase kinetic parameters including percentages of persistent, plateau, and washout, and categorizations of predominant and worst curve type were compared between 4.5 and 7.5 minutes post-contrast. Ability to discriminate benign and malignant lesions based on delayed-phase kinetic parameters was compared between post-contrast timings by receiver operating characteristic (ROC) analysis.
Results
280 consecutive breast lesions (206 malignant, 74 benign) were evaluated in 228 women. Comparing kinetics assessments at 7.5 versus 4.5 minutes: volume percentage of washout increased in malignancies by a mean of 9.4% (p<0.0001) and increased slightly in benign lesions (mean 3.2%, p=0.007); predominant curve type categorizations changed significantly only for malignancies (p<0.0001); and worst curve categorizations did not change significantly for either benign or malignant lesions (p>0.05). There were no significant differences between timings in area under ROC curves for delayed-phase kinetic parameters.
Conclusion
The choice of delayed post-contrast timing more strongly affects the kinetics assessments for malignancies than benign breast lesions, but our results suggest a shortened breast DCE-MRI protocol may not significantly impact diagnostic accuracy. Furthermore, worst curve type classifications are least affected by post-contrast timing and may provide reliable assessment of delayed phase kinetics across protocols.
Keywords: breast cancer, magnetic resonance imaging (MRI), dynamic contrast-enhanced MRI (DCE-MRI), kinetic analysis, post-contrast timing, differential diagnosis
INTRODUCTION
Dynamic contrast-enhanced magnetic resonance imaging (DCE-MRI) is an important tool for screening high-risk women, evaluating extent of disease in patients with newly diagnosed breast cancer, and monitoring breast tumors during neoadjuvant treatment (1–3). DCE-MRI provides sensitive and moderately specific characterization of breast lesions when used in conjunction with the American College of Radiology (ACR) MRI Breast Imaging-Reporting and Data System (BI-RADS) lexicon to assess lesion morphology and initial and delayed enhancement patterns (4). In addition to established diagnostic morphologic features such as margin and distribution (5), DCE-MRI enhancement kinetics have been reported to improve delineation between benign and malignant lesions in multiple studies (6–8).
The shape of the time–signal intensity curve is an important measure in characterizing enhancing lesions (7), and computer aided evaluation of enhancement kinetics improves diagnostic accuracy (9, 10). For standardized reporting and as recommended by the ACR BI-RADS lexicon, enhancement of breast lesions is defined by initial phase and delayed phase enhancement. Initial phase enhancement is classified as slow, medium, or rapid depending on the slope of the line from time zero (at the time of contrast injection) to the peak enhancement within the first two minutes. Delayed enhancement is classified as persistent (increasing), plateau (stable), or washout (decreasing) curve types (4). In general, a washout curve has been shown to be a strong independent predictor of malignancy in prior studies, with Kuhl et al. reporting cancer in 87% of lesions with any washout (7) and Schnall et al. identifying malignancy in 76% of such lesions (8).
While DCE-MRI has gained widespread use for breast imaging, there is no widely accepted protocol for obtaining images. Although the ACR breast MRI accreditation program (11) has now established minimum standards for technical parameters, the guidelines allow for differing imaging protocols. Institutions vary with respect to the temporal resolution and number of post-contrast acquisitions (12). The ACR BI-RADS MRI Manual states that an initial post contrast scan should be performed within 2 minutes of contrast injection and delayed phase scanning should be performed after 2 minutes or after the curve starts to change (4). However, the optimal number of intervals and timing of the last post-contrast scan are not suggested. The recent ACR breast MRI accreditation guidelines specify only that a pre and at least two post contrast scans be obtained, with the initial post-contrast scan completed within 4 minutes of contrast injection (11). Moreover, the European Society of Breast Imaging recommends at least two scans after contrast and adds the optimal number is unknown (13).
In particular, the post-contrast timing could affect the delayed phase curve type classification and resulting diagnostic accuracy: assessing too early may fail to adequately demonstrate washout in malignant lesions, while assessing too late may over-emphasize washout kinetics in benign lesions. One breast MRI resource recommends post-contrast imaging should extend for at least 6 minutes after the end of contrast injection (14). However, to our knowledge, there have been no studies evaluating the optimal timing of delayed post-contrast imaging for discriminating benign and malignant suspicious lesions. At many institutions, there is motivation to shorten scan protocols for throughput as well as patient comfort. However, there is no clear definition of how short is ‘too short’ for accurate DCE-MRI post-contrast assessments. We therefore sought to determine whether using a shorter DCE-MRI protocol negatively impacts ability to discriminate malignant from benign lesions by comparing semi-quantitiative lesion kinetics assessments evaluated at an earlier (4.5 minutes) versus later (7.5 minutes) post-contrast time point.
MATERIALS AND METHODS
Institutional review board (IRB) approval was obtained and the study was Health Insurance Portability and Accountability Act (HIPAA) compliant. Patient consent for this retrospective study was waived by the IRB.
Patients and Lesions
Our retrospective study included all consecutive breast lesions demonstrated on MR imaging (BI-RADS 3, 4, 5, and 6) at our institution from April 2005 through June 2006 that had automatically generated computer aided evaluation (CAE) kinetic synopses (described below) and a confirmed outcome. Histopathologic outcomes were classified as benign or malignant based on tissue-sampling and/or follow-up at our institution and linkage to the regional Cancer Surveillance System (CSS) tumor registry. A final lesion diagnosis of invasive breast carcinoma or ductal carcinoma in situ (DCIS) at our institution or in the tumor registry within 12 months of the index MR examination constituted a malignant outcome. A benign outcome was defined by: 1) evidence of a benign biopsy supported by the absence of a malignant diagnosis in the tumor registry within 12 months of the index MR examination, 2) a benign ultrasound correlate at our institution within 12 months, and/or 3) a benign follow-up MRI at our institution within 18 months. Patients receiving neoadjuvant chemotherapy at the time of MRI were excluded.
Breast MRI Technique
All study examinations were performed on a GE LX 1.5T scanner (General Electric Medical Systems, Milwaukee, WI) with the patient in a prone position using a dedicated eight-channel breast coil. The MR protocol was consistent with the guidelines established by the International Breast MRI Consortium (IBMC) and by the ACR Imaging Network (ACRIN) MRI trials. Axial imaging of both breasts was performed with a field of view (FOV) of 32–36 cm for all sequences. A three-plane localizer sequence was first obtained. Next, a T2-weighted 2D fast spin echo (FSE) sequence with fat suppression was acquired, with echo time (TE) = 85 ms, repetition time (TR) = 5500 ms, frequency by phase encoding matrix of 320 × 256, 1.1 × 1.4 mm in plane resolution and 3mm slice thickness. A pre-contrast T1-weighted 3D fast spoiled gradient echo (FSPGR) sequence without fat suppression was acquired, followed by pre-contrast and multiple post-contrast T1-weighted 3D FSPGR sequences with fat suppression, with imaging parameters of TR = 6.2 ms, TE = 3 ms, flip angle = 10°, and frequency by phase encoding matrix of 350 × 350, 1 × 1 mm in plane resolution and 2.2mm slice thickness. Temporal resolution was 90 seconds and dynamic imaging began 45 seconds after contrast injection, with five sequential post-contrast scans obtained, Figure 1. The contrast agent was gadodiamide, (Omniscan, Mallinckrodt, Inc., Hazelwood, MO) with 0.1 mmol/kg power injected intravenously at a rate of 2.0 cc/second followed by 20cc saline flush.
Figure 1.

Schematic showing DCE-MRI series acquisition protocol. Five post-contrast scans were acquired, each requiring 90 seconds. The first post-contrast scan was begun 45 seconds after initiation of contrast injection in order to center k-space at 1.5 minutes post-contrast. Pre-contrast, initial and delayed contrast-enhanced scans were incorporated into computer-aided evaluation software with centering of k-space 1.5 minutes and either 4.5 or 7.5 minutes after contrast injection.
Initial Interpretation
Examinations were prospectively interpreted by one of four fellowship-trained radiologists specialized in breast imaging, all with breast MRI experience. Each lesion was assessed using the ACR BI-RADS Breast MRI Lexicon incorporating morphologic and kinetic features. Lesion characteristics including CAE data (described in detail below) evaluated at 4.5 minutes post-contrast were recorded at the time of interpretation. This information was entered into our existing MRI database and analyzed for this study.
CAE and Kinetic Data
All examinations were processed using a commercially available CAE software system (CADstream version 3.0, Confirma, Bellevue, WA). The CAE program compares voxel signal intensity values on the pre-contrast and initial post-contrast scans (centered at 1.5 minutes). For voxels meeting the initial enhancement threshold (50%), delayed-phase enhancement characteristics are calculated using the delayed post-contrast scan (4.5 minutes or 7.5 minutes for this study). As demonstrated in Figure 2, voxels on the delayed scan decreasing by more than 10% compared with the initial post-contrast scan are color-coded red for washout; voxels increasing by more than 10% are color-coded blue for persistent enhancement; voxels changing less than 10% are color-coded green for plateau enhancement. Contiguous regions of enhancement are summed and constitute a lesion, such as the example in Figure 2b. Details of the CAE analysis approach have been previously described [Wang, Gutierrez].
Figure 2.
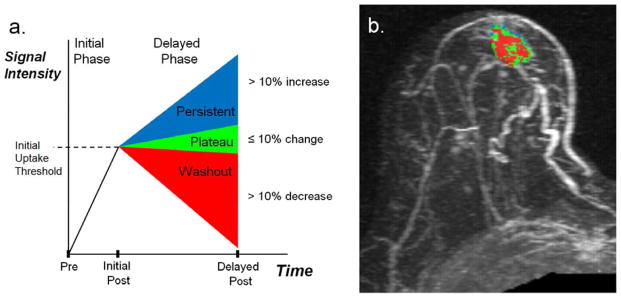
Process for characterization of DCE-MRI early and delayed phase enhancement patterns. Shown are (a) the enhancement criteria definitions and (b) example of lesion characterization in a 60-year-old female with a new diagnosis of a subareolar infiltrating ductal carcinoma in the right breast. (a) Initial Phase: Initial peak enhancement, defined as change in signal intensity between the pre-contrast and initial post-contrast sequence centered at 1.5 minutes post-contrast. Delayed Phase: Change in signal intensity between initial and delayed post-contrast sequence (4.5 or 7.5 minutes); defined as persistent enhancement (labeled blue) if signal intensity increases more than 10% or as washout enhancement (labeled red) if signal intensity decreases by more than 10%. A 10% or less change in delayed signal intensity is defined as plateau enhancement (labeled green). (b) DCE-MRI kinetics color overlay map where tumor voxels demonstrate peak initial enhancement greater than 50%, and the percentage of tumor voxels demonstrating persistent enhancement (blue) is 12%, plateau enhancement (green) is 43%, and washout enhancement (red) is 45%. Predominant curve type is washout; worst curve type is washout.
Lesions included in this study were those with automatically generated CAE kinetic synopses, requiring initial enhancement above a specified minimum threshold of a 50% or greater increase in voxel signal intensity on the initial post-contrast scan compared with the pre-contrast scan (designated initial enhancement). For each lesion, the CAE analysis was performed using two different delayed time points, an earlier time point centered at 4.5 minutes and a later time point centered at 7.5 minutes post-contrast, Figure 2. The 4.5 minute CAE variables were those prospectively collected during initial interpretations. For the study, each case was retrospectively reprocessed to obtain the 7.5 minute CAE variables.
Data Collection
Delayed phase kinetic variables were recorded from the CAE synopses for each lesion, including: volume percentages of persistent, plateau, and washout, predominant curve type defined as that comprising the largest percentage of the lesion (washout, plateau, or persistent), and the single most suspicious curve type, represented by one or more voxels in the lesion, (any washout > any plateau > any persistent) (9).
Statistical Analysis
Lesion percentages of persistent, plateau, and washout curve types were compared between protocols for all lesions (BI-RADS 3, 4, 5, and 6) by Wilcoxon signed-rank test. Similarly, predominant and worst curve type classifications for each lesion were compared between protocols using the Chi-square and Fisher’s exact tests. Differences in enhancement patterns between 4.5 and 7.5 minute timings were further evaluated by Bland-Altman analysis and presented separately for benign and malignant lesions. Receiver operating characteristic (ROC) analysis was performed to calculate the diagnostic accuracy of delayed phase kinetics parameters based on area under the curve (AUC) for differentiating benign and malignant lesions, and to compare AUCs at 4.5 versus 7.5 minutes post-contrast for each parameter (15). A p value of less than or equal to 0.05 was considered significant. Analyses were conducted using SAS/STAT software, version 9.1 (SAS Institute, Inc., Cary, NC), and Medcalc version 10.4.5.0 (Medcalc Software, Mariakerke, Belgium) was used for ROC analyses.
RESULTS
Patients and Lesions
A total of 280 lesions were identified in 229 examinations in 228 patients. Patient and lesion characteristics are described in Table 1. Patient ages ranged from 22 to 89 years (mean, 54 years). The primary clinical indication for breast MRI was for evaluation of extent of disease in a patient with known cancer in 173/229, high risk screening in 36/229, problem solving in 6/229, short term follow-up in 5/229, evaluation of implants in 2/229, and ‘other’ (including breast pain, nipple symptoms, palpable mass, metastatic axillary adenopathy with no known primary, further evaluation of an ultrasound finding) in 7/229 examinations. Of the 280 lesions, 74 were benign and 206 were malignant (171 were invasive cancer and 35 lesions were DCIS).
Table 1.
Patient and lesion characteristics.
| Characteristic | N (%) |
|---|---|
| Age (N=228 patients) | |
| <40 years | 28 (12%) |
| 40–49 years | 59 (26%) |
| 50–59 years | 67 (29%) |
| 60–69 years | 47 (21%) |
| 70+ years | 27 (12%) |
| Lesion Characteristics (N=280 lesions) | |
| Lesion size | |
| < 1 cm | 78 (28%) |
| 1 cm – 2 cm | 82 (29%) |
| 2.1 cm – 5 cm | 80 (29%) |
| > 5 cm | 40 (14%) |
| Histopathology | |
| Benign | 74 (26%) |
| DCIS | 35 (13%) |
| IDC | 151 (54%) |
| ILC | 17 (6%) |
| Other malignancies ** | 3 (1%) |
| Lesion type | |
| Focus | 8 (3%) |
| Mass | 189 (68%) |
| Non-mass enhancement | 83 (30%) |
| ACR BI-RADS Classification | |
| BI-RADS 3 | 33 (12%) |
| BI-RADS 4 | 72 (26%) |
| BI-RADS 5 | 7 (3%) |
| BI-RADS 6 | 168 (60%) |
Other malignancies included pleomorphic spindle cell neoplasm (n=1) and infiltrating carcinomas not otherwise specified (n=2)
Lesion Delayed Enhancement Patterns
Lesion curve type volume percentages were compared between the two post-contrast time points. Examples comparing kinetics assessments at 4.5 and 7.5 minutes are shown for a malignant lesion in Figure 3 and benign lesion in Figure 4. A wide distribution of changes in volume percentages between timings were observed, with overall mean decreases in percentage plateau enhancement of −8.2% and −4.3% and increases in percentage washout of 9.4% and 3.2% for malignancies and benign lesions, respectively, Figure 5. One outlier identified on the Bland-Altman plots (arrow, Figure 5d, f) exhibited over 90% shift from persistent enhancement to washout. The kinetics assessments for this DCIS lesion are compared in Figure 6.
Figure 3.

85-year-old woman who underwent breast MRI screening due to personal history of breast cancer six years prior. A suspicious 16 mm enhancing lobular mass was detected in the central posterior left breast, which was proven to be invasive ductal carcinoma on MRI-guided biopsy. Shown are maximum intensity projections with DCE-MRI kinetics color-overlay demonstrating regions of persistent (blue), plateau (green), and washout (red) enhancement. (a) At 4.5-minutes post-contrast, the percentages of persistent, plateau, and washout enhancement were 26%, 59%, and 16%, respectively. Predominant curve type is plateau; worst curve type is washout. (b) At 7.5-minutes post-contrast, the percentages of persistent, plateau, and washout enhancement were 23%, 22%, and 55%, respectively. Predominant curve type is washout (changed from 4.5 minute assessment); worst curve type is washout.
Figure 4.

49-year-old woman with known invasive ductal carcinoma diagnosed in the left breast who underwent breast MRI for extent of disease evaluation. DCE-MRI demonstrated a 14 mm mass in the right breast that ultimately yielded benign pseudoangiomatous stromal hyperplasia and columnar cell change with atypia on biopsy. Shown are maximum intensity projections of the right breast with DCE-MRI kinetics color-overlay demonstrating regions of persistent (blue), plateau (green), and washout (red) enhancement. (a) At 4.5-minutes post-contrast, the percentages of persistent, plateau, and washout enhancement were 34%, 66%, and 0%. Predominant curve type is plateau; worst curve type is plateau. (b) At 7.5-minutes post-contrast, the percentages of persistent, plateau, and washout enhancement were 75%, 25%, and 0%. Predominant curve type is persistent (changed from 4.5 minute assessment); worst curve type is plateau.
Figure 5.

Comparison of individual curve type volume percentages measured at 4.5 versus 7.5 minutes post-contrast for benign (a–c) and malignant (d–f) lesions. Bland–Altman plots show the difference versus the mean for percentages of persistent enhancement (a, d), plateau enhancement (b, e), and washout (c, f). Dashed lines indicate 95% confidence intervals; solid line indicates mean difference. Plots represent differences between time points in percentages (a) persistent, (b) plateau, and (c) washout enhancement for benign lesions, and percentages (d) persistent, (e) plateau, and (f) washout enhancement for malignancies. A malignant outlier case (arrows; d, f) was a DCIS lesion that demonstrated a dramatic shift from predominantly persistent enhancement at 4.5 minutes to predominantly washout at 7.5 minutes, which is further illustrated in Figure 6.
Figure 6.

67-year-old woman with known ductal carcinoma in situ diagnosed in the right breast who underwent breast MRI for extent of disease evaluation. DCE-MRI demonstrated an 11 mm heterogeneous non-mass enhancement in the lower right breast corresponding to the biopsy proven DCIS. Shown are maximum intensity projections of the right breast with DCE-MRI kinetics color-overlay demonstrating regions of persistent (blue), plateau (green), and washout (red) enhancement. (a) At 4.5-minutes post-contrast, the percentages of persistent, plateau, and washout enhancement were 34%, 66%, and 0%, respectively. Predominant curve type is persistent; worst curve type is plateau. (b) At 7.5-minutes post-contrast, the percentages of persistent, plateau, and washout enhancement were 75%, 25%, and 0%, respectively. Predominant curve type is washout (changed from 4.5 minute assessment); worst curve type is washout.
While the observed shifts of percentages plateau to washout enhancement were significant for all lesion types (Table 2), the influence of timing was observed to be more dramatic in invasive cancers than DCIS or benign lesions. There was no significant difference in percentage of persistent enhancement between time points for any lesion type.
Table 2.
Lesion volume percentages of persistent, plateau and washout curve types compared at 4.5 and 7.5 minutes post-contrast
| Curve Types | N | 4.5 minutes median (range) |
7.5 minutes median (range) |
Wilcoxon Signed Rank test P-value |
|---|---|---|---|---|
|
| ||||
| Benign Lesions | 74 | |||
| Persistent | 70.5 (0–100) | 69.0 (0–100) | 0.48 | |
| Plateau | 19.5 (0–72) | 17.5 (0–71) | 0.002 | |
| Washout | 0.4 (0–99) | 0.3 (0–96) | 0.007 | |
|
| ||||
| Malignant Lesions | 206 | |||
| Persistent | 45.5 (0–100) | 45.0 (0–100) | 0.12 | |
| Plateau | 32.5(0–85) | 23.0 (0–66) | <0.0001 | |
| Washout | 12.0 (0–80) | 22.5 (0–98) | <0.0001 | |
|
| ||||
| Invasive Carcinoma | 171 | |||
| Persistent | 40.0 (0–100) | 36.0 (0–100) | 0.10 | |
| Plateau | 35.0 (0–85) | 23.0 (0–66) | <0.0001 | |
| Washout | 15.0 (0–80) | 27.0 (0–94) | <0.0001 | |
|
| ||||
| DCIS | 35 | |||
| Persistent | 73.0 (6–99) | 64.0 (1–98) | 0.75 | |
| Plateau | 23.0 (1–70) | 24.0 (1–52) | 0.03 | |
| Washout | 2.0 (0–52) | 8.0 (0–98) | 0.003 | |
Predominant Curve Type
Delayed-phase kinetics were further categorized according to predominant curve type, Table 3. Malignant lesions demonstrated significant differences in predominant curve type, (p<0.0001), with more malignant lesions exhibiting predominantly washout enhancement at 7.5 minutes post-contrast than at the earlier time point. On the other hand, benign lesions demonstrated no significant differences in predominant curve-types between post-contrast time points (p=0.35).
Table 3.
Predominant curve type classifications compared at 4.5 and 7.5 minutes post-contrast.
| Predominant Curve Types | N | 4.5 minutes N (%) |
7.5 minutes N (%) |
Chi-square P-value |
|---|---|---|---|---|
|
| ||||
| Benign Lesions | 74 | |||
| Persistent | 54 (73.0 %) | 55 (74.3%) | ||
| Plateau | 12 (16.2 %) | 7 (9.5%) | ||
| Washout | 8 (10.8 %) | 12 (16.2%) | 0.35 | |
|
| ||||
| Malignant Lesions | 206 | |||
| Persistent | 109 (52.9%) | 111 (53.9%) | ||
| Plateau | 64 (31.1%) | 27 (13.1%) | ||
| Washout | 33 (16.0%) | 68 (33.0%) | <0.0001 | |
|
| ||||
| Invasive Lesions | 171 | |||
| Persistent | 83 (48.5%) | 83 (48.5%) | ||
| Plateau | 56 (32.8%) | 24 (14.0%) | ||
| Washout | 32 (18.7%) | 64 (37.4%) | <0.0001 | |
|
| ||||
| DCIS Lesions | 35 | |||
| Persistent | 26 (74.3%) | 28 (80.0%) | ||
| Plateau | 8 (22.9%) | 3 (8.6%) | ||
| Washout | 1 (2.9%) | 4 (11.4%) | 0.14* | |
P-value calculated by Fischer’s Exact.
Worst Curve Type
Delayed-phase kinetics were also categorized according to worst curve type, Table 4. Differences in worst curve type assessments between the two post-contrast time points were not statistically significant for either benign or malignant lesions. Of note, 8/206 malignancies (5 invasive, 3 DCIS) exhibited washout only at 7.5 minutes.
Table 4.
Worst curve type classifications compared at 4.5 and 7.5 minutes post-contrast.
| Worst Curve Types | N | 4.5 minutes N (%) |
7.5 minutes N (%) |
Chi-square P-value |
|---|---|---|---|---|
|
| ||||
| Benign Lesions | 74 | 0.97 | ||
| Persistent | 12 (16.2%) | 13 (17.6%) | ||
| Plateau | 20 (27.0%) | 20 (27.0%) | ||
| Washout | 42 (56.8%) | 41 (55.4%) | ||
|
| ||||
| Malignant Lesions | 206 | 0.23* | ||
| Persistent | 2 (1.0%) | 3 (1.5%) | ||
| Plateau | 21 (10.2%) | 12 (5.8%) | ||
| Washout | 183 (88.8%) | 191 (92.7%) | ||
|
| ||||
| Invasive Lesions | 171 | 0.51* | ||
| Persistent | 2 (1.2%) | 3 (1.8%) | ||
| Plateau | 16 (9.4%) | 10 (5.9%) | ||
| Washout | 153 (89.5%) | 158 (92.4%) | ||
|
| ||||
| DCIS | 35 | ** | ||
| Persistent | 0 (0%) | 0 (0%) | ||
| Plateau | 5 (14.3%) | 2 (5.7%) | ||
| Washout | 30 (85.7%) | 33 (94.3%) | ||
P-value calculated by Fischer’s Exact.
Low numbers for DCIS precluded worst curve calculations.
Diagnostic Accuracy
At either time point, malignancies exhibited higher percentages of washout and more often demonstrated washout as the predominant and worst curve type than benign lesions (Tables 2–4). ROC analysis for distinguishing benign and malignant lesions based on delayed phase characteristics of percentage washout, predominant curve type, and worst curve type was performed for the full set of 280 lesions (BI-RADS 3, 4, 5 and 6) and for the subset of 112 MRI-detected lesions (BI-RADS 3, 4 and 5 only), Table 5. Area under the curve (AUC) values ranged from 0.60 to 0.72 for all lesions, Figure 7. There was no significant difference in AUC between the 4.5 and 7.5 minutes time points for any of the delayed phase characteristics (p>0.05), Table 5. In MRI-detected lesions, percentage washout showed a trend of increased AUC at 7.5 minutes that did not reach significance (p=0.08). Overall, characteristics of percentage washout and worst curve type provided comparable diagnostic accuracy at either timepoint, and were most predictive of malignancy. Predominant curve type provided the lowest diagnostic accuracy (lowest AUC).
Table 5.
Receiver operating characteristic (ROC) curve analysis.
| ROC Curve Comparison | 4.5 Minute Protocol | 7.5 Minute Protocol | P-Value | ||
|---|---|---|---|---|---|
| AUC | 95% C.I. | AUC | 95% C.I. | ||
| All lesions (N=280)* | |||||
| Percentage Washout | 0.70 | 0.64–0.75 | 0.72 | 0.66–0.77 | 0.27 |
| Predominant Curve | 0.60 | 0.54–0.65 | 0.61 | 0.55–0.67 | 0.65 |
| Worst Curve | 0.67 | 0.61–0.72 | 0.69 | 0.63–0.74 | 0.42 |
| MRI-detected lesions (N=112)** | |||||
| Percentage Washout | 0.64 | 0.54–0.73 | 0.70 | 0.60–0.78 | 0.08 |
| Predominant Curve | 0.56 | 0.46–066 | 0.59 | 0.50–.068 | 0.31 |
| Worst Curve | 0.63 | 0.53–0.72 | 0.68 | 0.58–0.76 | 0.13 |
All lesions: BI-RADS 3,4,5 and 6: n=206 malignant, n=74 benign
MRI-detected lesions: BI-RADS 3,4, and 5; n=38 malignant, n=74 benign
Figure 7.


ROC analysis for discriminating 280 breast lesions (206 malignant, 74 benign) based on delayed phase kinetics. Percentage washout curve type produced AUC of 0.70 (95% CI: 0.64 to 0.75) and 0.72 (95% CI: 0.66 to 0.77) at 4.5 and 7.5 minutes, respectively (a). Predominant curve type produced AUC of 0.60 (95% CI: 0.54 to 0.65) and 0.61 (95% CI: 0.55 to 0.67) at 4.5 and 7.5 minutes, respectively (b). Worst curve type produced AUC of 0.67 (95% CI: 0.61 to 0.72) and 0.69 (95% CI: 0.63 to 0.74) at 4.5 and 7.5 minutes, respectively (c). Differences in AUC between the 4.5 and 7.5 minute assessments were not significant for any of the delayed phase characteristics (p>0.05).
DISCUSSION
The results of our study show that choice of delayed post-contrast time point more strongly affects the kinetics assessments for invasive cancers than benign and DCIS lesions, but may not significantly impact the diagnostic ability of the DCE-MRI variables investigated. Multiple studies have investigated optimization of clinical breast DCE-MRI scan protocols in terms of temporal resolution and interval scan time length (16–19). To our knowledge this is the first study to investigate the effects of the final post-contrast scan time point on clinical delayed phase enhancement kinetic assessments. Optimizing post-contrast scan timings for clinical DCE-MRI protocols has implications for improving diagnostic performance through accurate characterization of enhancement kinetics, as well as reducing costs and improving patient comfort by minimizing overall examination times.
In comparison of 4.5 minutes and 7.5 minutes post contrast scan time points, we found malignant lesions demonstrated higher percentages of washout enhancement and more often exhibited washout as the predominant curve type when assessed at 7.5 minutes compared to 4.5 minutes. Conversely, benign lesions demonstrated only minimal differences between time points, with slightly increased percentage of washout enhancement at the later time point and no change in predominant curve type. Interestingly, worst curve classifications were not significantly different between time points for any lesion types. In general, lesions demonstrating washout typically did so by 4.5 minutes post-contrast. However, 8/206 (4%) malignancies exhibited washout only at the later 7.5 minutes time point and may have been misclassified at the earlier 4.5 minutes time point if presence of washout was a criterion for malignancy. These included 3 DCIS and 5 invasive cancers, underscoring the importance of standardizing in combination the MRI acquisition protocols, CAE analyses, and recommendations for diagnostic kinetics interpretation.
Breast lesions typically demonstrate a mixture of curve types, and a variety of metrics have been used to summarize lesion kinetics (7, 9, 20). In a study of 125 suspicious breast MRI lesions, Wang et al. compared several CAE kinetics parameters including initial peak enhancement, predominant and worst curve types. That study showed that delayed enhancement categorized by the worst curve best predicted malignancy. Those findings, along with our study demonstrating the relative robustness of the worst curve categorization across varying imaging timings further support the ACR guidelines for reporting the most suspicious curve types (4).
Our study demonstrated larger differences in washout characteristics between malignant and benign lesions at the later time point. However, ROC analysis showed no significant difference in ability to discriminate benign and malignant lesions based on the delayed-phase kinetic parameters by using the later versus the earlier time point. This suggests that the shorter scan protocol could be used without significant penalty in diagnostic accuracy using the delayed enhancement characteristics investigated in the study.
Limitations of our study include comparison of only two delayed post-contrast time points. We specifically compared kinetics assessments at 4.5 and 7.5 minutes, both of which have been used as final time points in clinical breast MRI protocols at our institution. Further investigation is required to better ascertain the optimal post-contrast scan timings to maximize diagnostic accuracy while minimizing examination times. Our DCE-MRI imaging protocol emphasized spatial resolution with moderate temporal resolution. Variability in MR scanning techniques and protocols could produce different results. Our study evaluated effects of post-contrast timing only on select semi-quantitative kinetics features; timing effects may be more significant for other diagnostic variables such as quantitative metrics obtained by DCE-MRI pharmacokinetics analysis. More advanced DCE-MRI approaches to improve diagnostic performance for evaluating breast lesions are an area of active research (21), and recent results have shown promise for achieving accurate pharmacokinetic modeling with shortened acquisitions (22). Further, distinction of benign and malignant lesions is primarily dependent on morphological characteristics (5), which our study did not evaluate as these features are typically assessed in the early dynamic phase within 2 minutes after contrast injection and therefore not impacted by choice of delayed phase scan timing. The AUC values reported did not take into account these and other valuable clinical factors also typically utilized in lesion diagnosis. The study incorporated only one type of contrast media (gadodiamide), and kinetics may vary with use of alternate contrast agents. Furthermore, the study utilized only a single MR scanner and CAE system and it is possible that results could vary depending upon differences in hardware and software (23).
In summary, we observed a statistically significant difference in delayed-phase kinetics patterns of breast lesions when assessed at 4.5 minutes and 7.5 minutes post-contrast, with invasive cancers in particular demonstrating greater volume percentages of washout at the later post-contrast time point. However, this difference did not translate to improved ability to discriminate benign from malignant lesions, suggesting that a shortened breast DCE-MRI protocol may not significantly impact overall diagnostic accuracy. In particular, the worst curve type, which is the recommended approach for classifying delayed enhancement kinetics under current ACR MRI BI-RADS guidelines, was least affected by the difference in time point and may facilitate optimal diagnostic performance across varied protocols.
Acknowledgments
Funding source:
This research was supported by grants from the National Institutes of Health (R01 CA151326, P50 CA138293) and a gift from the Safeway Foundation.
Footnotes
Publisher's Disclaimer: This is a PDF file of an unedited manuscript that has been accepted for publication. As a service to our customers we are providing this early version of the manuscript. The manuscript will undergo copyediting, typesetting, and review of the resulting proof before it is published in its final citable form. Please note that during the production process errors may be discovered which could affect the content, and all legal disclaimers that apply to the journal pertain.
References
- 1.DeMartini W, Lehman C, Partridge S. Breast MRI for cancer detection and characterization: a review of evidence-based clinical applications. Acad Radiol. 2008;15(4):408–16. doi: 10.1016/j.acra.2007.11.006. [DOI] [PubMed] [Google Scholar]
- 2.Kuhl CK. Current status of breast MR imaging. Part 2. Clinical applications. Radiology. 2007;244(3):672–91. doi: 10.1148/radiol.2443051661. [DOI] [PubMed] [Google Scholar]
- 3.Saslow D, Boetes C, Burke W, Harms S, Leach MO, Lehman CD, et al. American Cancer Society guidelines for breast screening with MRI as an adjunct to mammography. CA Cancer J Clin. 2007;57(2):75–89. doi: 10.3322/canjclin.57.2.75. [DOI] [PubMed] [Google Scholar]
- 4.Radiology. ACo. ACR Breast Imaging Reporting and Data System: Breast Imaging Atlas. Reston, VA: American College of Radiology; 2003. ACR BI-RADS: Magnetic Resonance imaging. [Google Scholar]
- 5.Mahoney MC, Gatsonis C, Hanna L, Demartini WB, Lehman C. Positive Predictive Value of BI-RADS MR Imaging. Radiology. 2012;264(1):51–8. doi: 10.1148/radiol.12110619. [DOI] [PMC free article] [PubMed] [Google Scholar]
- 6.Demartini WB, Kurland BF, Gutierrez RL, Blackmore CC, Peacock S, Lehman CD. Probability of malignancy for lesions detected on breast MRI: a predictive model incorporating BI-RADS imaging features and patient characteristics. Eur Radiol. 2011;21(8):1609–17. doi: 10.1007/s00330-011-2094-6. [DOI] [PubMed] [Google Scholar]
- 7.Kuhl CK, Mielcareck P, Klaschik S, Leutner C, Wardelmann E, Gieseke J, et al. Dynamic breast MR imaging: are signal intensity time course data useful for differential diagnosis of enhancing lesions? Radiology. 1999;211(1):101–10. doi: 10.1148/radiology.211.1.r99ap38101. [DOI] [PubMed] [Google Scholar]
- 8.Schnall MD, Blume J, Bluemke DA, DeAngelis GA, DeBruhl N, Harms S, et al. Diagnostic architectural and dynamic features at breast MR imaging: multicenter study. Radiology. 2006;238(1):42–53. doi: 10.1148/radiol.2381042117. [DOI] [PubMed] [Google Scholar]
- 9.Wang LC, DeMartini WB, Partridge SC, Peacock S, Lehman CD. MRI-detected suspicious breast lesions: predictive values of kinetic features measured by computer-aided evaluation. AJR Am J Roentgenol. 2009;193(3):826–31. doi: 10.2214/AJR.08.1335. [DOI] [PubMed] [Google Scholar]
- 10.Williams TC, DeMartini WB, Partridge SC, Peacock S, Lehman CD. Breast MR imaging: computer-aided evaluation program for discriminating benign from malignant lesions. Radiology. 2007;244(1):94–103. doi: 10.1148/radiol.2441060634. [DOI] [PubMed] [Google Scholar]
- 11.Radiology ACo. Breast Magnetic Resonance Imaging (MRI) Accreditation Program Requirements. Reston, VA: ACR; 2011. p. 13. [Google Scholar]
- 12.Weinreb J, Wilcox PA, Hayden J, Lewis R, Froelich J. ACR MRI accreditation: yesterday, today, and tomorrow. J Am Coll Radiol. 2005;2(6):494–503. doi: 10.1016/j.jacr.2004.11.004. [DOI] [PubMed] [Google Scholar]
- 13.Mann RM, Kuhl CK, Kinkel K, Boetes C. Breast MRI: guidelines from the European Society of Breast Imaging. Eur Radiol. 2008;18(7):1307–18. doi: 10.1007/s00330-008-0863-7. [DOI] [PMC free article] [PubMed] [Google Scholar]
- 14.Hendrick RE. Breast MRI: Fundamentals and Technical Aspects. New York, NY: Springer; 2008. [Google Scholar]
- 15.DeLong ER, DeLong DM, Clarke-Pearson DL. Comparing the areas under two or more correlated receiver operating characteristic curves: a nonparametric approach. Biometrics. 1988;44(3):837–45. [PubMed] [Google Scholar]
- 16.El Khouli RH, Macura KJ, Barker PB, Habba MR, Jacobs MA, Bluemke DA. Relationship of temporal resolution to diagnostic performance for dynamic contrast enhanced MRI of the breast. J Magn Reson Imaging. 2009;30(5):999–1004. doi: 10.1002/jmri.21947. [DOI] [PMC free article] [PubMed] [Google Scholar]
- 17.Kuhl C. The current status of breast MR imaging. Part I. Choice of technique, image interpretation, diagnostic accuracy, and transfer to clinical practice. Radiology. 2007;244(2):356–78. doi: 10.1148/radiol.2442051620. [DOI] [PubMed] [Google Scholar]
- 18.Moon M, Cornfeld D, Weinreb J. Dynamic contrast-enhanced breast MR imaging. Magn Reson Imaging Clin N Am. 2009;17(2):351–62. doi: 10.1016/j.mric.2009.01.010. [DOI] [PubMed] [Google Scholar]
- 19.Gutierrez RL, Strigel RM, Partridge SC, Demartini WB, Eby PR, Stone KM, et al. Dynamic Breast MRI: Does Lower Temporal Resolution Negatively Affect Clinical Kinetic Analysis? AJR Am J Roentgenol. 2012;199(3):703–8. doi: 10.2214/AJR.11.7836. [DOI] [PubMed] [Google Scholar]
- 20.El Khouli RH, Macura KJ, Jacobs MA, Khalil TH, Kamel IR, Dwyer A, et al. Dynamic contrast-enhanced MRI of the breast: quantitative method for kinetic curve type assessment. AJR Am J Roentgenol. 2009;193(4):W295–300. doi: 10.2214/AJR.09.2483. [DOI] [PMC free article] [PubMed] [Google Scholar]
- 21.Huang W, Tudorica LA, Li X, Thakur SB, Chen Y, Morris EA, et al. Discrimination of benign and malignant breast lesions by using shutter-speed dynamic contrast-enhanced MR imaging. Radiology. 2011;261(2):394–403. doi: 10.1148/radiol.11102413. [DOI] [PMC free article] [PubMed] [Google Scholar]
- 22.Chen H, Olson ML, Partridge SC, Kerwin W. Reducing the scan time in quantitative dynamic contrast enhanced MRI of the breast using the extended graphical model. International Society of Magnetic Resonance in Medicine 21st Annual Meeting; April 22, 2013; Salt Lake City, UT. 3059. [Google Scholar]
- 23.Jansen SA, Shimauchi A, Zak L, Fan X, Wood AM, Karczmar GS, et al. Kinetic curves of malignant lesions are not consistent across MRI systems: need for improved standardization of breast dynamic contrast-enhanced MRI acquisition. AJR Am J Roentgenol. 2009;193(3):832–9. doi: 10.2214/AJR.08.2025. [DOI] [PMC free article] [PubMed] [Google Scholar]